
The Sun Sets on the Summer Season
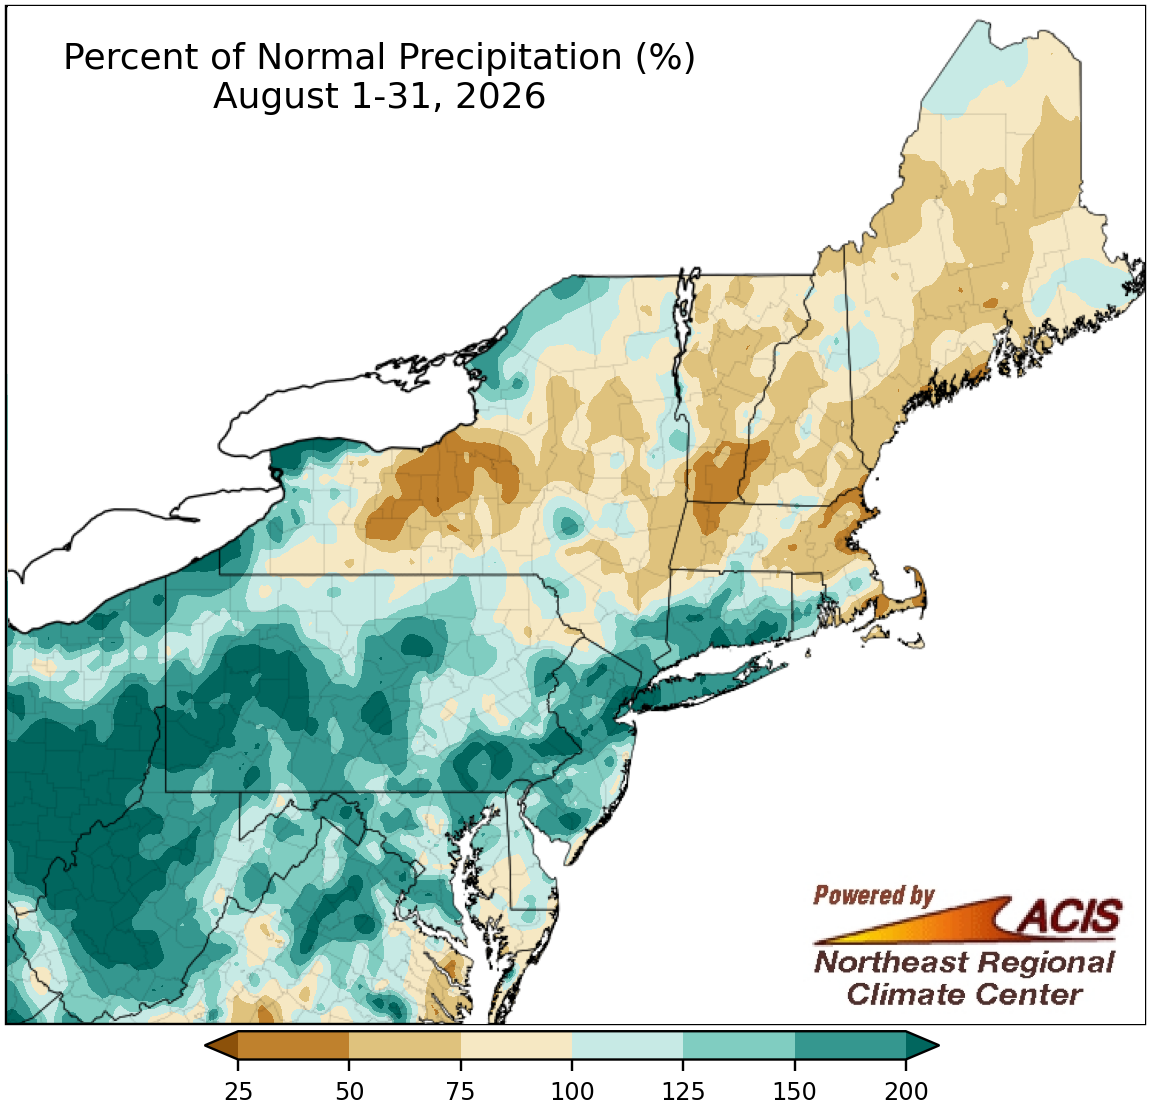
August precipitation ranged from less than 50% of normal to over 200% of normal.
Precipitation amounts during August were highly variable. Northern New England, much of Massachusetts, and a large swath of New York saw below-normal precipitation, with the driest areas seeing less than 50% of normal. At the opposite extreme, much of the Mid-Atlantic, Connecticut, and part of Rhode Island saw above-normal precipitation, with the wettest locations receiving over 200% of normal precipitation. This brought drought relief to the wet areas but led to deteriorating conditions in the drier locations.
At the Northeast's 35 major sites, August precipitation ranged from 30% of normal in Boston, MA, to 291% of normal in Charleston, WV, with 25 of the sites on the wet side of normal. In fact, Charleston had its wettest August (and third all-time wettest month) on record, while another 14 of the sites had one of their 20 wettest Augusts. However, this August ranked among the 10 driest for two major sites.
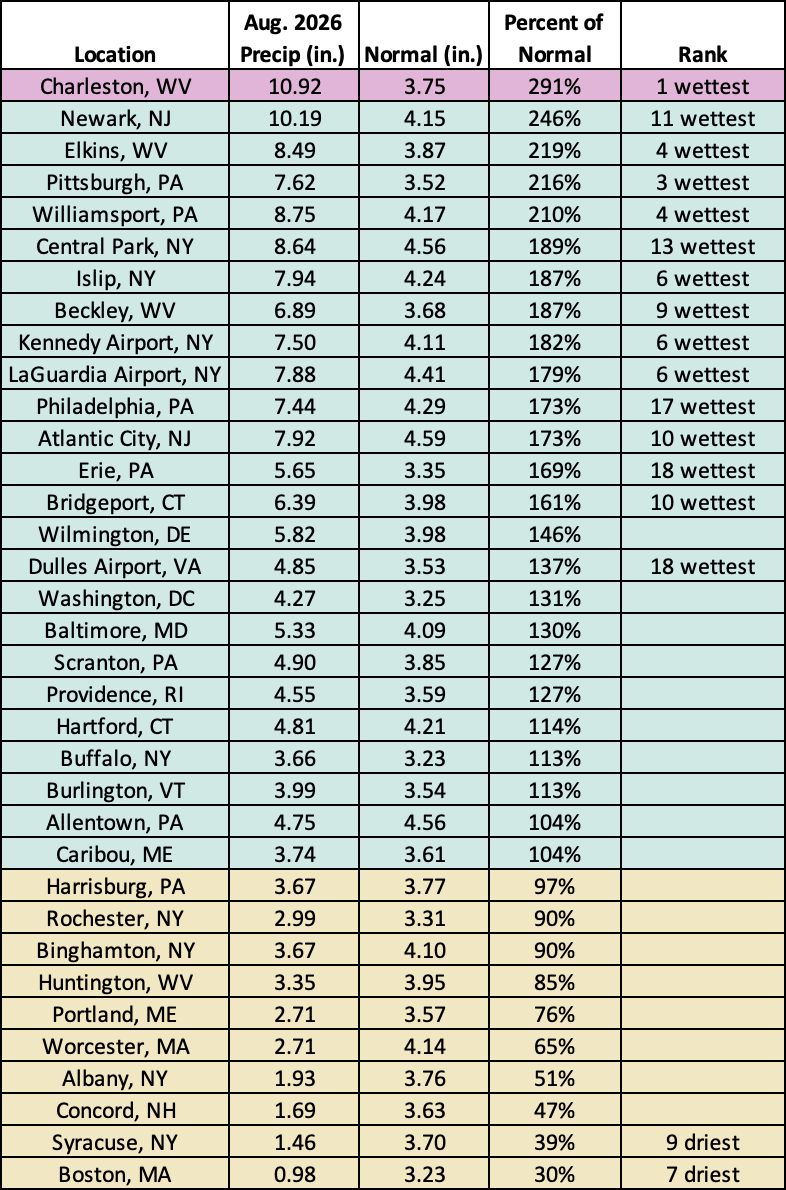
This August was record wet for Charleston, WV, and among the 20 wettest Augusts for 14 additional major sites. However, it was among the 10 driest Augusts for two other major sites.
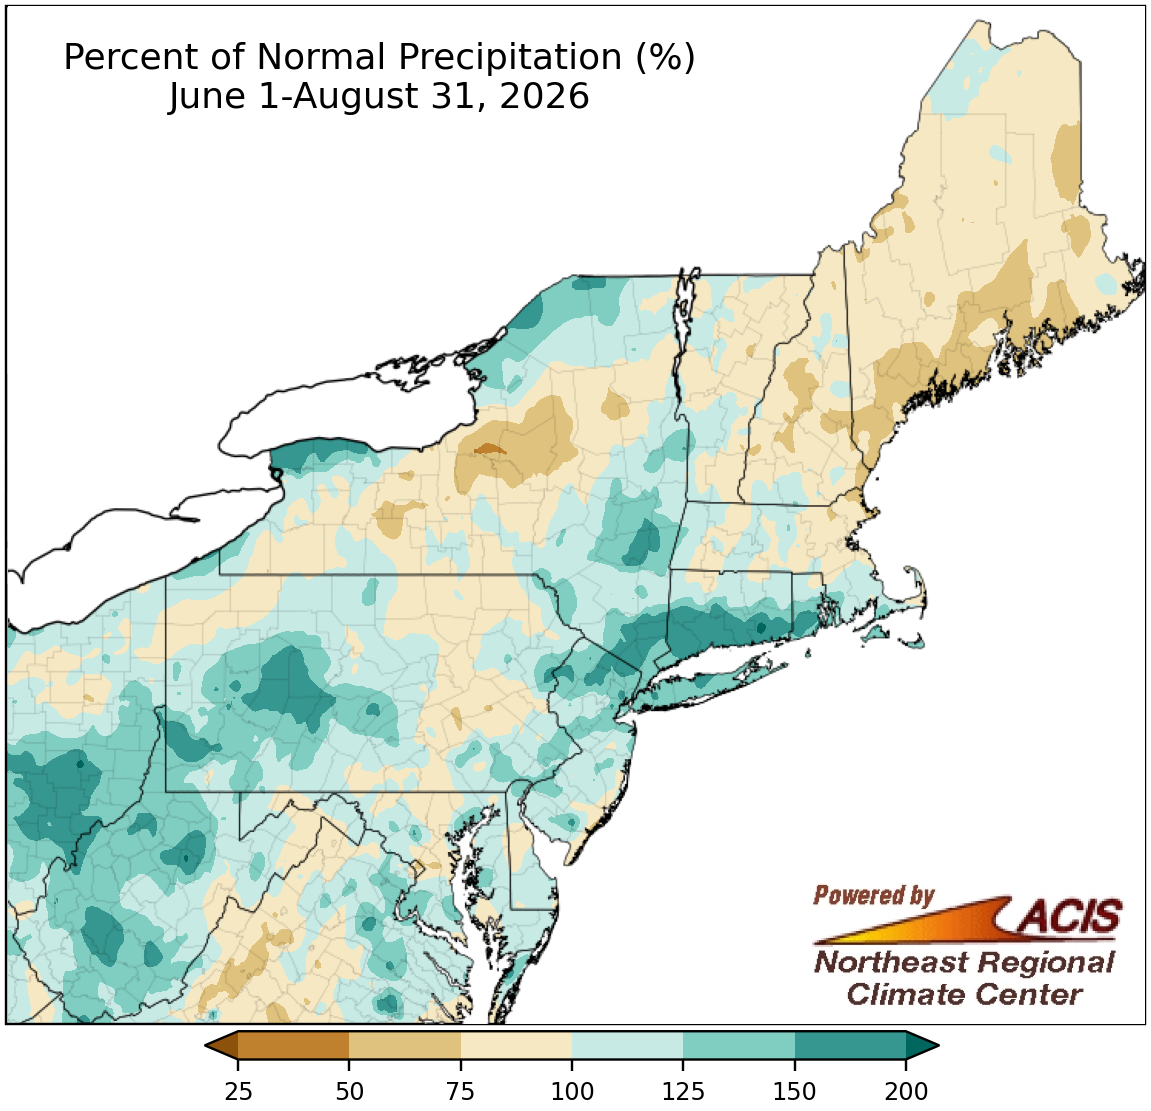
Summer precipitation ranged from less than 75% of normal to over 150% of normal.
Precipitation totals for the summer season also varied, from less than 75% of normal in places like central New York and coastal Maine to over 150% of normal in places like southern Connecticut and western Pennsylvania. Summer precipitation at the Northeast's 35 major sites ranged from 66% of normal in Syracuse, NY, to 192% of normal in Bridgeport, CT, with 25 of the sites being wetter than normal. Summer 2026 was the wettest summer on record for Bridgeport, CT, and among the 20 wettest for an additional 13 major sites.
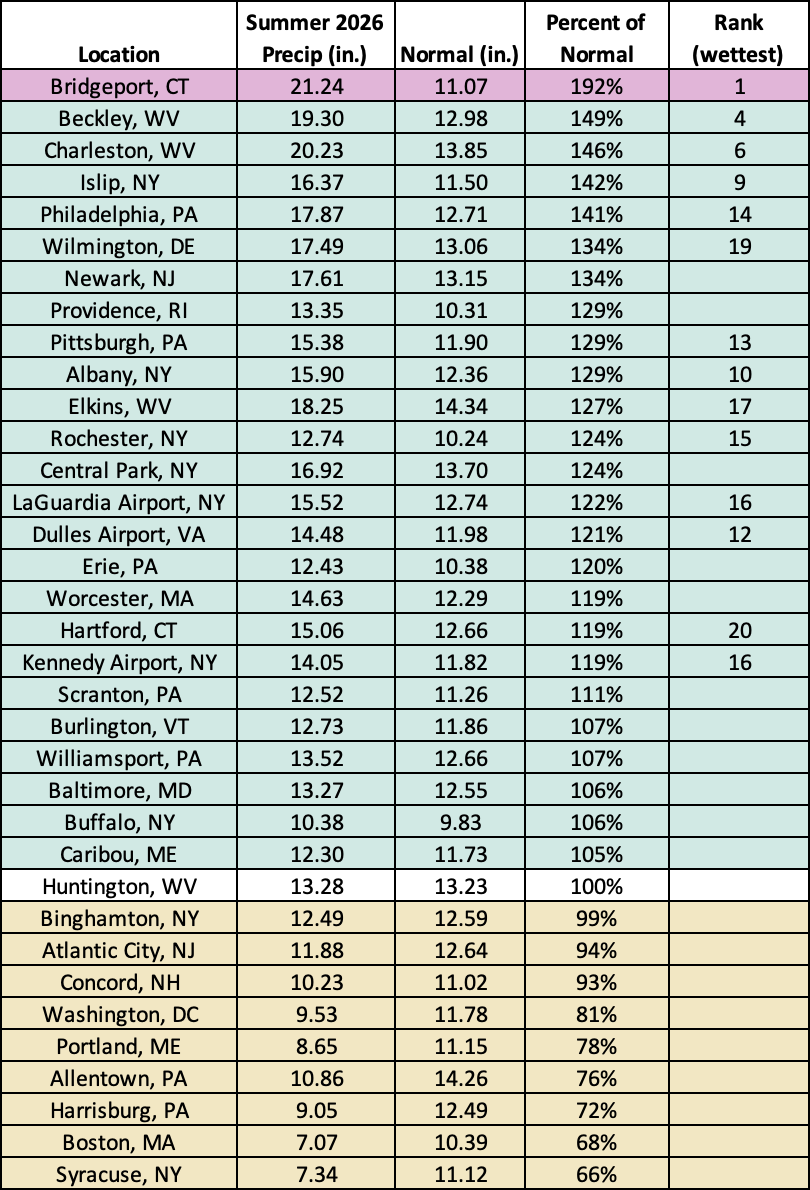
Summer 2026 was record wet for Bridgeport, CT, and among the 20 wettest for another 13 major sites.
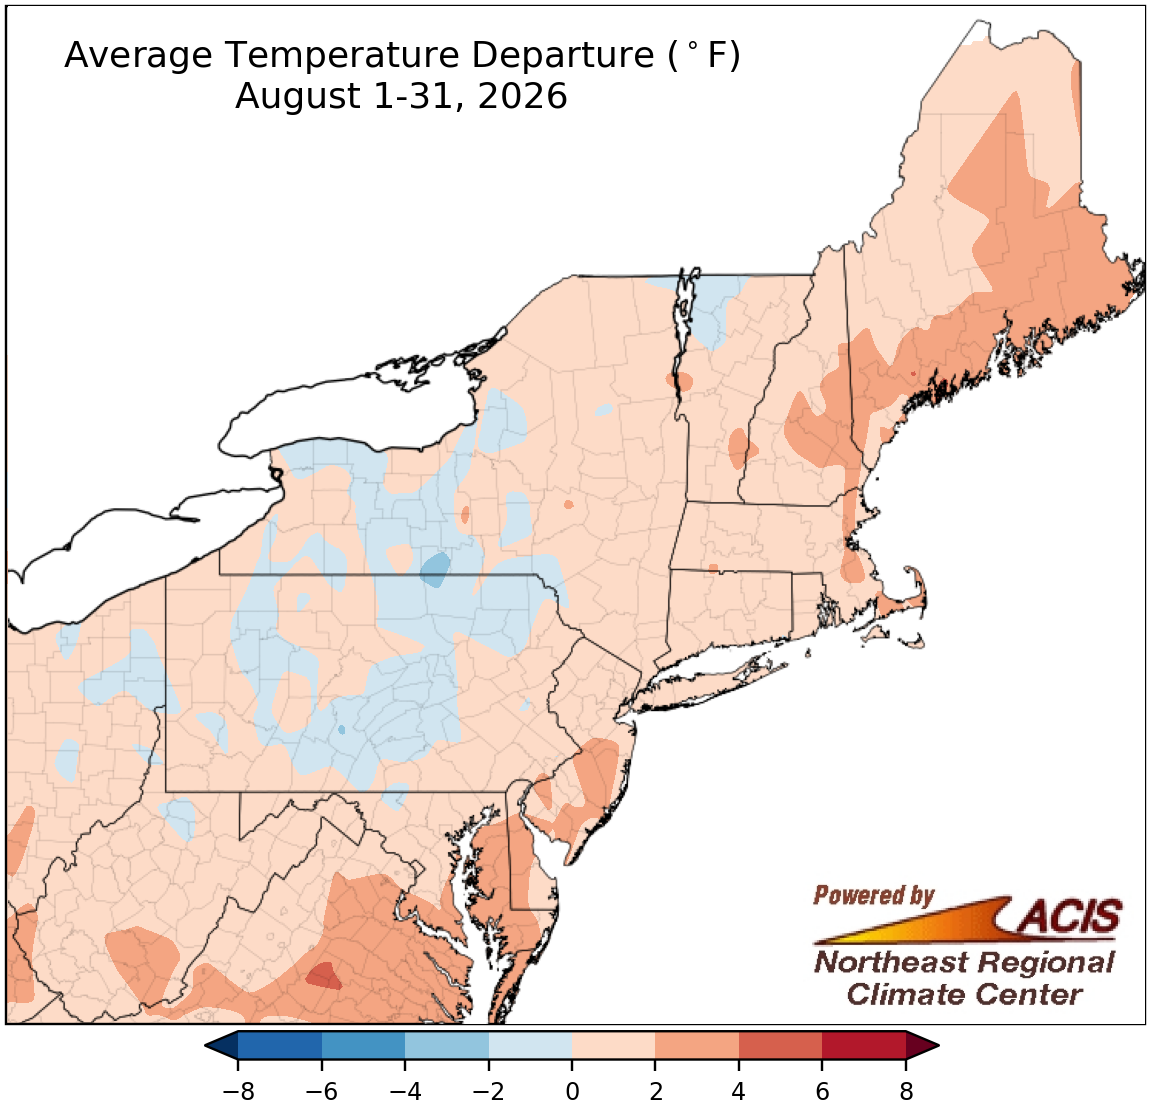
August average temperatures ranged from 2°F below normal to 4°F above normal.
Average temperatures for August ranged from 2°F cooler than normal in some interior locations to 4°F above normal in some coastal areas. At the Northeast's 35 major sites, August average temperatures ranged from 1.3°F below normal in Scranton, PA, to 3.3°F above normal in Beckley, WV, with 28 of the sites being hotter than normal. This August ranked among the 20 hottest Augusts on record for 15 of the sites.
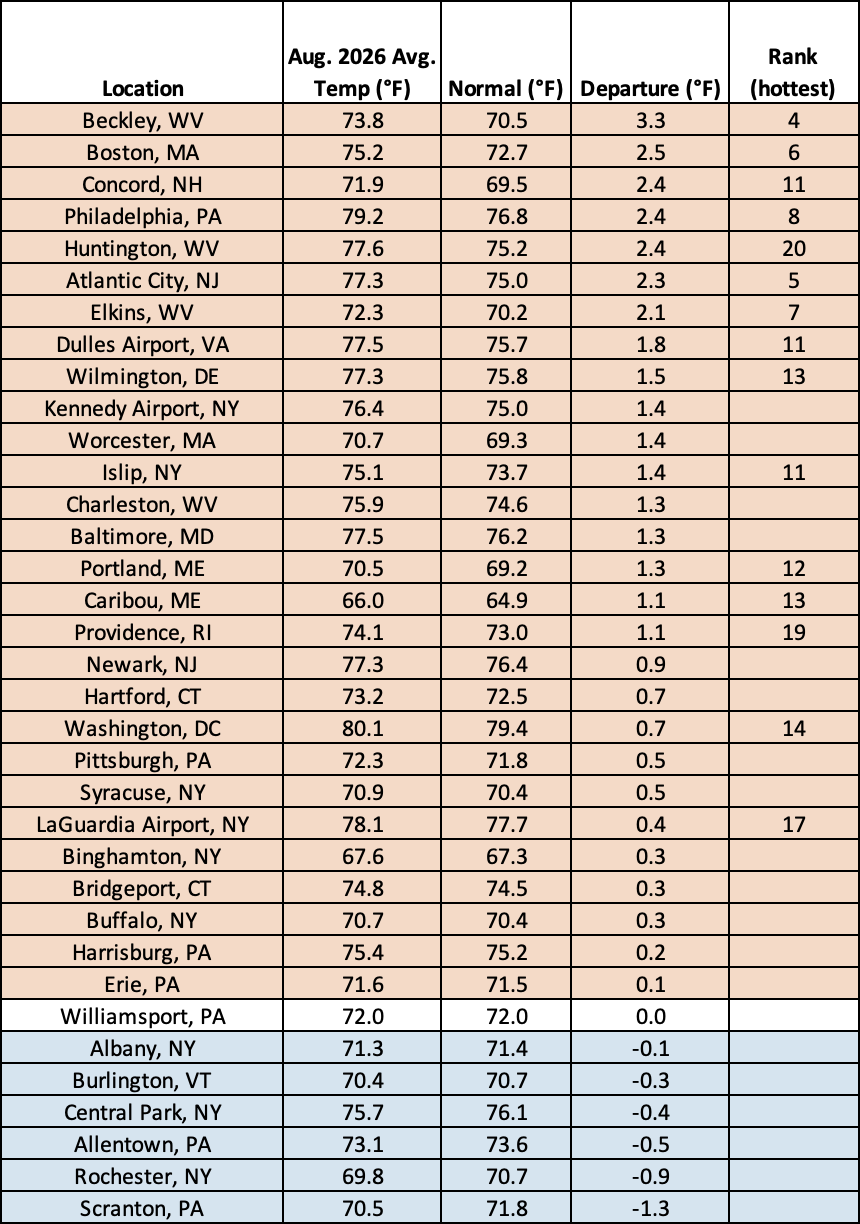
This August ranked among the 20 hottest Augusts on record for 15 major sites.
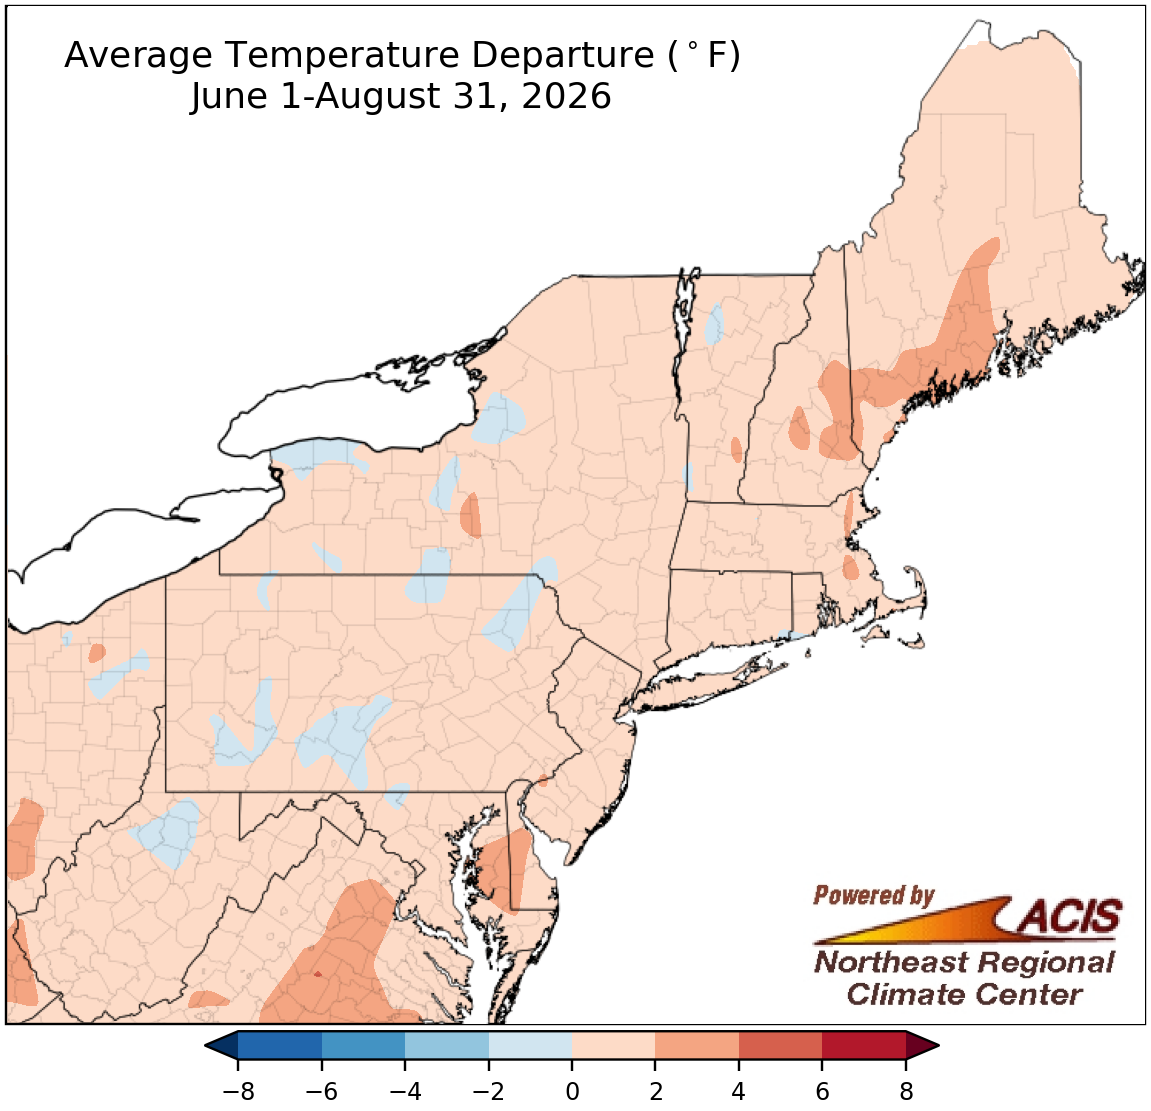
Summer average temperatures ranged from 2°F below normal to 4°F above normal.
Most of the Northeast averaged out to be within 2°F of normal for the summer season, with the slightly cooler-than-normal spots generally in more interior locations. However, a couple of locations closer to the coast were more than 2°F hotter than normal. Summer average temperatures at the region's 35 major sites ranged from 0.7°F below normal in Scranton, PA, to 2.4°F above normal in Philadelphia, PA, with 31 of the sites being hotter than normal. Summer 2026 ranked among the 20 hottest summers on record for 22 major sites.
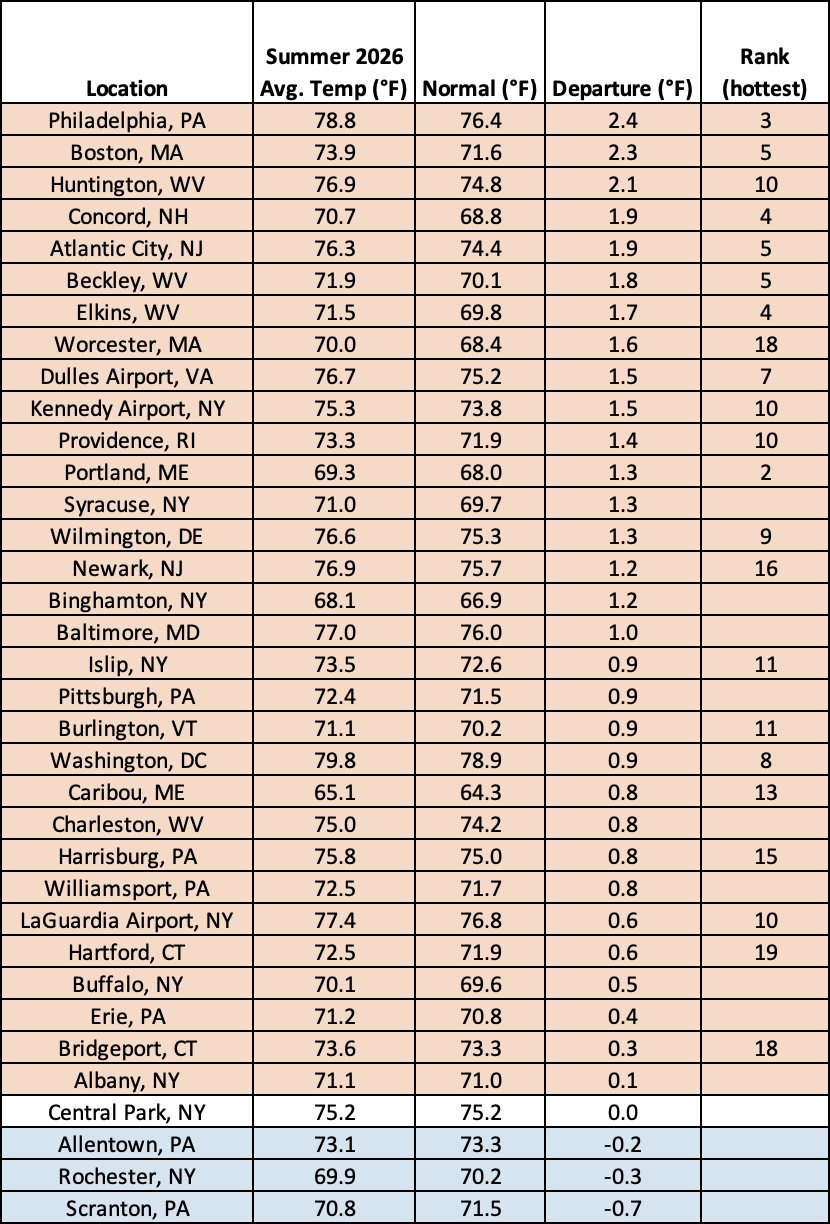
Summer 2026 ranked among the 20 hottest summers on record for 22 major sites.
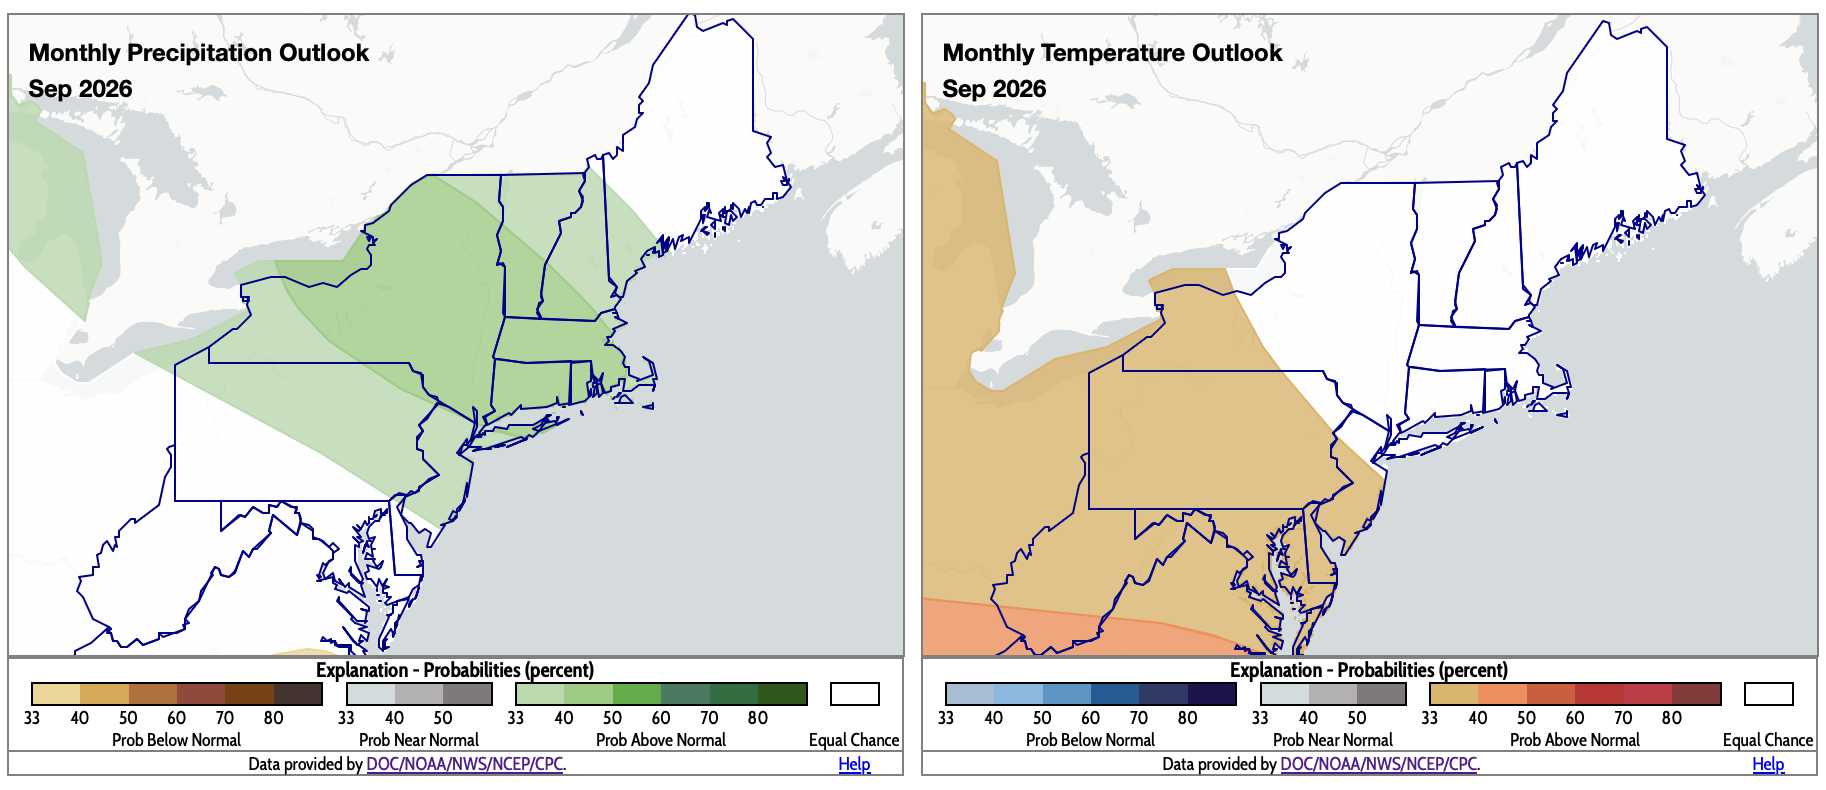
September is expected to be wetter than normal for a large portion of the Northeast (shaded green) and warmer than normal for much of the Mid-Atlantic and part of New York (shaded orange). Click to enlarge.
The September precipitation outlook from NOAA's Climate Prediction Center favors wetter-than-normal conditions for New York, much of New England, most of New Jersey, and northern and eastern parts of Pennsylvania. Equal chances of below-, near-, and above-normal precipitation was predicted elsewhere in the region. Above-normal temperatures are favored for most of the Mid-Atlantic and western and central portions of New York, with the rest of the Northeast in the equal chances category.