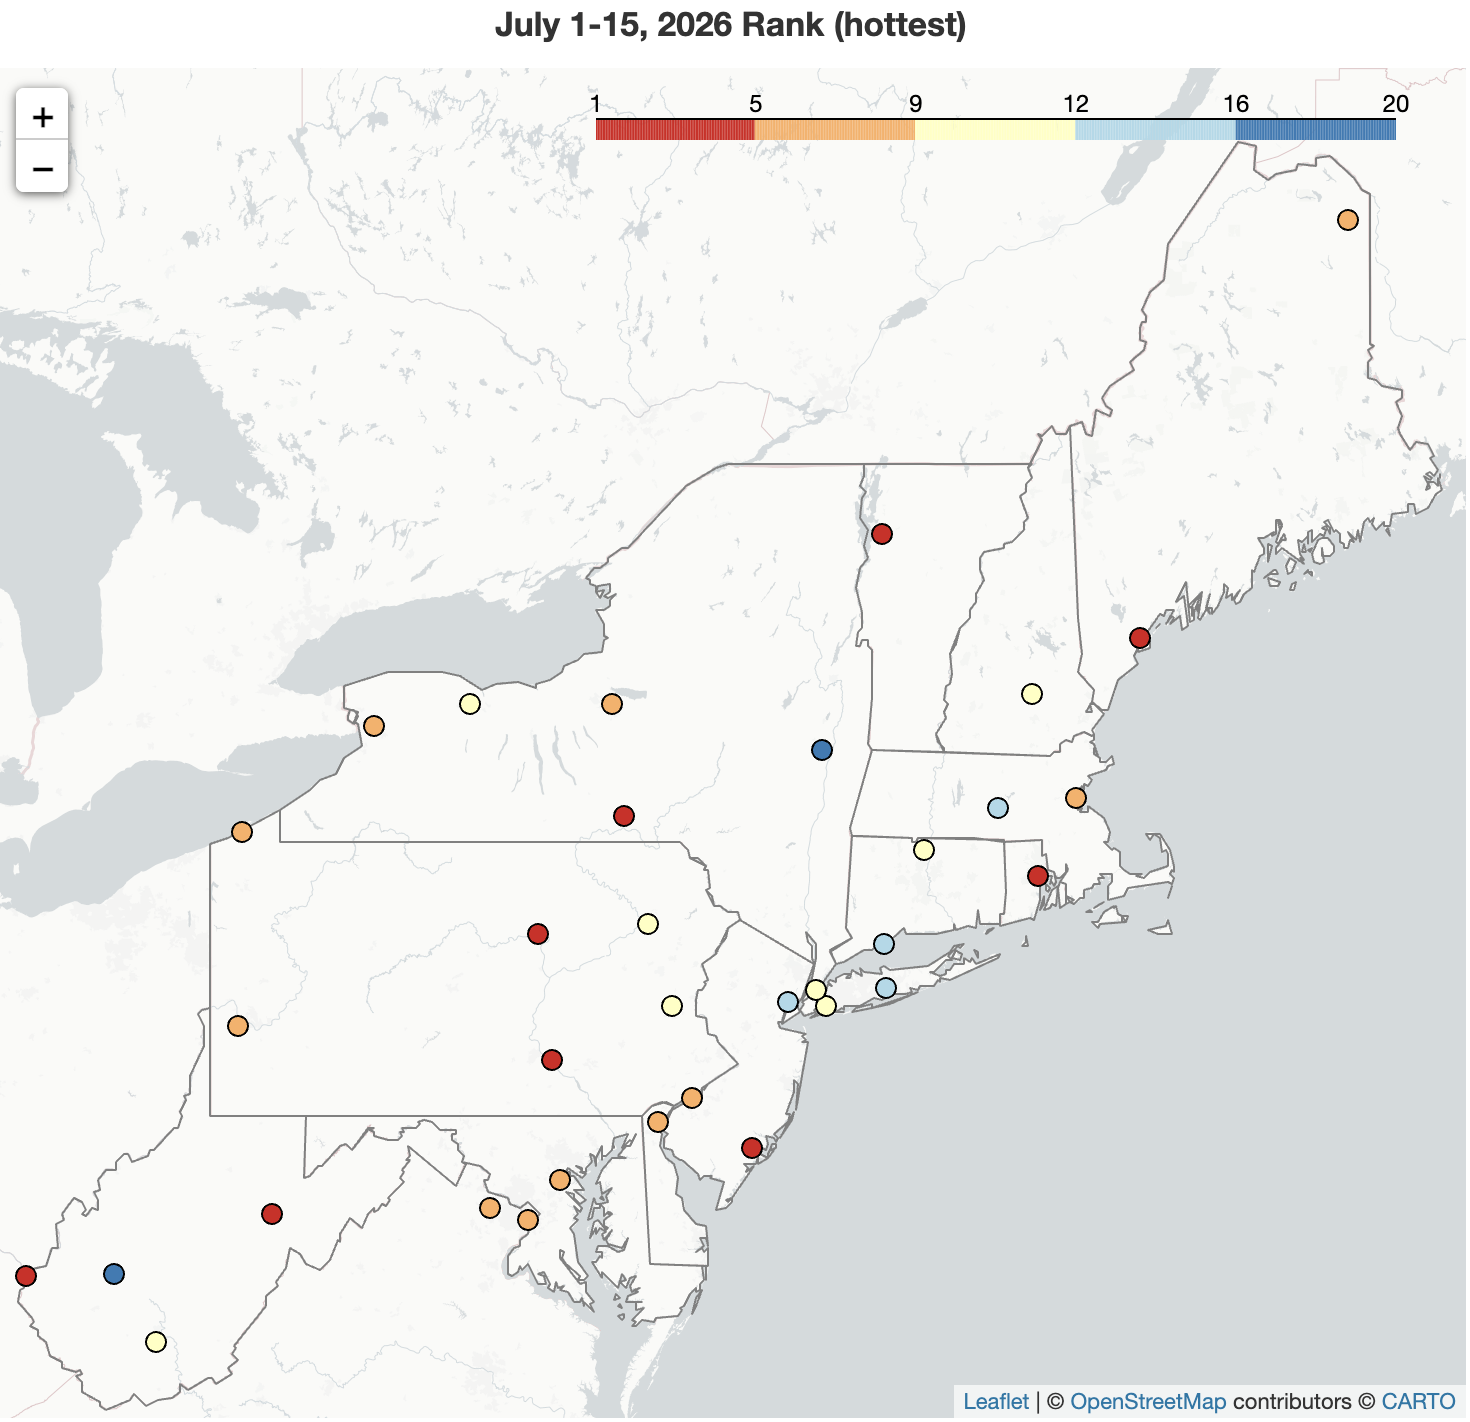
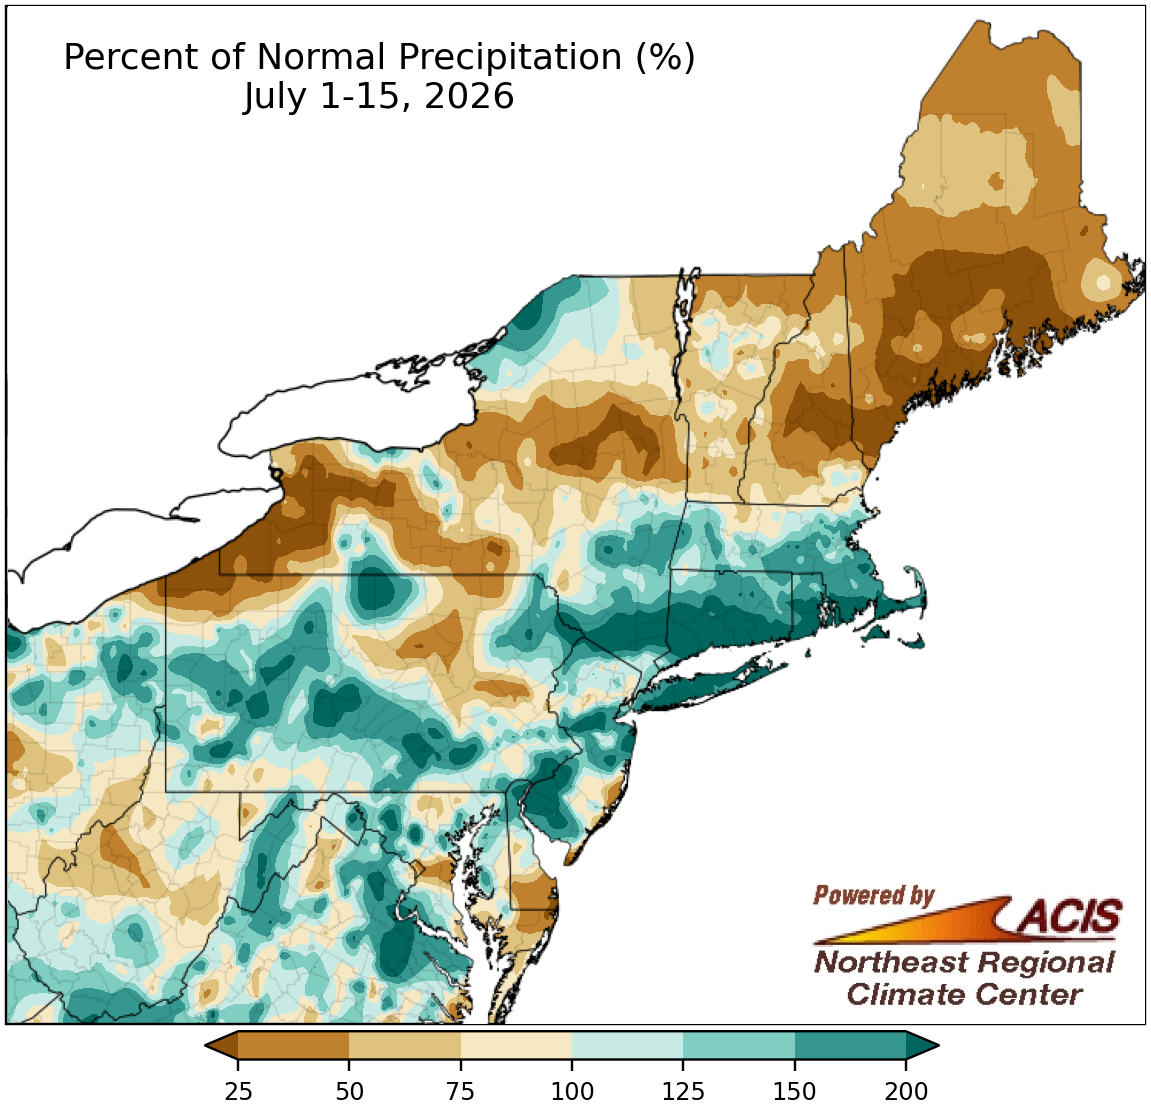
A Record Hot, Record Dry Start to July
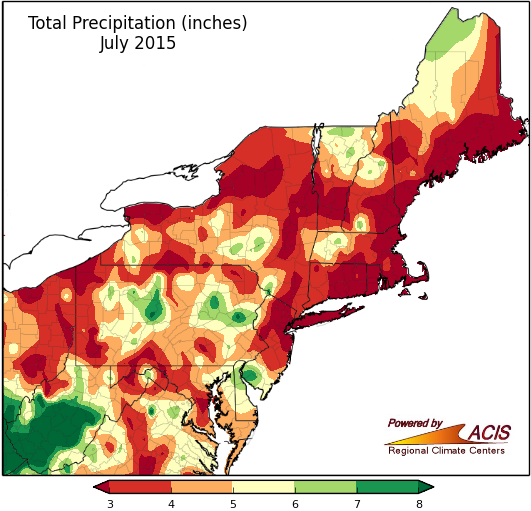
The first half of July was hotter than normal for the entire Northeast, with Elkins, WV, and Atlantic City, NJ, having their hottest such period on record. There were precipitation extremes across the region for the July 1-15 period - from record dry with 1% of normal in Portland, ME, to second wettest with 355% of normal in Bridgeport, CT.
Read more in the NRCC BlogNortheast News
More Improvements This Week
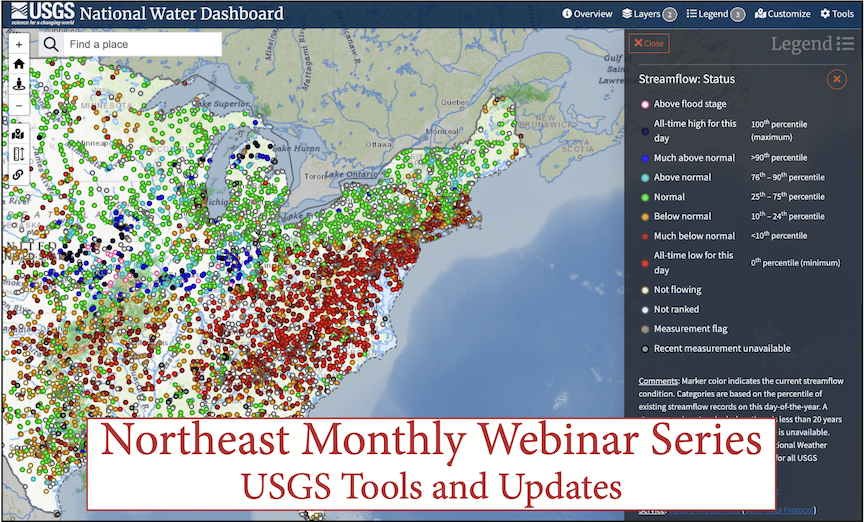
The U.S. Drought Monitor released on Thursday, July 30 showed drought and/or abnormally dry conditions improve in several areas across the Northeast where locally heavy rainfall increased streamflow, groundwater levels, and/or soil moisture. However, conditions deteriorated in parts of Maine where rainfall has been limited and streamflow, groundwater levels, and soil moisture declined. There were generally limited changes elsewhere in the region.
- Extreme drought contracted on the Delmarva Peninsula.
- Severe and/or moderate drought shrank in parts of southern New England, southeastern New York, the coastal Mid-Atlantic, and West Virginia.
- Moderate drought and abnormal dryness expanded in coastal and eastern Maine.
- Record-low seven-day streamflow was found in places like southeastern Pennsylvania, coastal New Jersey, and central Maine.
- Groundwater levels were record low in several areas including parts of Maryland, southeastern Pennsylvania, southern New Jersey, and southern Maine.
- The short-term outlooks for August 4-12 predict above-normal temperatures and above-normal precipitation for the Northeast, which could potentially bring improvements to locations that see notable rainfall amounts or keep conditions unchanged in areas that see less.
Website Highlights
Weather Station Data
Weather Station Data includes location-specific information, such as wind data, evapotranspiration, and daily almanacs.
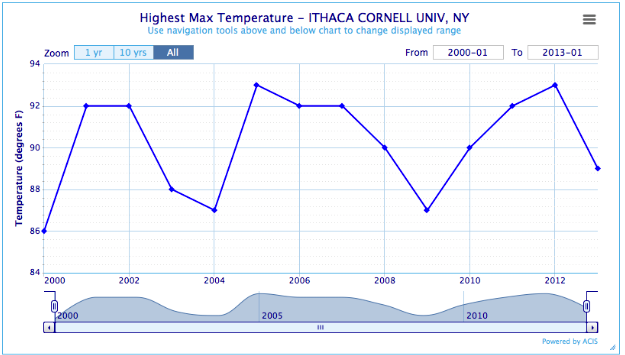
CLIMOD 2 is a user-friendly website to find single-station and multi-station climate products for locations accross the country. For example, the Seasonal Ranking report produces a graph and table of extremes or other summaries for a specified period for each year.
Go to CLIMOD 2State & Regional Analyses
These provide several map types, regional climate summaries, snow survey data, and drought information.
The Monthly Maps offer a variety of monthly precipitation and temperature departure maps for any given month for the Northeast region or a selected state.
Go to Monthly Map pageAnalyses for Industry
Analyses for Industry shows products the NRCC has created through partnerships with various industries.
The Turf Grass page offers weather for the turfgrass industry, including disease risk, turf and weed development, irrigation information, and heat stress.
Go to Turfgrass pageWebinars & Workshops
Webinars & Workshops provides recordings and presentations from the monthly webinar series, as well as information on past and upcoming workshops.
The Northeast Regional Climate Center hosts a monthly webinar series with NOAA affiliates to address timely weather topics.
Go to Monthly WebinarsPublications & Services
Publications & Services includes the NRCC blog, quarterly outlooks, as well as other reports and publications.
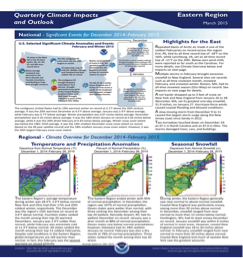
The Quarterly Outlooks are seasonal climate highlights and outlook for the upcoming season for the Eastern, Region, Great Lakes, and Gulf of Maine. Published in March, June, September and December.
Go to Quarterly Reports