January - Wet but Not Necessarily Snowy
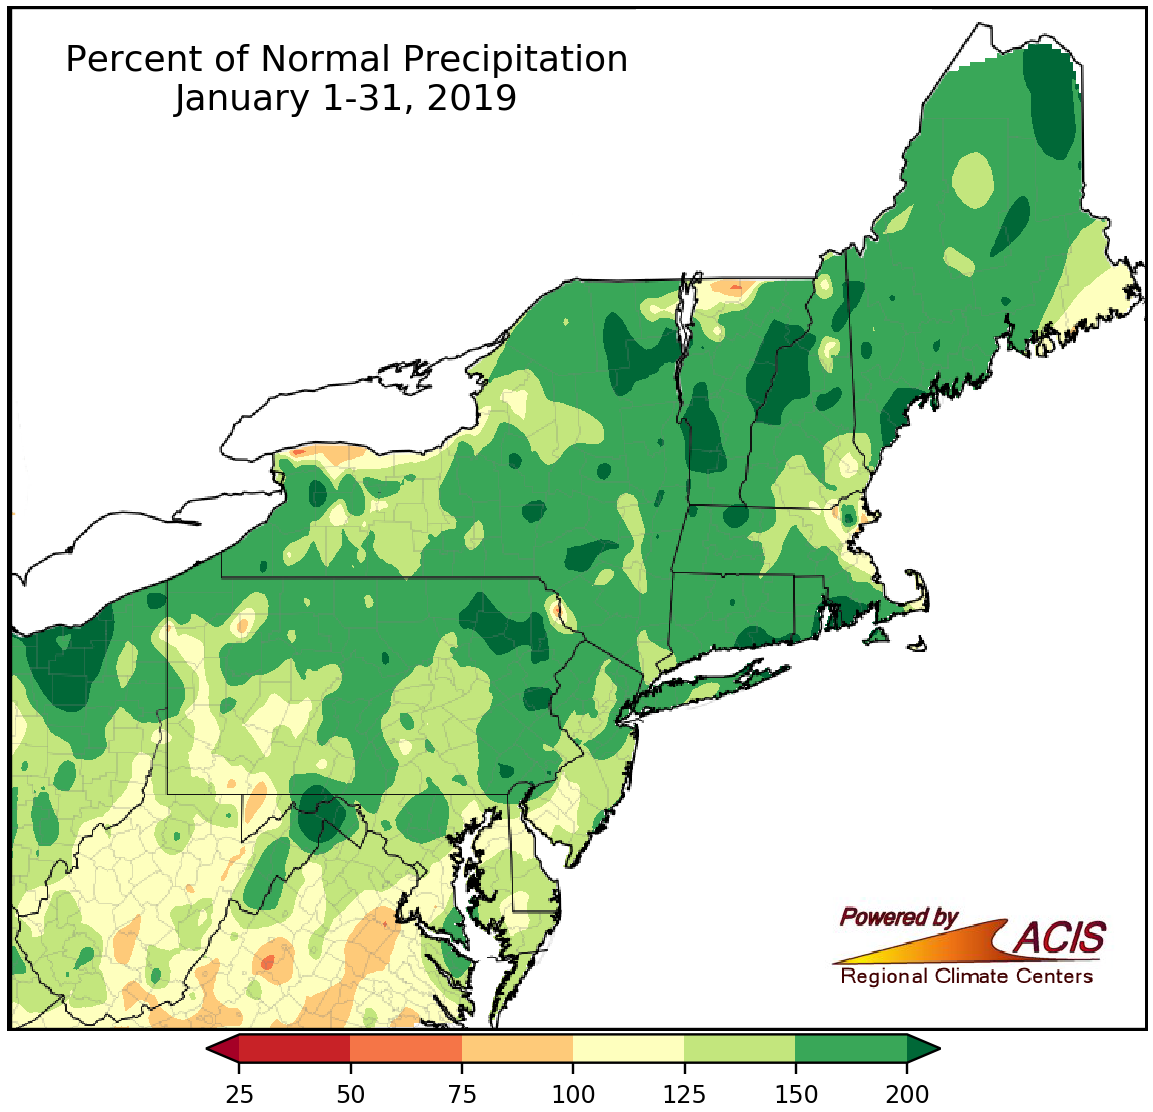
For a large portion of the region, January precipitation ranged from 125% to 200% of normal.
It was a wetter-than-normal January for almost the entire Northeast, with precipitation generally ranging from near normal to more than 200% of normal. All but two major climate sites were wetter than normal in January, with 17 sites ranking this January among their 20 wettest. In fact, it was the wettest January on record for Caribou, ME. The wet conditions helped abnormal dryness ease across northern New York and northern New England, making it the first time since June 6, 2017, that the Northeast was free of drought and abnormal dryness.
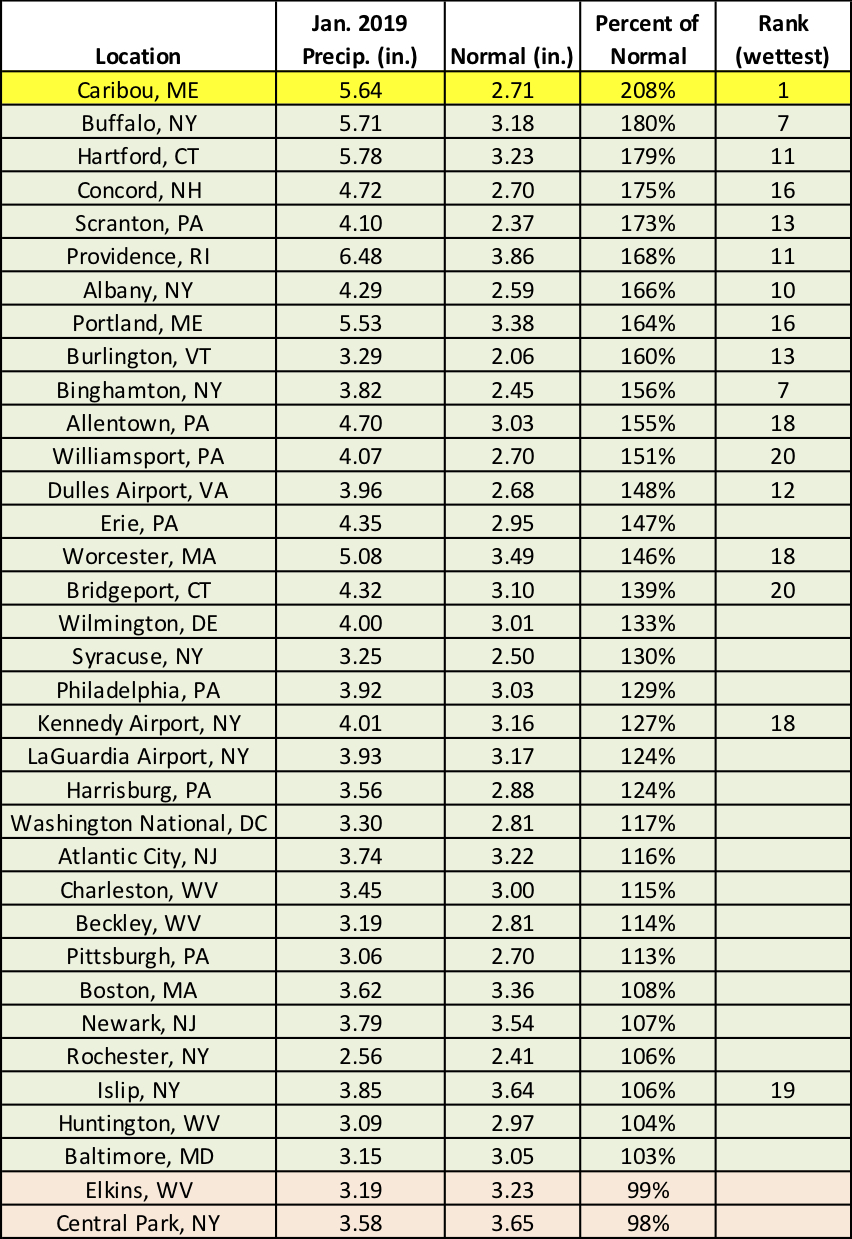
Seventeen major climate sites ranked this January among their 20 wettest, with Caribou, ME, being record wet.
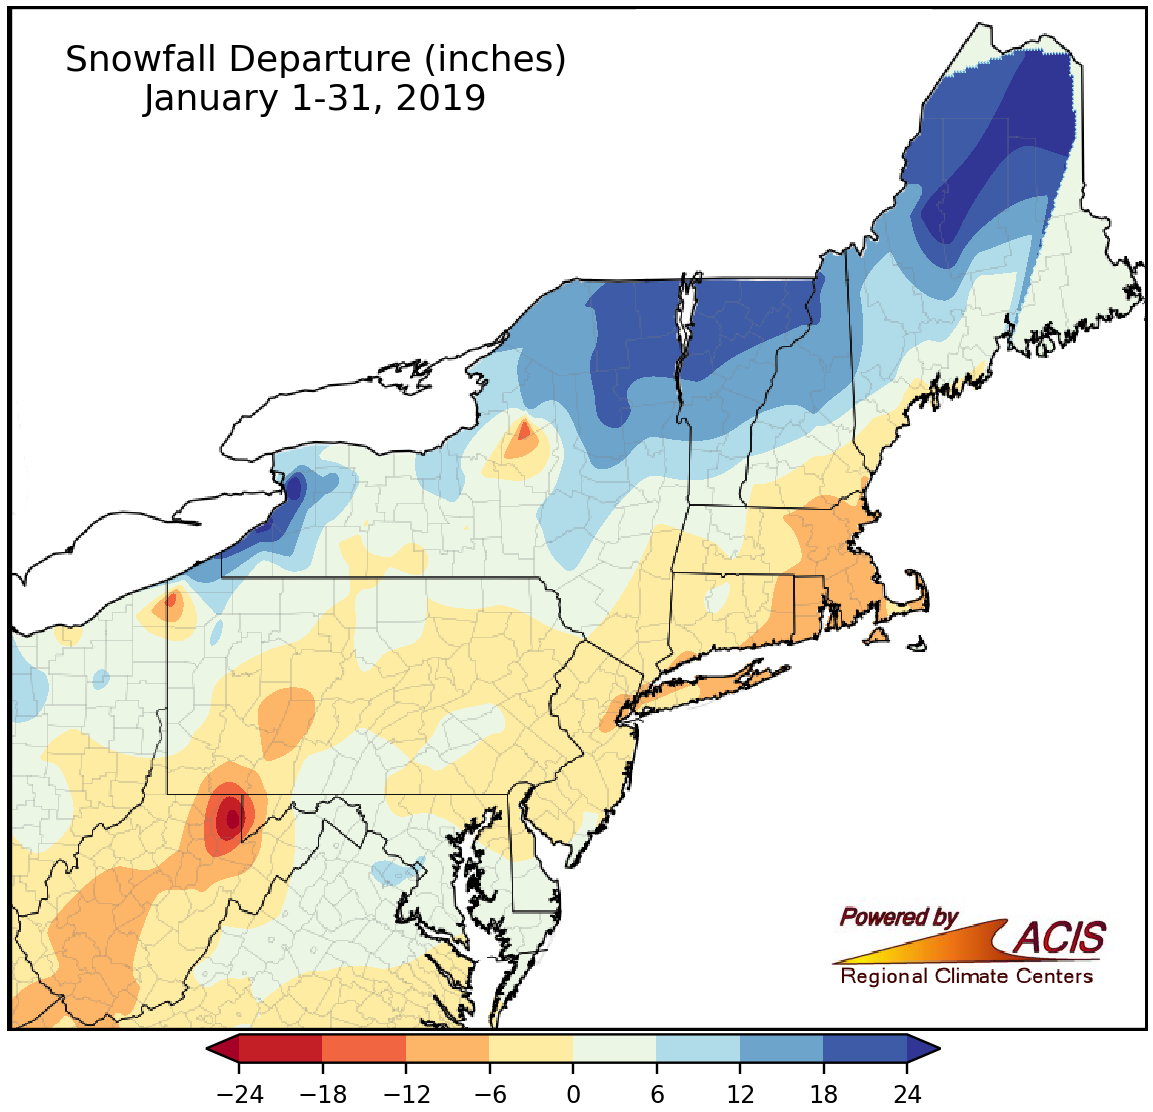
January snowfall ranged from 24 inches below normal to more than 24 inches above normal.
Despite most of the region being wetter than normal, snowfall was variable, generally ranging from 24 inches below normal to more than 24 inches above normal. The greatest surpluses were found east of Lake Erie in New York and in northern Maine. In fact, Caribou, ME, had its snowiest January on record. This January also was only 0.1 inches short of tying December 1972 as the site’s all-time snowiest month on record. Six additional sites ranked this January among their 20 snowiest on record. The greatest snowfall deficits were found in the higher elevations of northern West Virginia. Eight major climate sites ranked this January among their 20 least snowy.
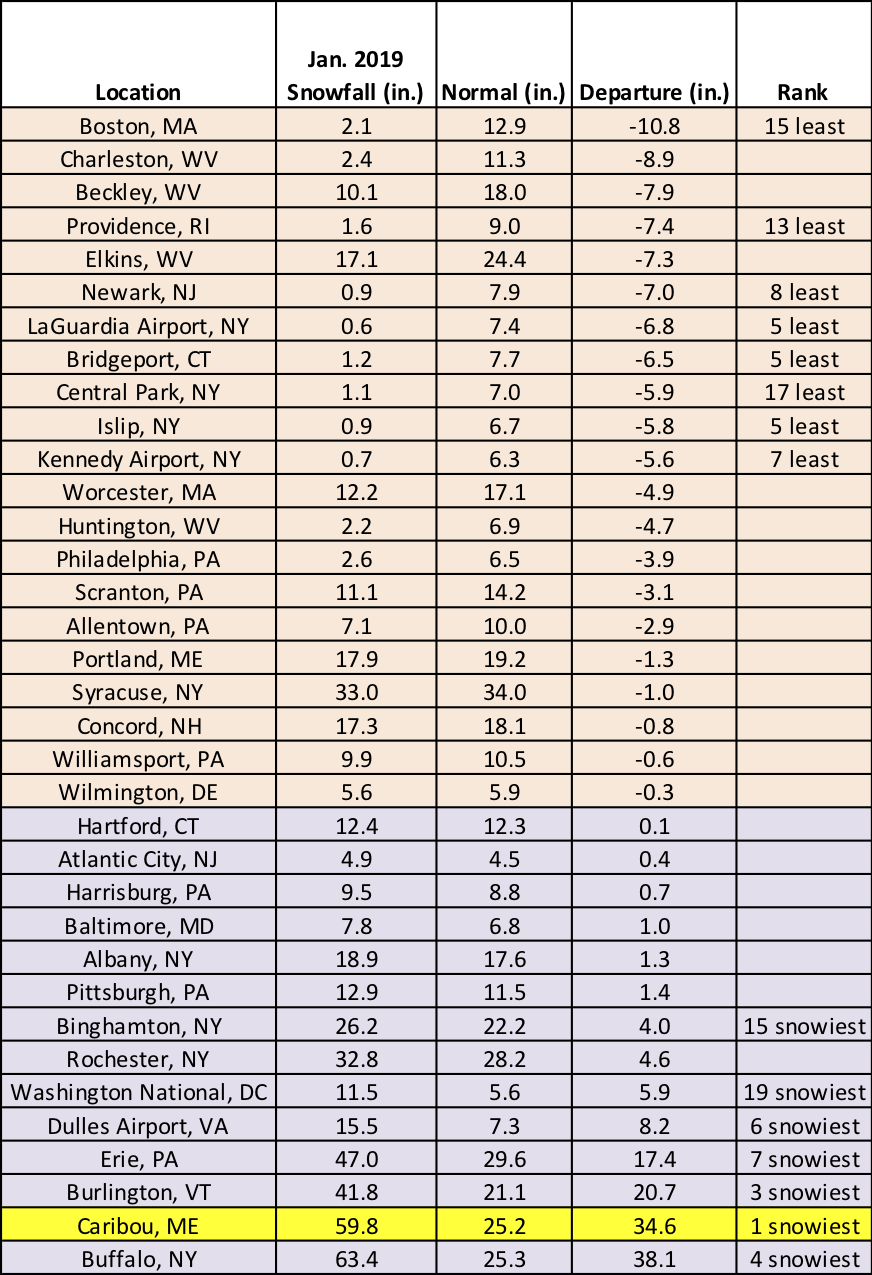
Caribou, ME, had a record snowy January. While 14 sites were snowier than normal, 21 sites received below-normal January snowfall.
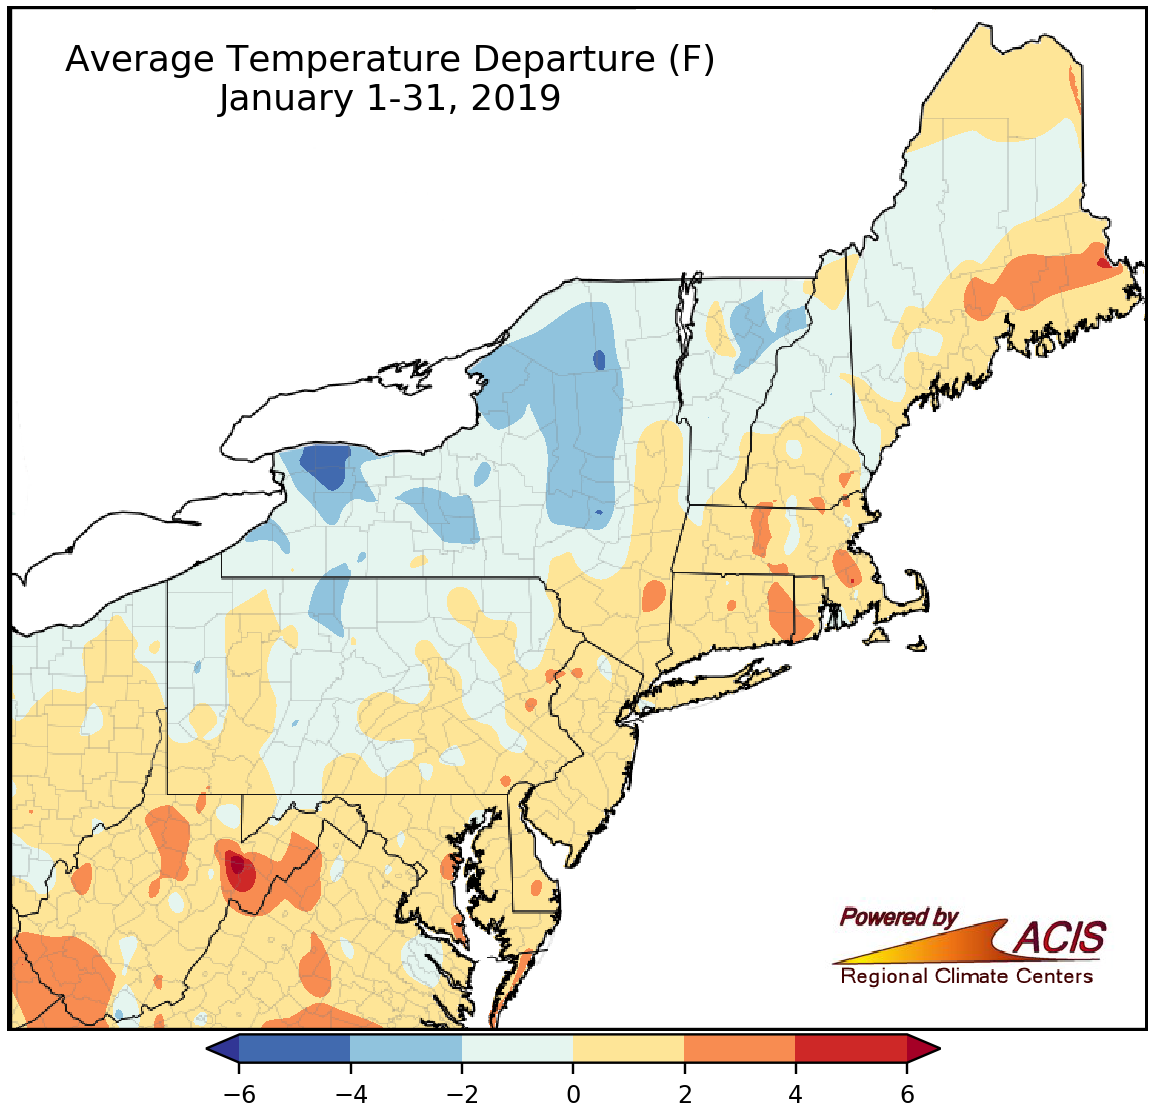
January average temperatures ranged from 4°F below normal to 4°F above normal for most of the Northeast.
With several temperature swings during the month, much of the Northeast wrapped up January within 2°F of normal. Some colder spots of 2-6°F below normal were found in New York, northern Vermont, and northern Pennsylvania. In addition, a few warmer spots of 2-6°F above normal were found in West Virginia, southern New England, and eastern Maine. The major climate sites were nearly split, with 19 being warmer than normal for January and 15 being colder than normal.
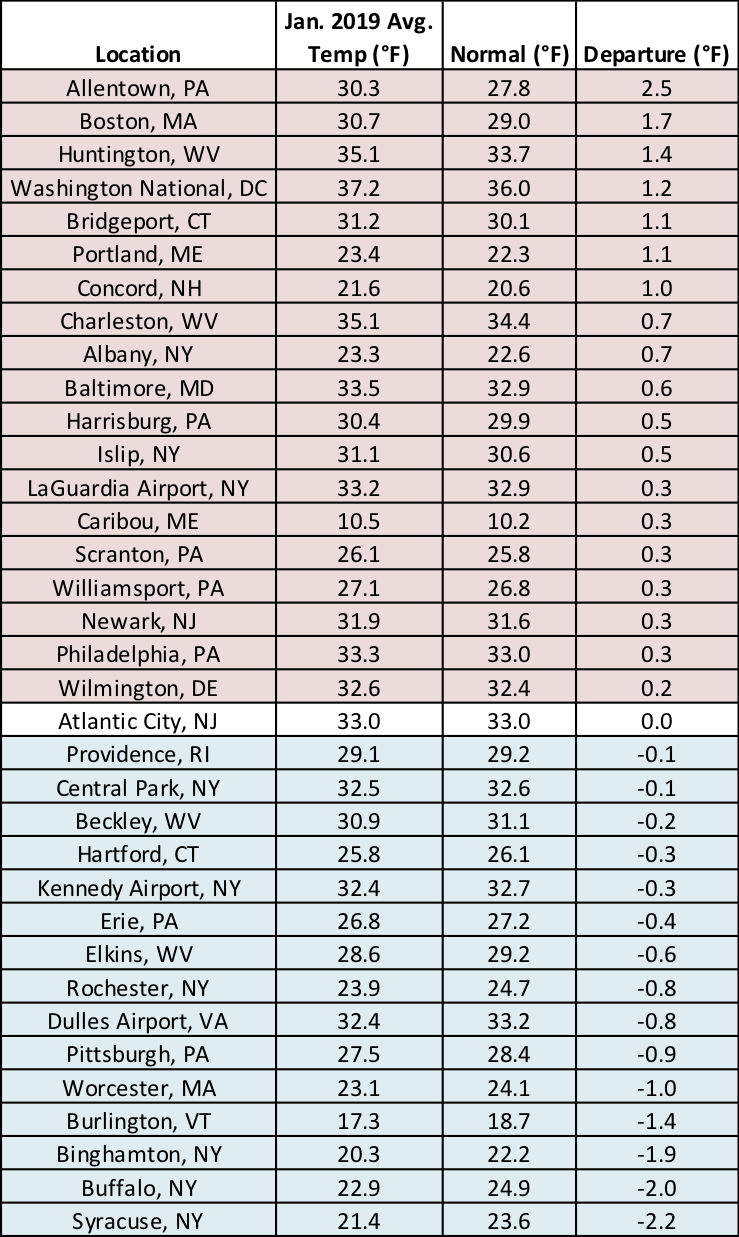
Average temperatures for January at the major climate sites ranged from 2.2°F below normal in Syracuse, NY, to 2.5°F above normal in Allentown, PA.
The wet conditions of January are expected to continue through February according to the Climate Prediction Center’s outlook, which indicates increased chances of above-normal precipitation for the entire Northeast for February. As for temperatures, most of the Northeast falls into the equal chances category, meaning equal chances of below-, near-, or above-normal temperatures. However, there is a slight tilt towards warmer-than-normal temperatures for the southeastern corner of the region.
The February precipitation outlook indicates increased chances of above-normal precipitation for the Northeast.
NOAA’s Climate Prediction Center February temperature outlook indicates equal chances of below-, near-, or above-normal temperatures for most of the Northeast.