Drought Resources
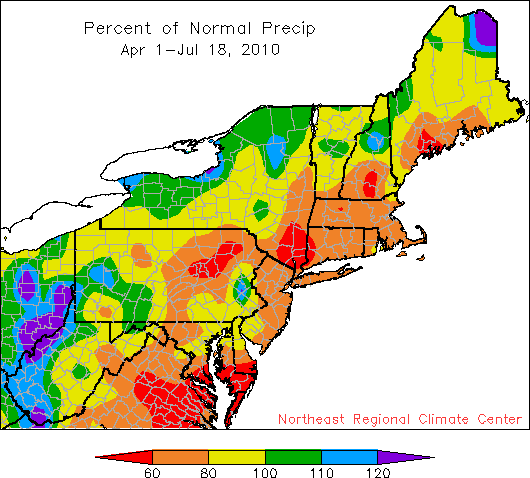
From April 1 through July 18, precipitation has been near to below normal for most of the region.
Much of the Northeast has seen below normal rainfall since April 2010 as well as unusually warm temperatures, especially during July. This has led to drought concerns throughout the region. Drought impacts are many - reduced crop yield, water use restrictions, increased fire risk and others. As the NRCC continues to monitor the situation, we would like to share a few of the web resources we depend on. An interactive map showing the impacts of dry weather conditions on agriculture and the environment can be found at the Drought Impact Reporter. The US Drought Monitor which shows drought conditions throughout the United States, is updated weekly, and allows the user to zoom in from national to state level. Another map, the Standardized Precipitation Index is also interactive and is updated monthly. Lastly, an important resource for stream flow information nationwide is the United States Geological Survey.