September - Wet and Warm
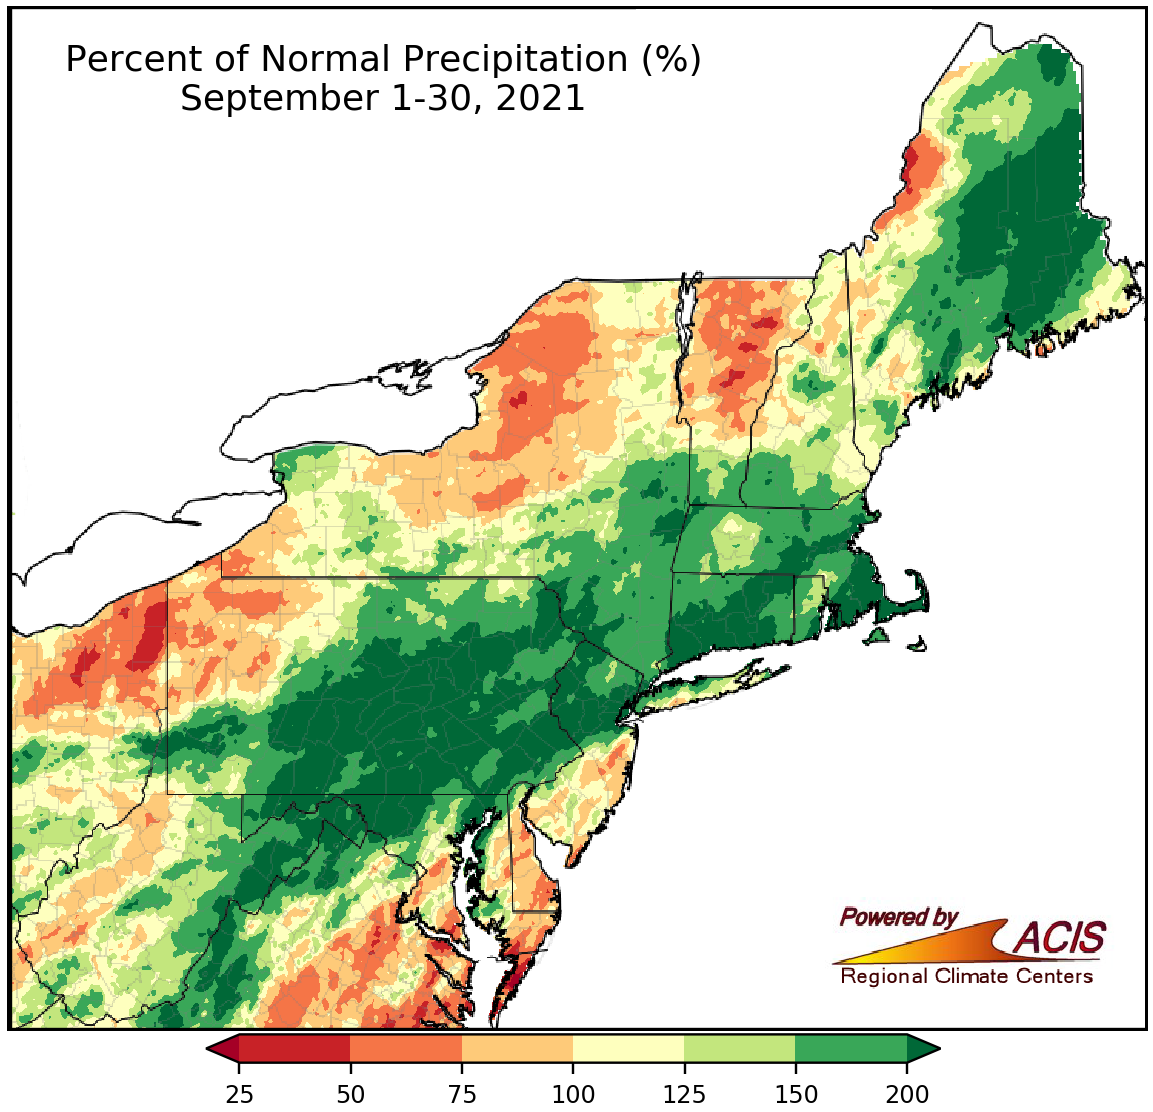
September precipitation ranged from 50% of normal to more than 200% of normal, with many areas on the wet side.
September started with Tropical Depression Ida dropping catastrophic amounts of rain on the Northeast, resulting in record-high water levels and devastating flooding. On the first day of the month, this September already ranked among the 20 wettest for several locations. A few additional storm systems moved through the region during September, adding on to the monthly rain total. When September was over, precipitation ranged from near normal to more than 200% of normal for a large portion of the Northeast, with the wettest areas generally corresponding to where Ida’s heaviest rain fell. Twenty-seven of the region’s 35 major climate sites wrapped up September on the wet side of normal, with rainfall ranging from 103% of normal in Washington, D.C., to 275% of normal in Newark, NJ. This September was the wettest on record for Newark and among the 20 wettest on record for another 17 major climate sites. In fact, this September ranked as the fifth all-time wettest month on record at Harrisburg and Scranton, PA, and as the 10th all-time wettest month on record at Newark.
However, there were some locations that were drier than normal. For instance, portions of southern West Virginia, northwestern Pennsylvania, northern/central New York, and Vermont saw between 50% and 75% of normal September rainfall. In addition, eight major climate sites were drier than normal, with rainfall ranging from 58% of normal in Charleston, WV, to 99% of normal in Rochester, NY. While areas of drought and abnormal dryness persisted in New York and New England, the overall coverage shrank.
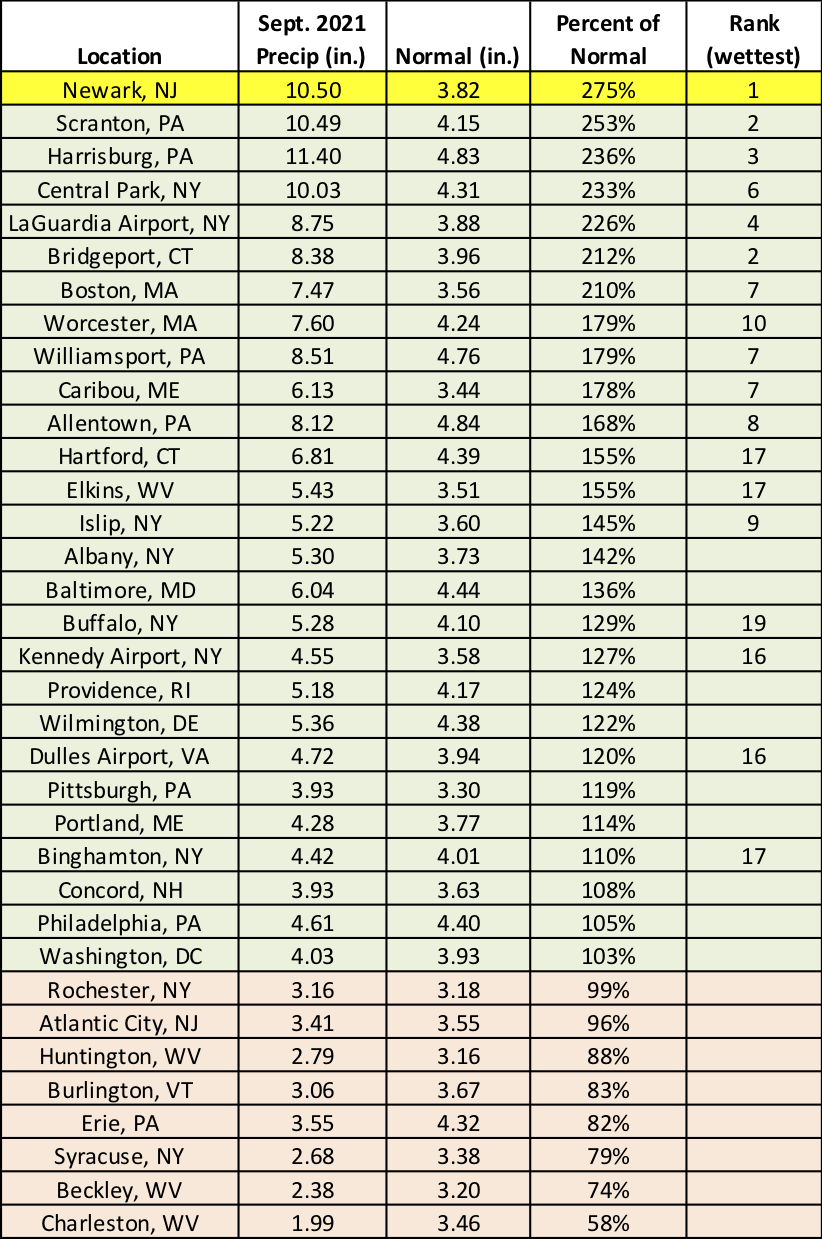
This September was the wettest on record for Newark, NJ, and among the 20 wettest on record for another 17 major climate sites.
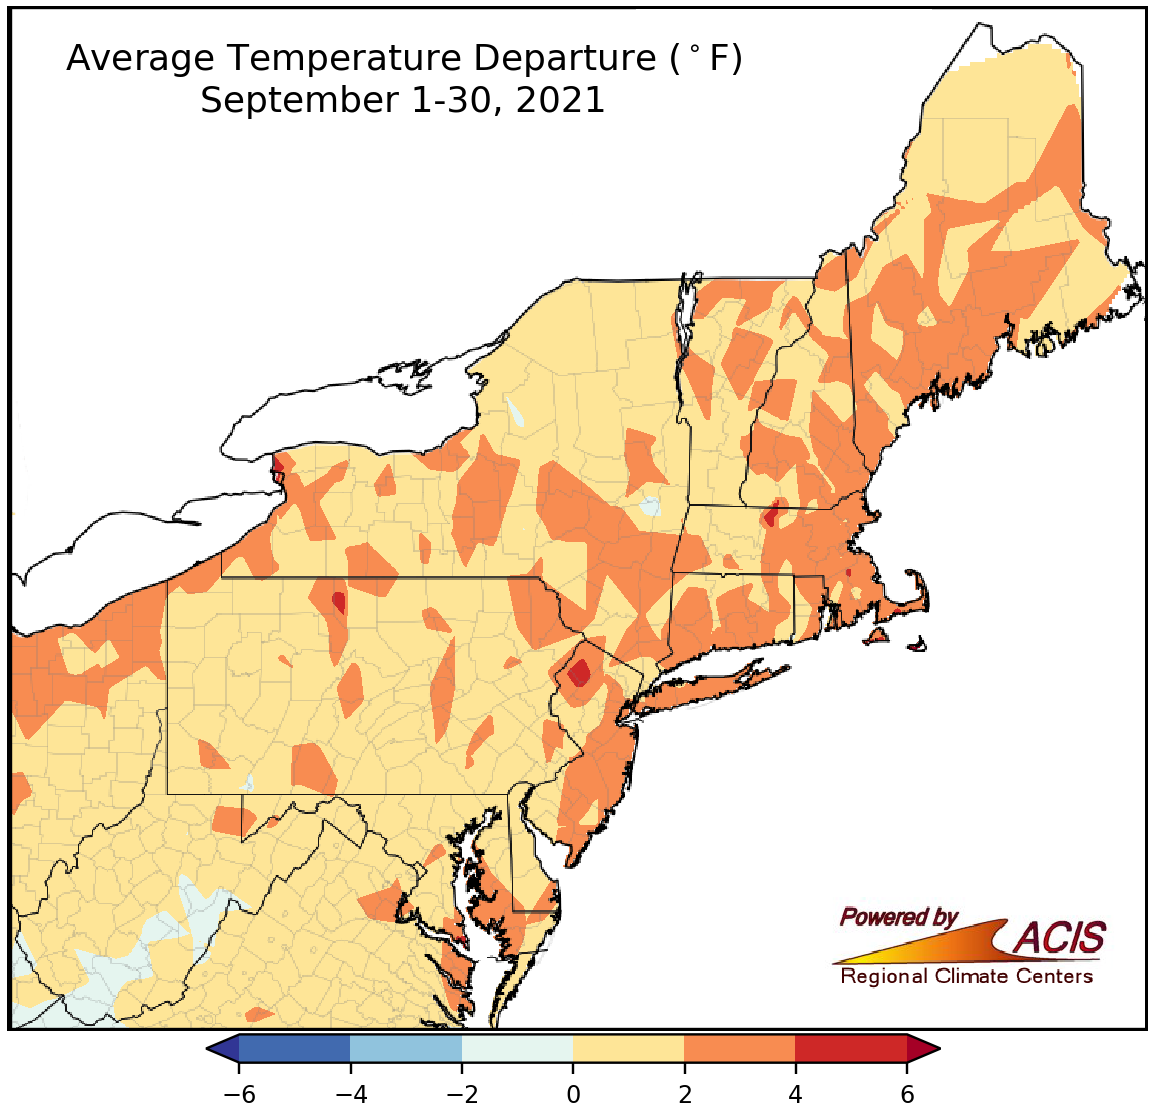
September temperatures ranged from near normal to 4°F above normal for much of the Northeast.
While pockets of West Virginia saw temperatures that were as much as 2°F cooler than normal, the majority of the Northeast was warmer than normal, with average temperatures for September up to 4°F above normal. September average temperatures at the major climate sites ranged from 0.3°F below normal in Beckley, WV, to 4.1°F above normal in Boston, MA. In fact, 33 major climate sites experienced above-normal temperatures with 21 of those ranking this September among their 20 warmest on record.
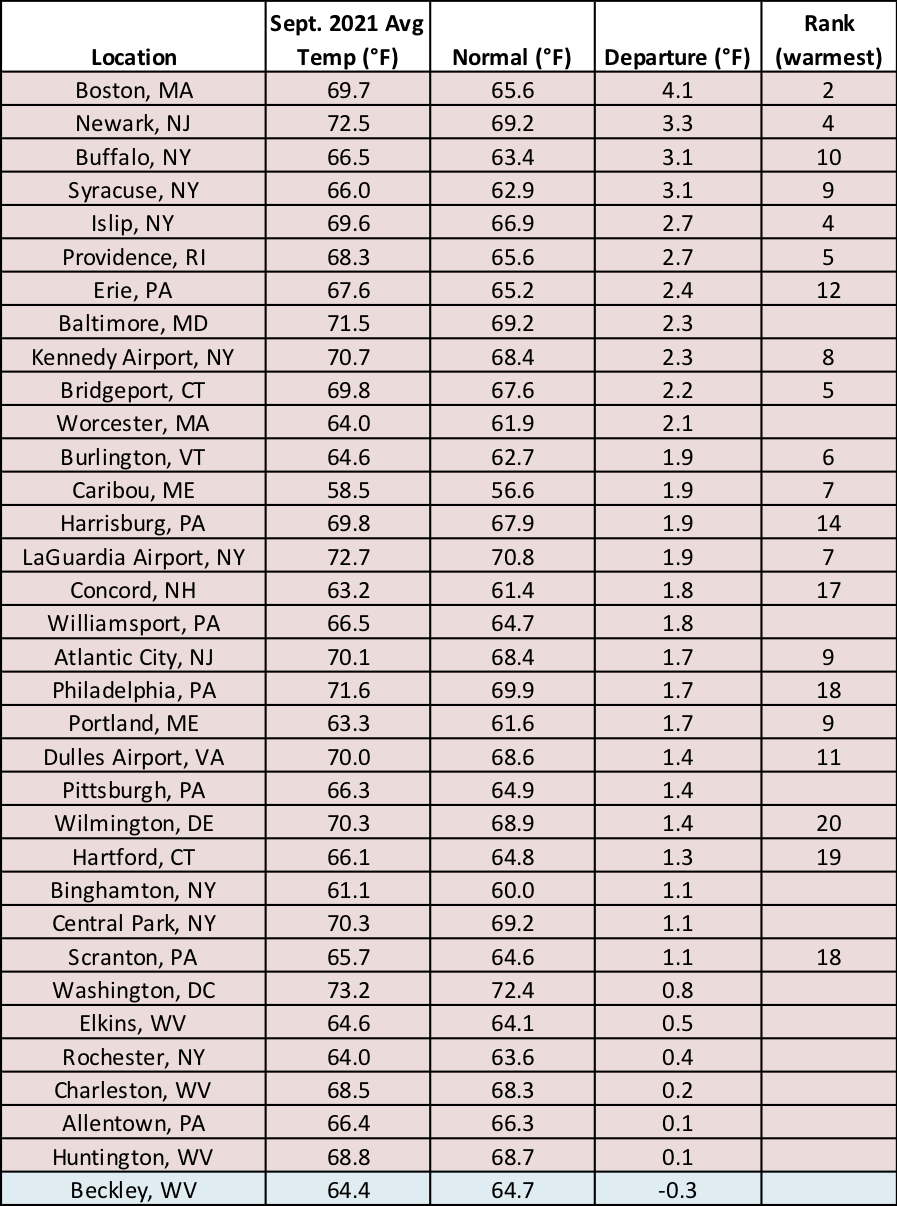
This September ranked among the 20 warmest on record at 21 major climate sites.
NOAA’s Climate Prediction Center favors above-normal temperatures for the entire Northeast for October. There’s a tilt toward below-normal precipitation for most of the Northeast for October, with equal chances of below-, near-, or above-normal precipitation predicted for far southwestern Pennsylvania and much of West Virginia.
The Northeast is expected to be warmer than normal for October.
There’s a tilt toward drier-than-normal conditions in October for much of the Northeast.