Sandy
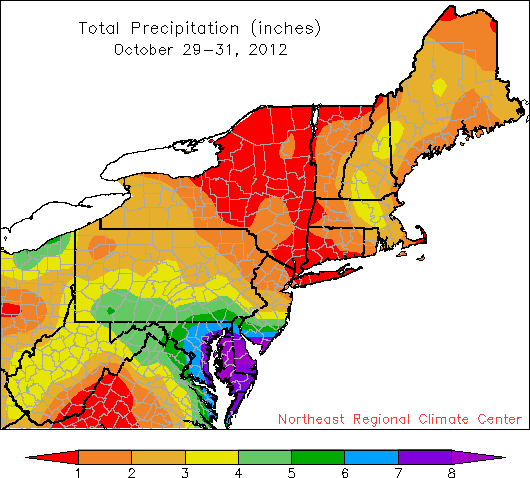
Precipitation from Sandy ranged from less than 1 inch to more than 8 inches.
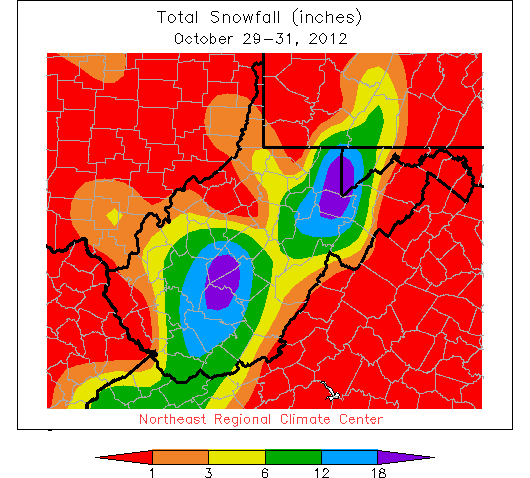
Snowfall totals ranged from less than 1 inch to more than 18 inches.
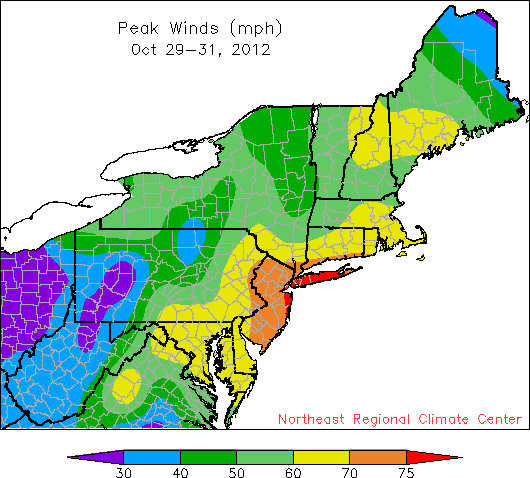
Sandy’s peak winds ranged from less than 30 mph to more than 75 mph.
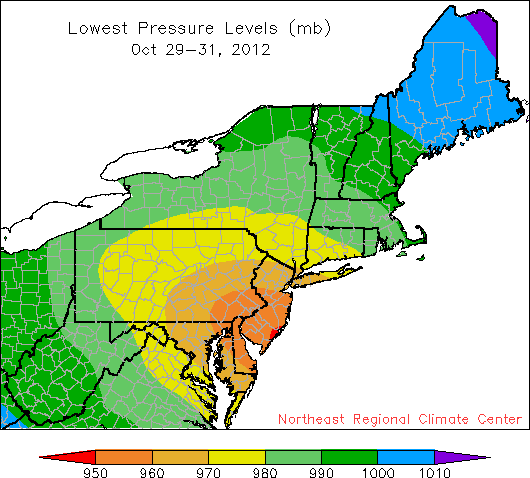
Atmospheric pressure ranged from less than 950 mb to more than 1010 mb.
The entire Northeast has been impacted by Hurricane Sandy in one way or another. While the coastal storm surge and winds were responsible for the majority of impacts, the precipitation and snowfall totals associated with the storm were also impressive. The persistent high winds were responsible for extremely high waves on the Great Lakes, as well. This series of maps shows the peak wind gusts, minimum pressure, total precipitation and total snowfall associated with Sandy.