Fall Leaves (Us)
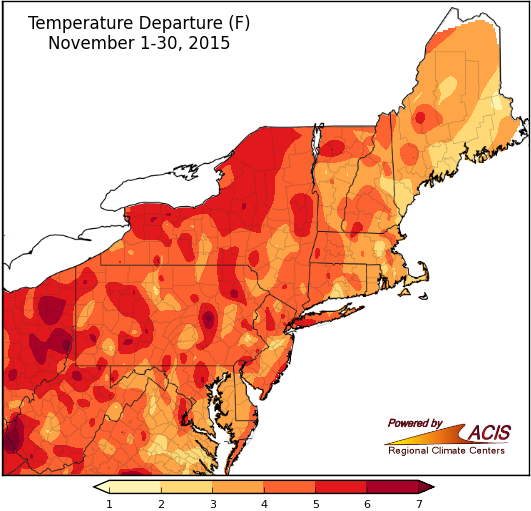
Average temperatures were generally 3°F to 6°F above normal in November.
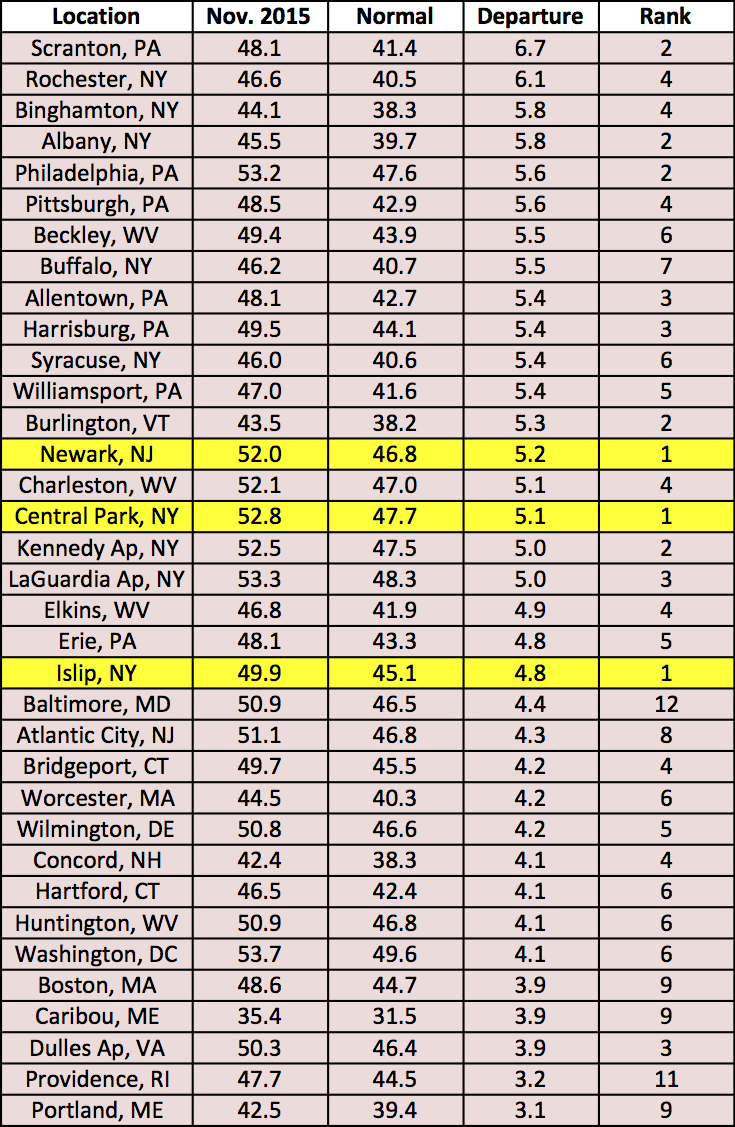
Three airport climate sites were record-warm for the month.
The last month of meteorological fall was warmer than normal, with temperatures ranging from 3°F to 6°F above normal for most of the region. All 35 of the major Northeast airport climate sites ranked this November among their top 12 warmest. In fact, Newark, Central Park, and Islip had their warmest Novembers on record. Both September and November were quite warm, so the fall season also averaged out to be warmer than normal. Temperatures ranged from 2°F to 4°F above normal for a majority of the region, with some spots running even warmer. Five of the airport climate sites were record-warm for the season: Newark, Central Park, Islip, LaGuardia Airport, and Kennedy Airport.
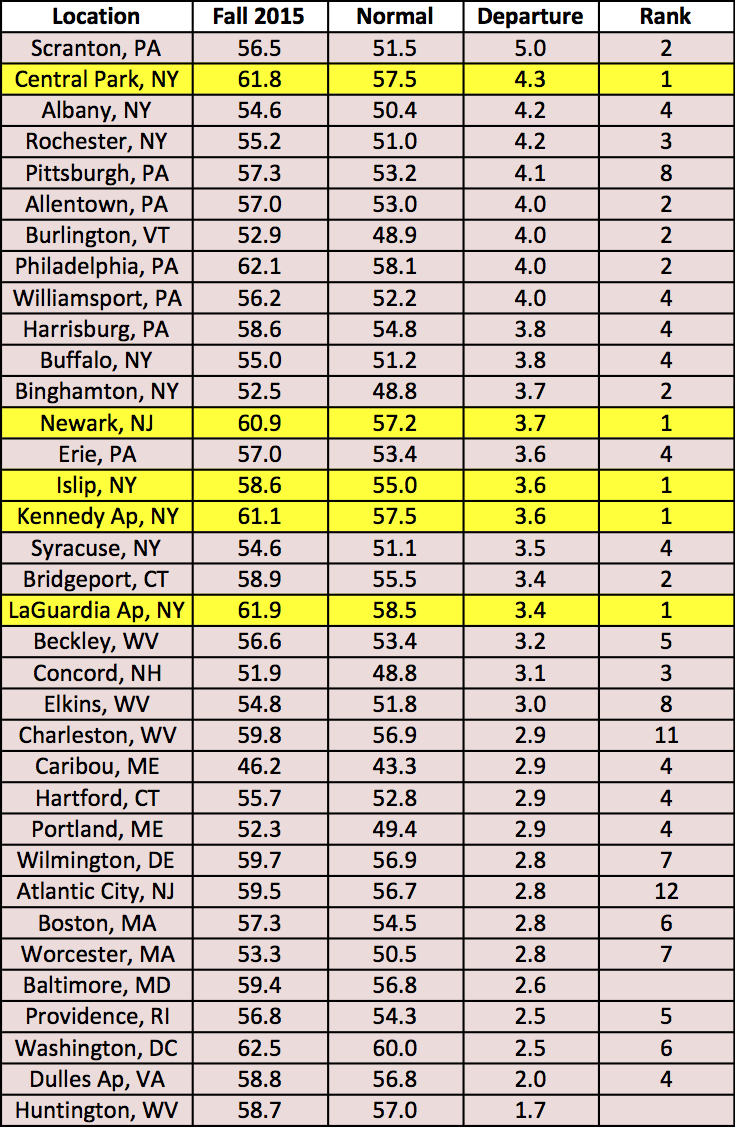
All 35 airport climate sites were warmer than normal during fall, with 33 of them ranking it among their top 12 warmest.
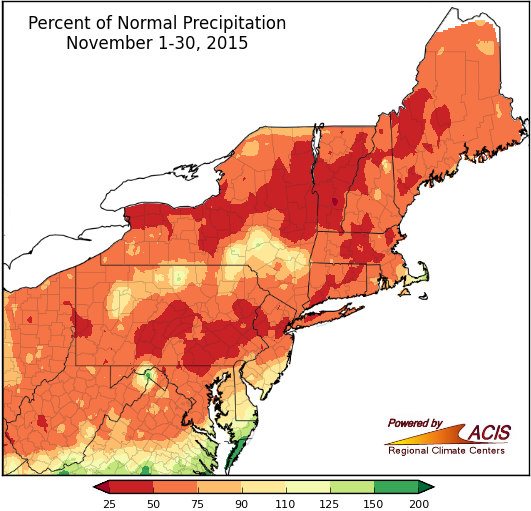
A large portion of the region saw 25% to 75% of normal precipitation in November.
For most areas, November ended on the dry side of normal, generally from 25% to 75% of normal. Thirty-four of the airport climate sites saw below-normal precipitation, with 16 of those ranking the month among their top 20 driest Novembers. Precipitation was more variable in September and October, so precipitation for the fall season ended up being near to below normal for most areas, generally from 50% to 110% of normal. Thirty-one of the airport climate sites saw near to below-normal precipitation.
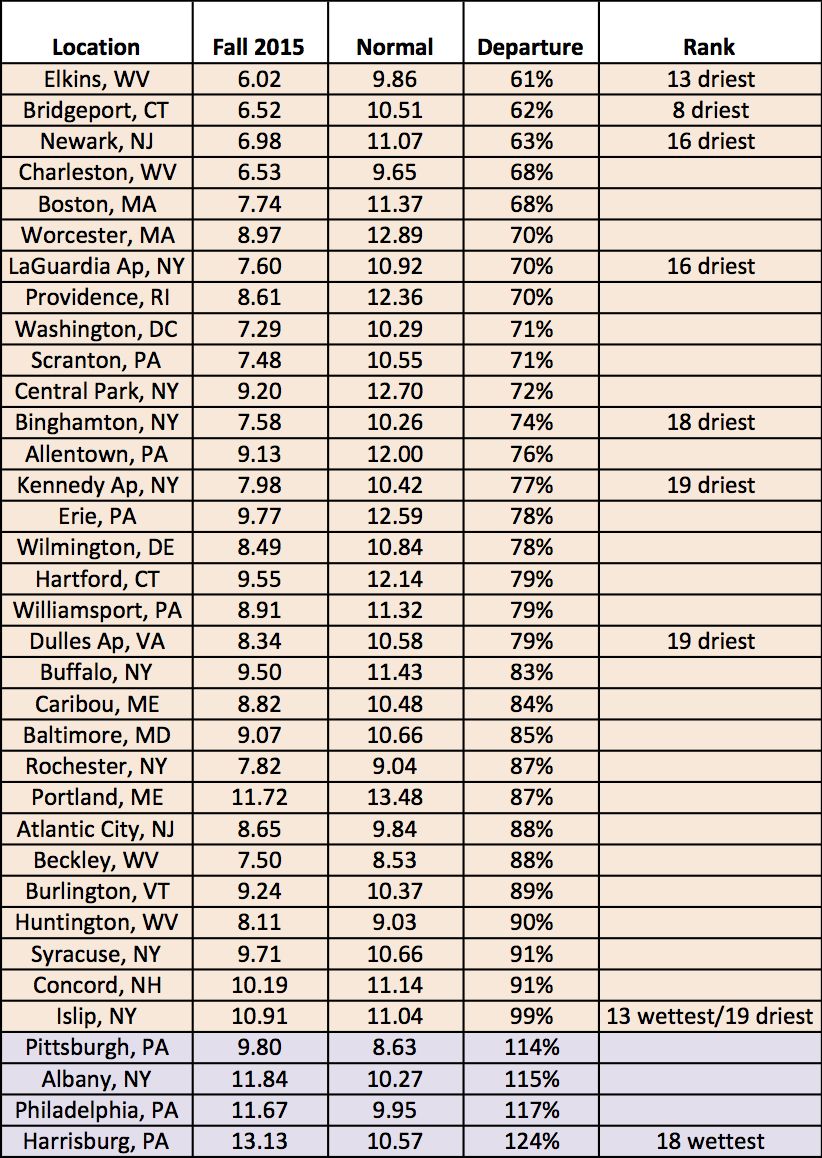
A few sites ranked the season among their top 20 driest, while two sites ranked it among their top 20 wettest.
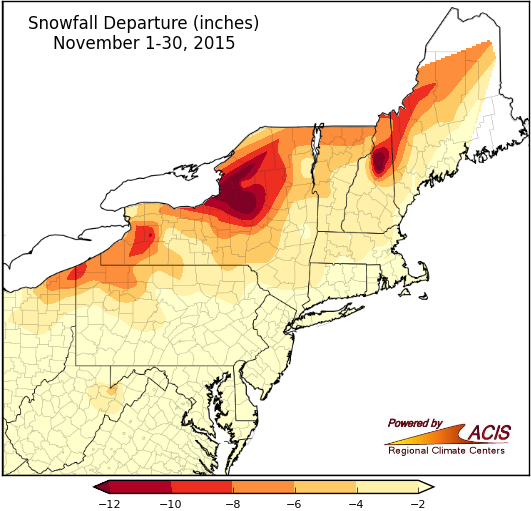
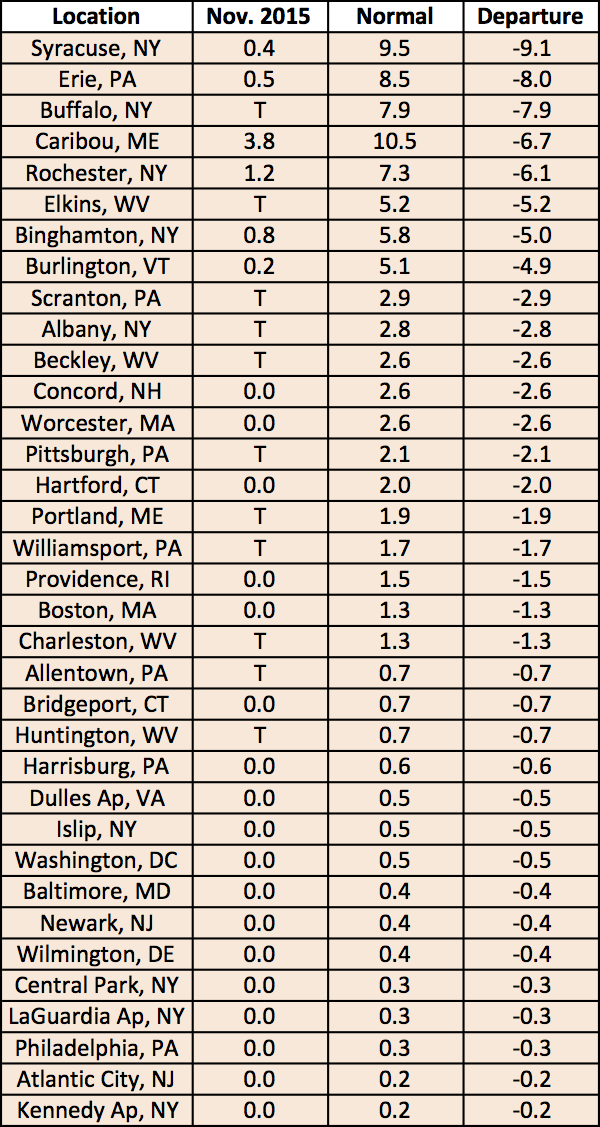
Snowfall was lacking during November, with some lake-effect prone areas and higher elevations more than 6 inches below normal.
Most of the region normally sees measurable snow (0.1 inches) in November, but that wasn’t the case this year. Of the 35 climate sites, only six saw measurable snow during the month. Departures ranged from less than 0.5 inches below normal in cities like Philadelphia, New York, and Baltimore to more than 6 inches below normal in lake-effect areas such as Syracuse, Erie, and Buffalo.
Warm temperatures helped make for a not-so-snowy November.