March Blues
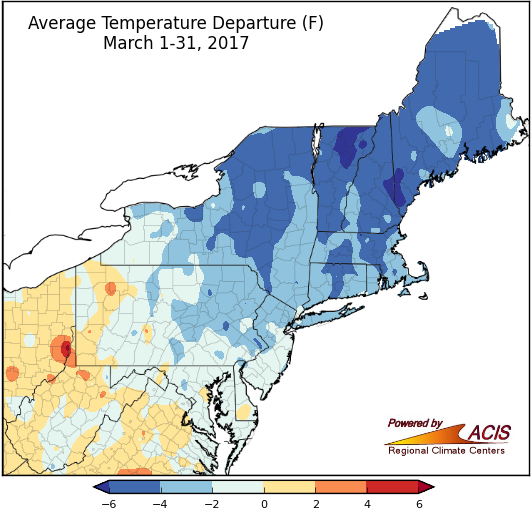
Most of the Northeast was colder than normal, denoted by shades of blue, in March.
After the mild temperatures of January and February, March generally took a turn for the colder. On the map above, shades of blue show average temperatures ranged from 6°F below normal to near normal for a majority of the Northeast. The main exceptions were portions of northern New England, where temperatures were more than 6°F below normal, and portions of West Virginia and western Pennsylvania, where temperatures were up to 2°F above normal. Twenty-six of the region’s 35 major climate sites had a colder-than-normal March (highlighted in blue below), with seven ranking this March among their top 20 coldest on record.
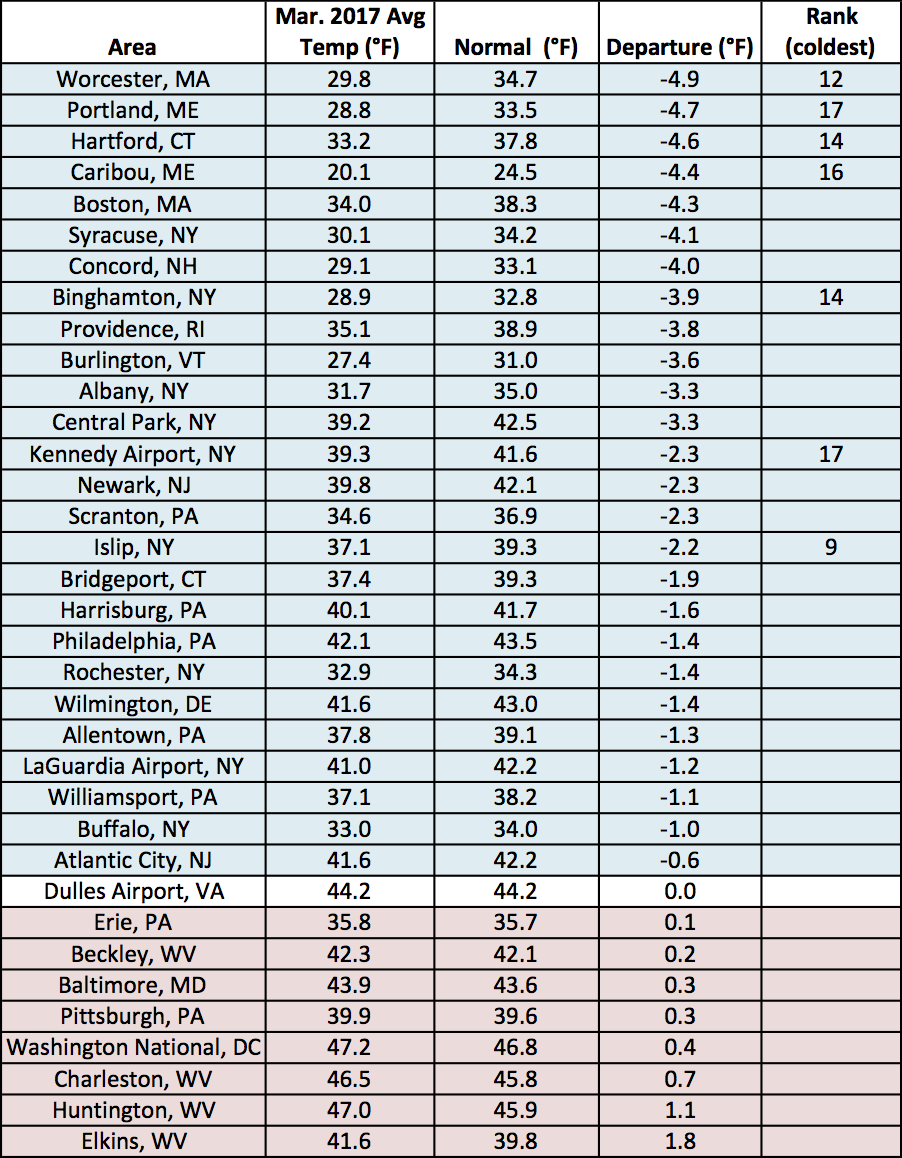
March average temperatures at the major climate sites ranged from 4.9°F below normal in Worcester, MA to 1.8°F above normal in Elkins, WV.
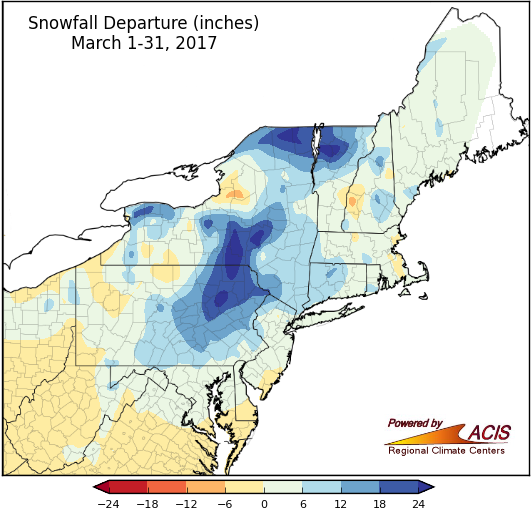
Much of the Northeast saw above-normal snowfall, denoted by shades of blue, in March.
Snowfall ranged from 6 inches below normal to more than 24 inches above normal, with most of the region wrapping up March on the snowy side of normal, as indicated by the shades of blue on the map above. The largest surpluses the were found in areas that received heavy snowfall during the mid-March nor’easter, such as northeastern Pennsylvania, central and northern New York, and northern Vermont. Of the 29 snowier-than-normal major climate sites (highlighted in blue below), 20 ranked this March among their top 20 snowiest on record. Two West Virginia sites, Huntington and Charleston, did not receive measurable snowfall this March, ranking it among their top 20 least snowy.
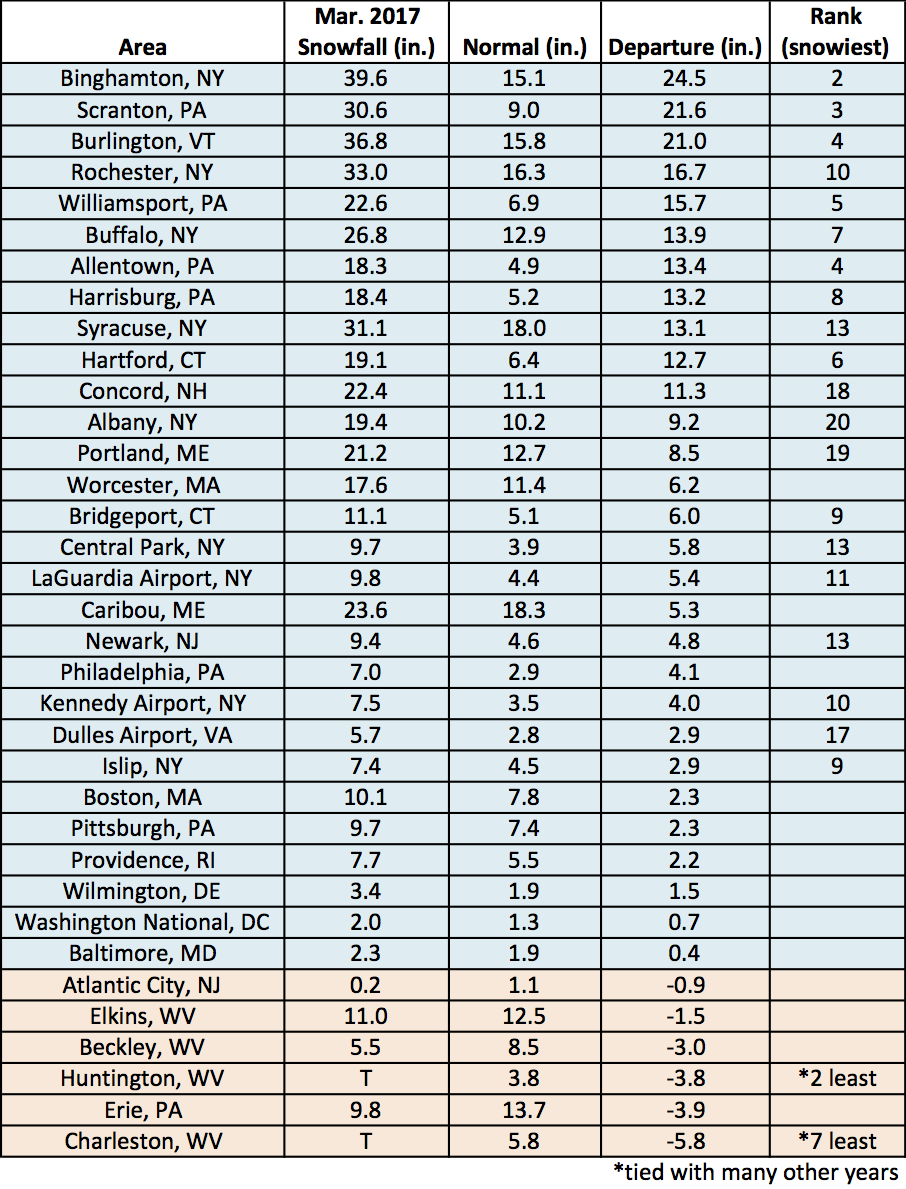
March snowfall at the major climate sites ranged from 5.8 inches below normal in Charleston, WV to 24.5 inches above normal in Binghamton, NY.
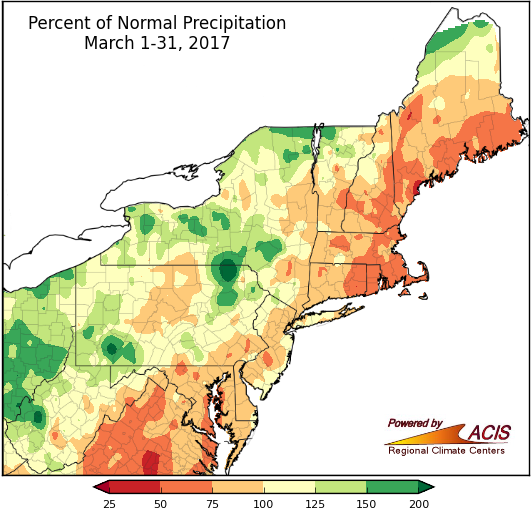
New England and southern Maryland tended to be the driest areas in March, while portions of New York, western Pennsylvania, and western West Virginia tended to be the wettest.
Precipitation varied during March, ranging from 50% of normal to more than 150% of normal. Twenty-nine of the 35 major climate sites were wetter than normal, with 12 ranking this March among their top 20 wettest. The region has seen lingering, but improving drought conditions.
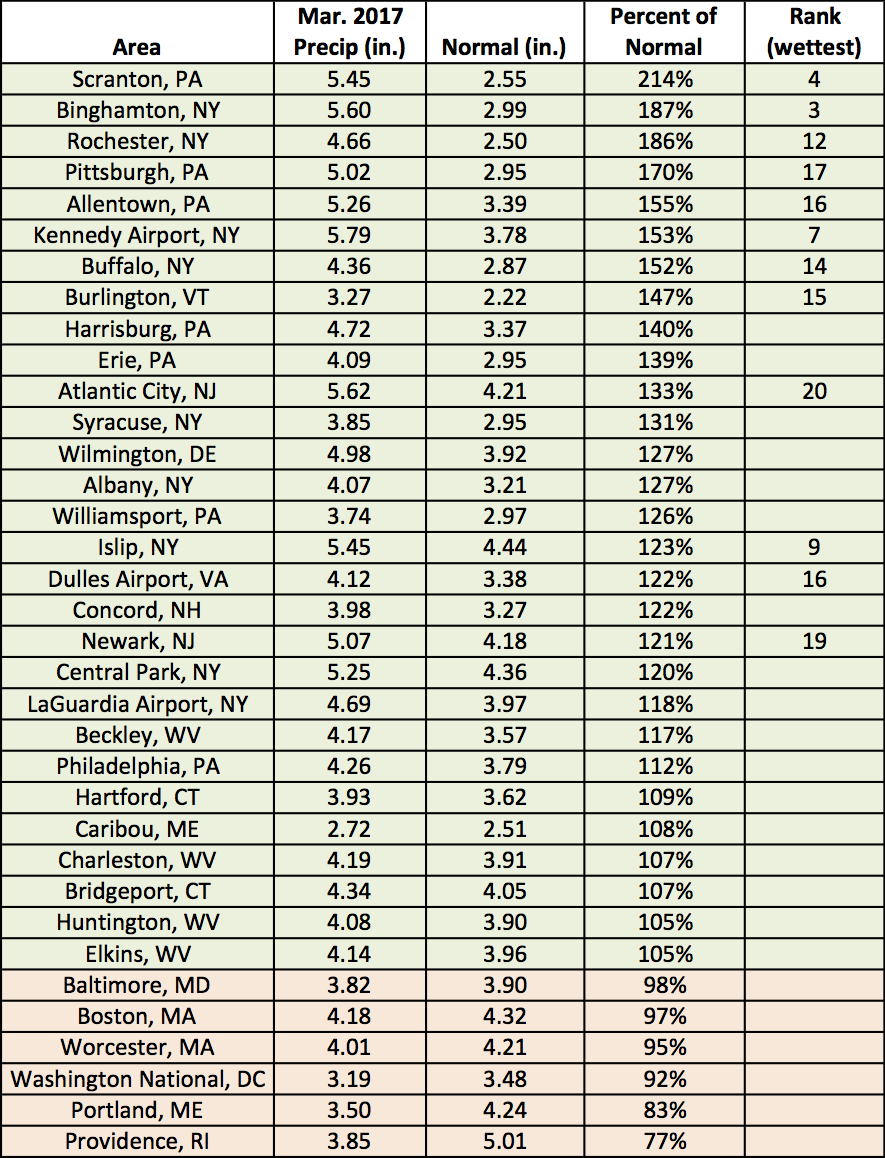
March precipitation at the major climate sites ranged from 77% of normal in Providence, RI to 214% of normal in Scranton, PA.
The shades of blue that were so prominent on March’s temperature map may not appear on April’s map. According to NOAA’s Climate Prediction Center, there’s an increased chance of above-normal temperatures for the Northeast during April. The precipitation outlook indicates equal chances of below-, near-, or above-normal precipitation for April.
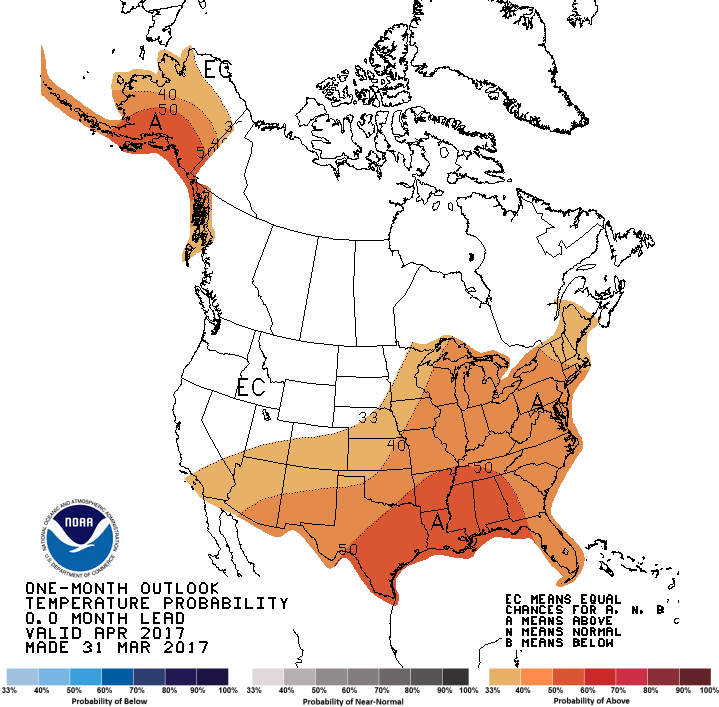
The Climate Prediction Center’s April temperature outlook.
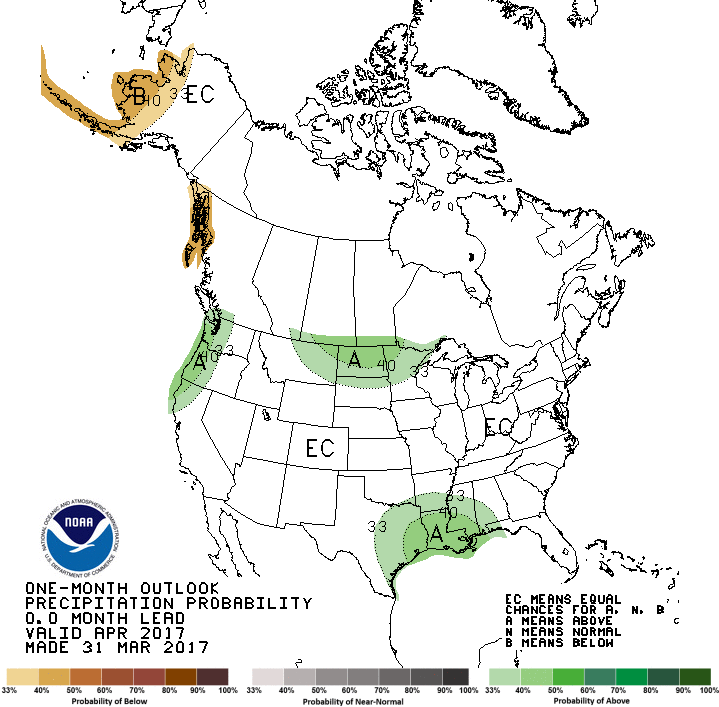
The Climate Prediction Center’s April precipitation outlook.