What Pies Tell Us About Seasonal Outlooks
NOAA’s Climate Prediction Center (CPC) releases several temperature and precipitation outlooks on a daily and monthly basis. These maps feature three categories: above normal, near normal, and below normal. Let’s think of them as a pie split into three equal-sized pieces: one for each category. Our chances for each of the categories would be 33.3% (the whole pie, or 100%, divided by the 3 pieces). This is called equal chances, which is marked EC on the map below.
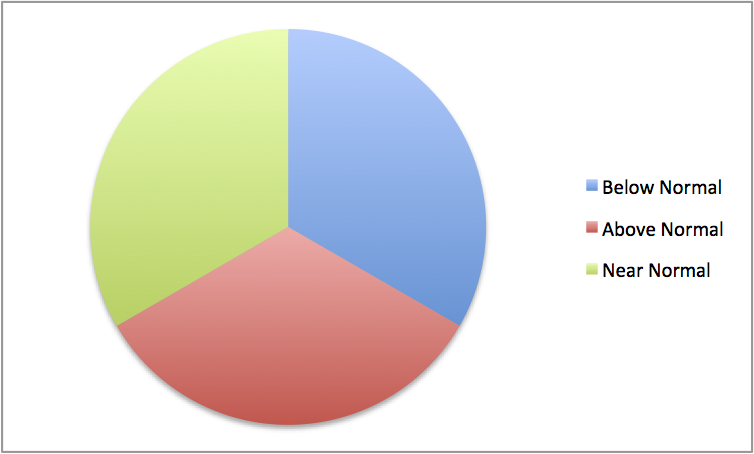
When equal chances are forecast, there’s a 33.3% chance each of above normal, near normal, and below normal.
CPC’s winter temperature outlook calls for an increased chance of above-normal temperatures for much of the Northeast.
The areas marked by a 33 on the map above have a 33.3 to 40% chance of seeing above-normal temperatures. If you increase the size of the above-normal piece of the pie, the size of the below-normal piece decreases. The chance of below-normal temperatures is now smaller, less than 33.3%, but near normal stays the same (at 33.3%). As you increase the chance of above-normal temperatures to 40 to 50% (marked by a 40 on the map), the chances of below-normal temperatures decrease even more. As we continue to increase the size of the above-normal piece, the size of the below-normal piece continues to decrease (no category will drop below a 3.3% chance) until eventually the size of the near-normal piece also starts to decrease.
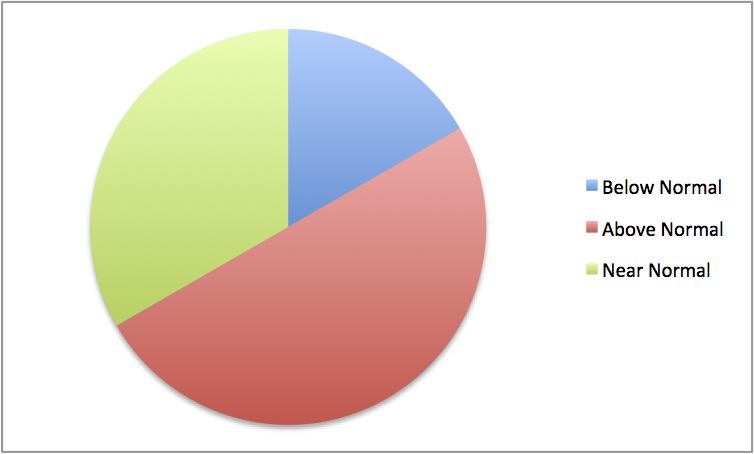
As the size of one piece of pie increases, the size of the opposite piece of pie decreases.
Here are a few more notes about the winter temperature outlook. Just because the forecast calls for an increased chance of above-normal temperatures doesn’t mean we won’t get a string of cold days or even a cold month. It just means that the season as a whole is expected to be warmer than normal. Ultimately, winter is defined as “the coldest season of the year”, so bundle up and enjoy!
CPC’s winter precipitation outlook shows an increased chance of above-normal precipitation for coastal areas, with equal chances forecast elsewhere in the region.
The above information also applies to the precipitation outlook, which shows that odds favor a wetter-than-normal winter in coastal areas from the Mid-Atlantic to southern New England. It’s important to note that the precipitation forecast is not a snow forecast. A storm’s track and strength play a large part in determining the areas that get snow and how much they get, so snow totals are pretty difficult to pin down more than a few days in advance.
Next Thursday (November 19), the CPC will release another round of their monthly and seasonal outlooks. Hopefully after reading this post, you’ll be able to decipher them a little better!