A Record Hot June
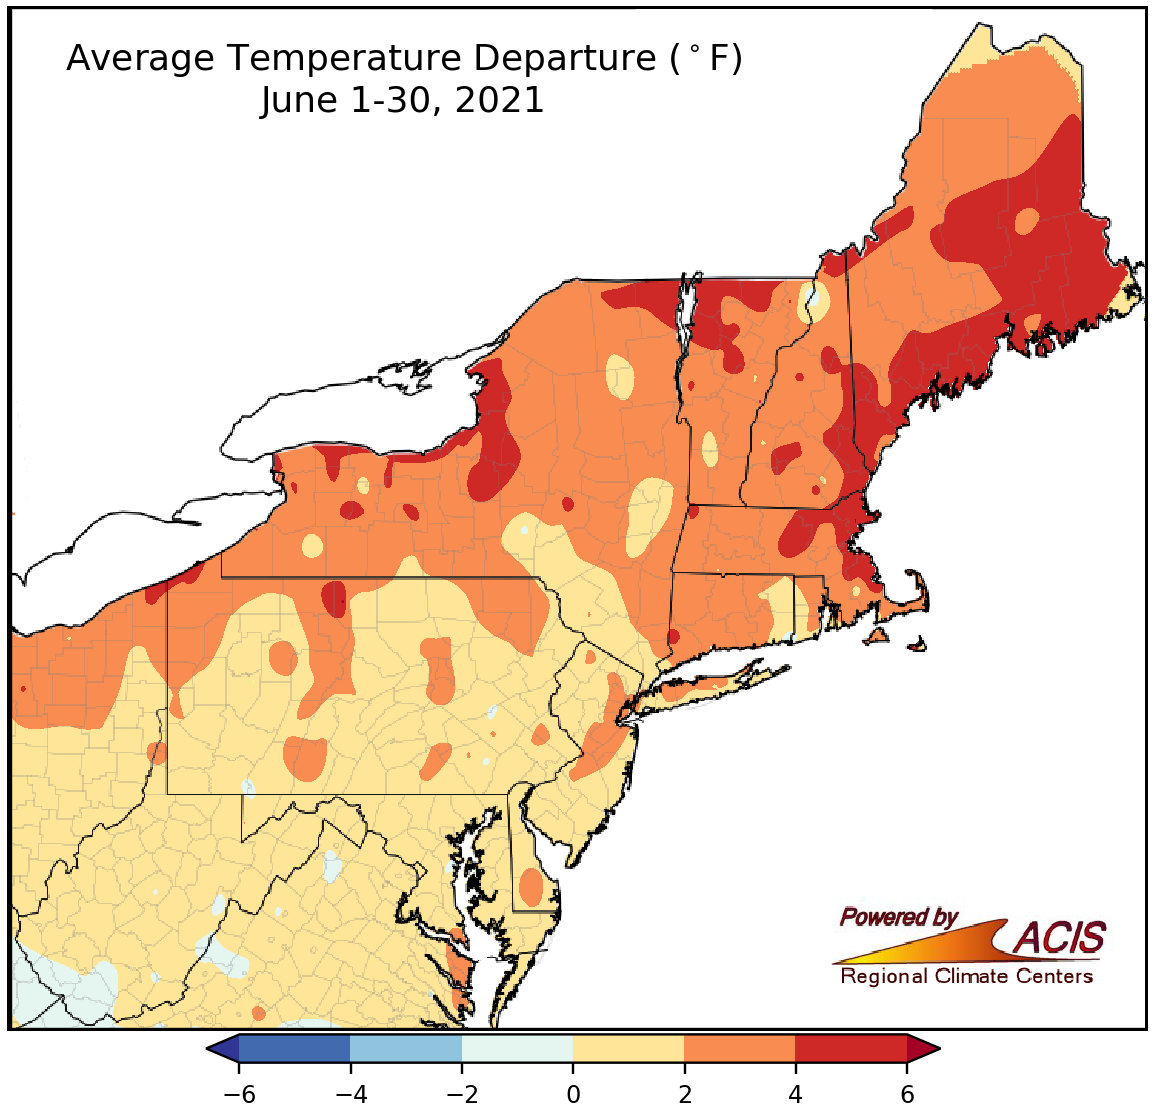
June average temperatures ranged from 2°F below normal to 6°F above normal.
A majority of the Northeast wrapped up June on the warm side of normal, with the greatest departures above normal of 4°F to 6°F in New England, New York, and northern Pennsylvania. However, southern West Virginia was as much as 2°F cooler than normal. Temperatures at the major climate sites ranged from 0.3°F above normal in Washington, D.C., and Huntington, WV, to 6.4°F above normal in Boston, MA. In fact, Boston, as well as Portland and Caribou, ME, experienced their hottest June on record. Another 26 of the sites had one of their 20 hottest Junes on record.
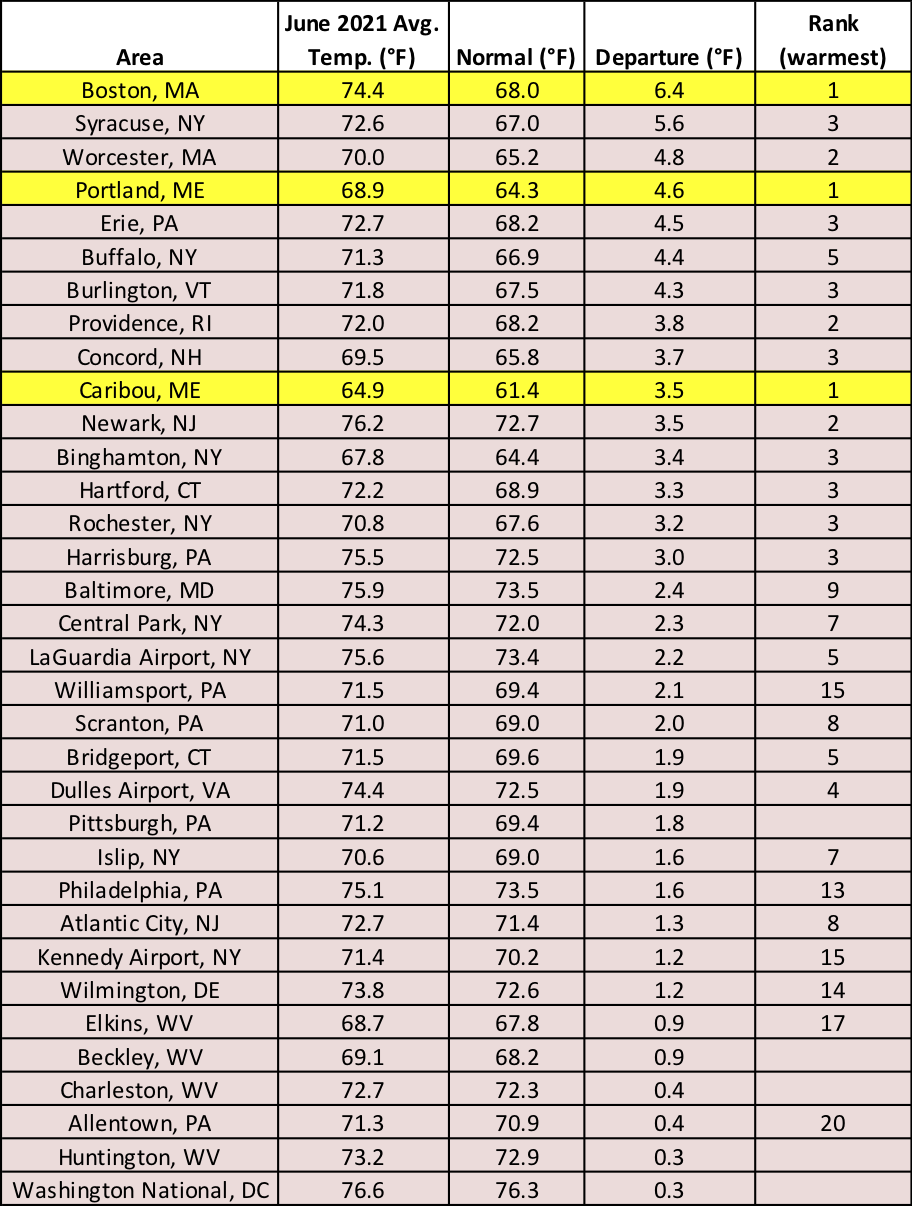
This June was the hottest on record for three major climate sites and among the 20 hottest for another 26 of the sites.
The period from June 5 to 9 was particularly warm, setting numerous daily maximum and high minimum temperature records. However, the period from June 26 to 30 was even hotter. Newark, NJ, and Boston, MA, recorded their all-time hottest June temperatures on record with highs of 103°F and 100°F, respectively, on June 30. Portland, ME, recorded three consecutive days with a high of at least 95°F for the first time on record in June, also tying the site’s all-time streak. Low temperatures were also unusually warm, with seven major climate sites setting/tying their warmest minimum temperatures on record for June. At month’s end, Newark and Boston, as well as Concord, NH, and Burlington, VT, set/tied their records for greatest number of June days with a high of at least 95°F. Concord also saw its greatest number of June days with a high of at least 90°F, recording nine such days this June.
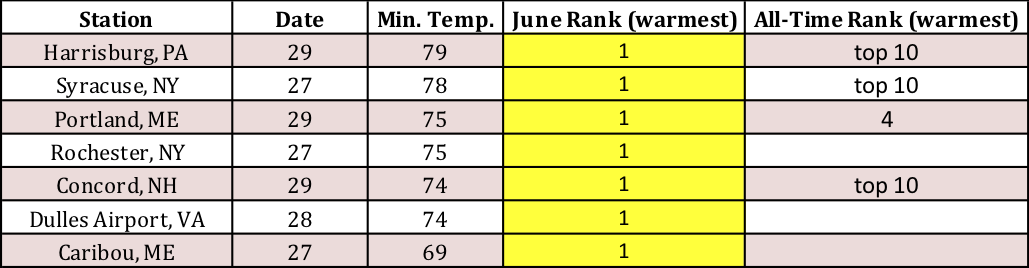
Seven major climate sites recorded their warmest minimum temperatures on record for June.
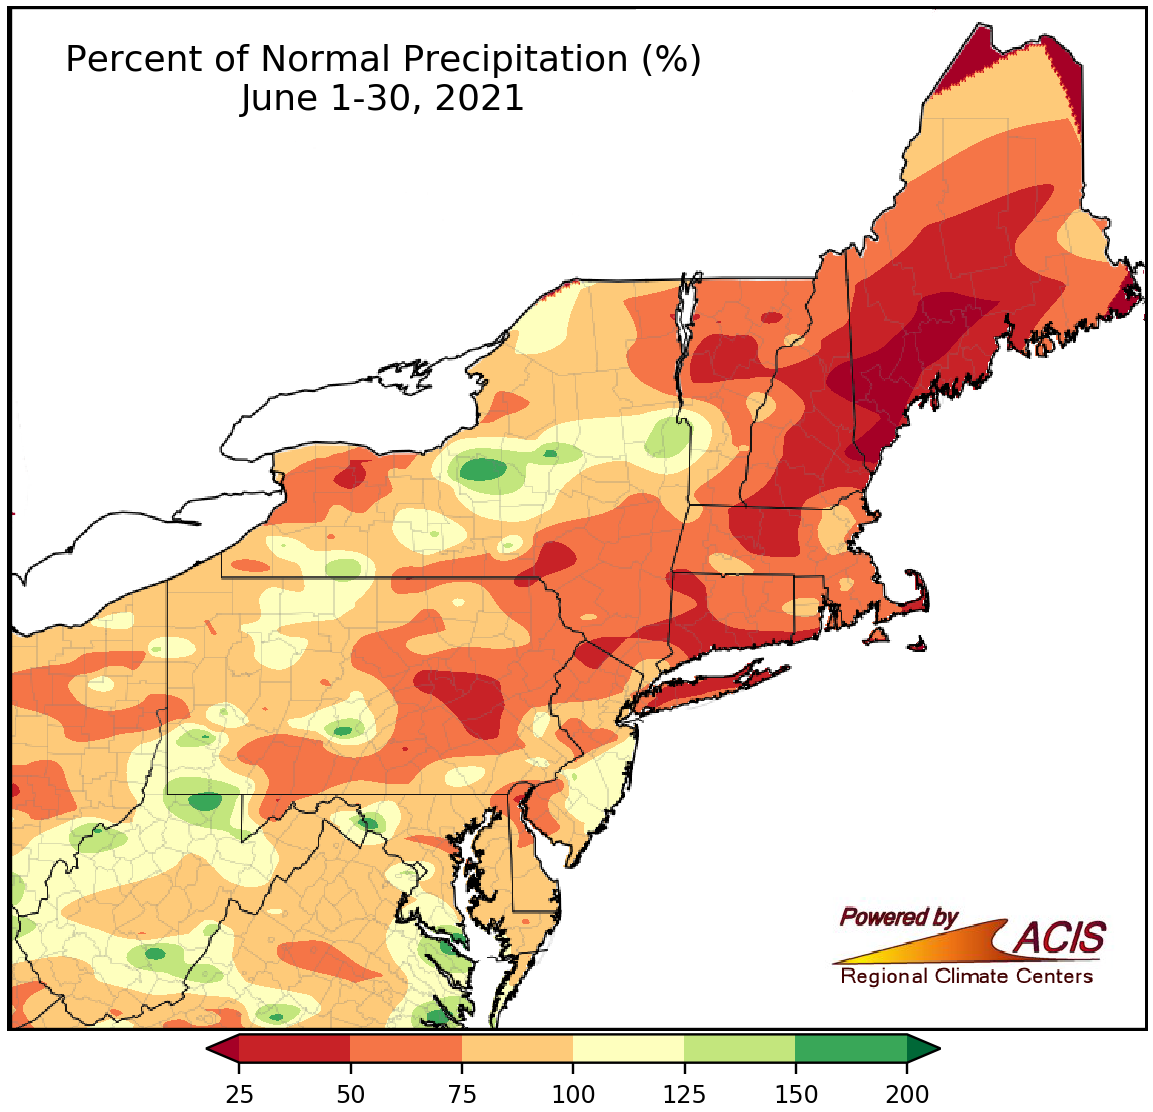
June precipitation ranged from less than 25% of normal to 200% of normal.
June was a drier-than-normal month for much of the Northeast, with the driest areas in Maine and New Hampshire seeing less than 25% of normal precipitation. However, a few locations such as northern West Virginia and central New York were wetter, seeing as much as 200% of normal precipitation. Precipitation at the major climate sites ranged from 23% of normal in Portland, ME, to 181% of normal in Syracuse, NY. Overall, 28 of the sites were drier than normal, with six ranking this June among their 20 driest Junes on record. Conversely, two sites had one of their 20 wettest Junes.
Factors such as below-normal precipitation, above-normal temperatures, low streamflow and groundwater levels, and declining soil moisture led to worsening drought conditions in New England and New York during June. Severe drought was introduced and moderate drought and abnormal dryness expanded, with impacts such as water restrictions, dry wells, increased fire risk, and stressed crops noted. For the most up-to-date conditions, please visit the Northeast DEWS Dashboard or the Northeast Regional Climate Center’s weekly drought update.
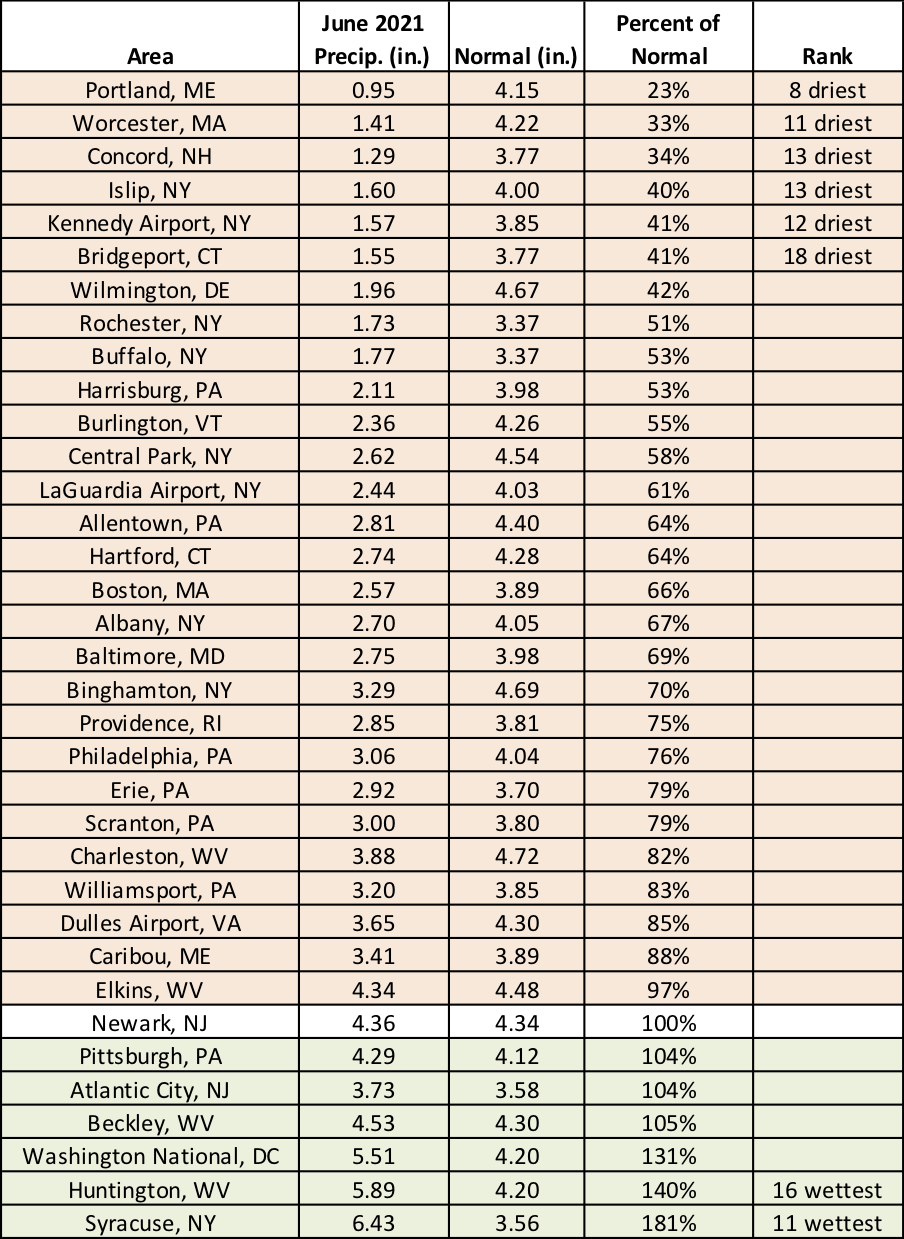
This June ranked among the 20 driest on record for six major climate sites but among the 20 wettest on record for two major climate sites.
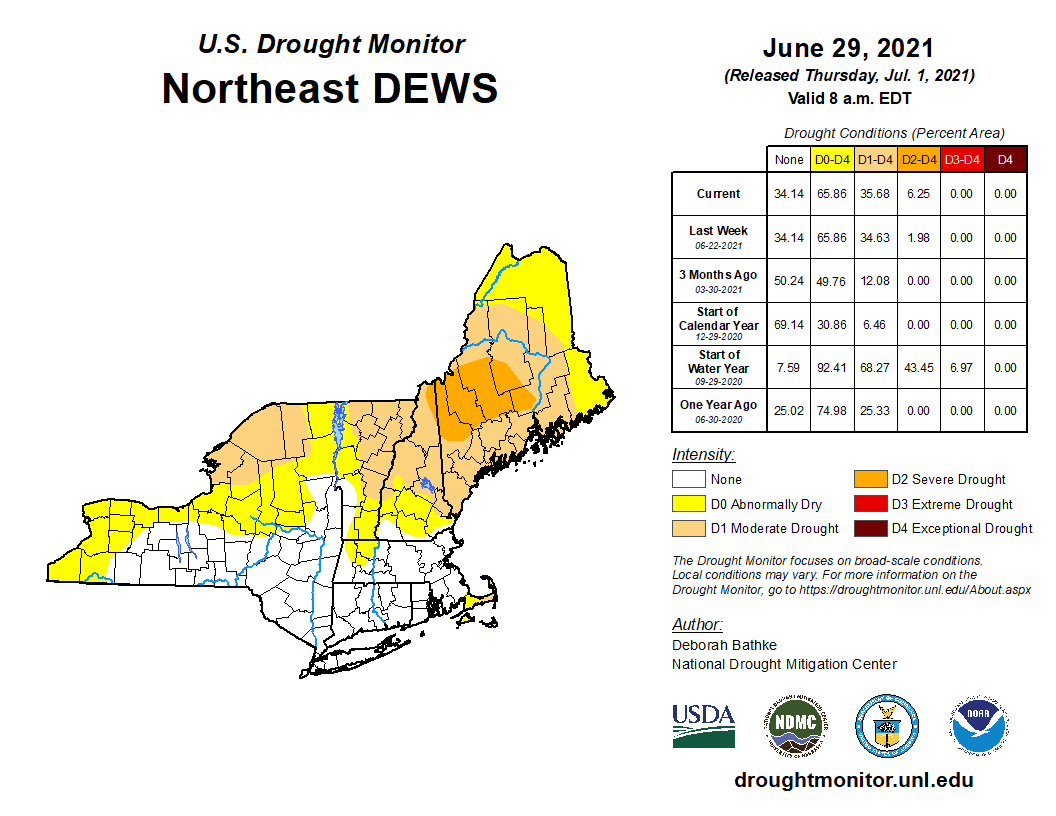
Drought and abnormal dryness expanded in New York and New England during June.
During the month, there were also many days with flash flooding or severe weather, including five tornadoes. Some of those events include flooding from as much as 7 inches of rain in southeastern Pennsylvania on June 8, flooding damaging 25 homes and trapping 50 people in southwestern West Virginia on June 10, and widespread wind damage on June 21 and June 30.
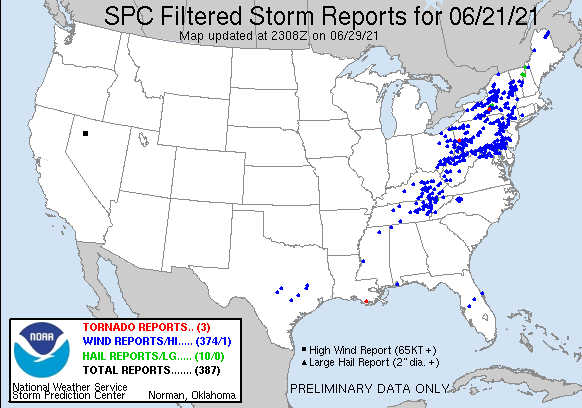
Tornado, wind, and hail reports from June 21.
July is expected to be warmer than normal for the Northeast.
After a hot, dry June, what does July have in store? Perhaps more of the same for some areas! NOAA’s Climate Prediction Center indicates July is expected to be another warmer-than-normal month for the entire Northeast, with the greatest likelihood of above-normal temperatures in portions of New England. As for precipitation, there’s a tilt toward below-normal precipitation for portions of northern New England but a tilt toward above-normal precipitation for southern parts of the region. Equal chances of below-, near-, or above-normal precipitation were predicted for the areas in between.
Northern New England could be drier than normal this July while southern areas could be wetter than normal.