A Soggy Start to May
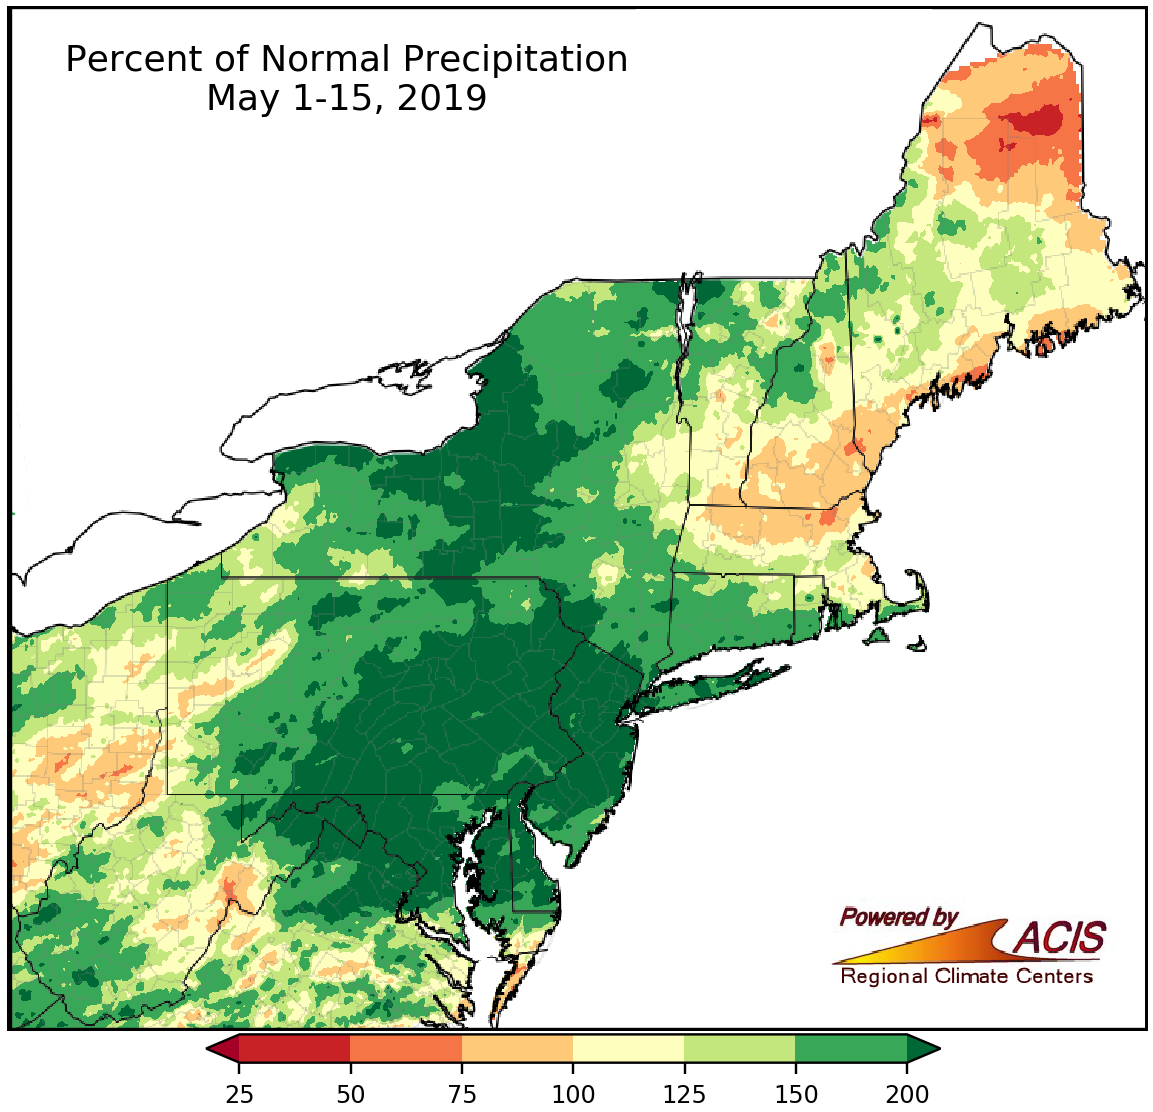
May 1-15 precipitation ranged from normal to more than 200% of normal for most areas.
The persistent storminess from April continued into May. Islip and Kennedy Airport, NY, and Hartford, CT, set/tied their longest streak of days with measurable precipitation (0.01 in.). For instance, Islip had 18 consecutive days with measurable precipitation from April 20 to May 7.
During the first half of May, a large chunk of the Northeast saw 100% to more than 200% of normal precipitation. The greatest surpluses were generally found in an area from eastern West Virginia, Maryland, and Delaware through Pennsylvania and New Jersey and into New York. In fact, Allentown, PA, had a record wet start to the month, receiving more rain during the first half of May than they normally see during all of May and the first half of June! Another 22 major climate sites also ranked this May 1-15 period among their 20 wettest on record. There were a few dry areas, however, mainly in New England. Northern Maine was the driest spot, seeing less than 75% of normal precipitation.
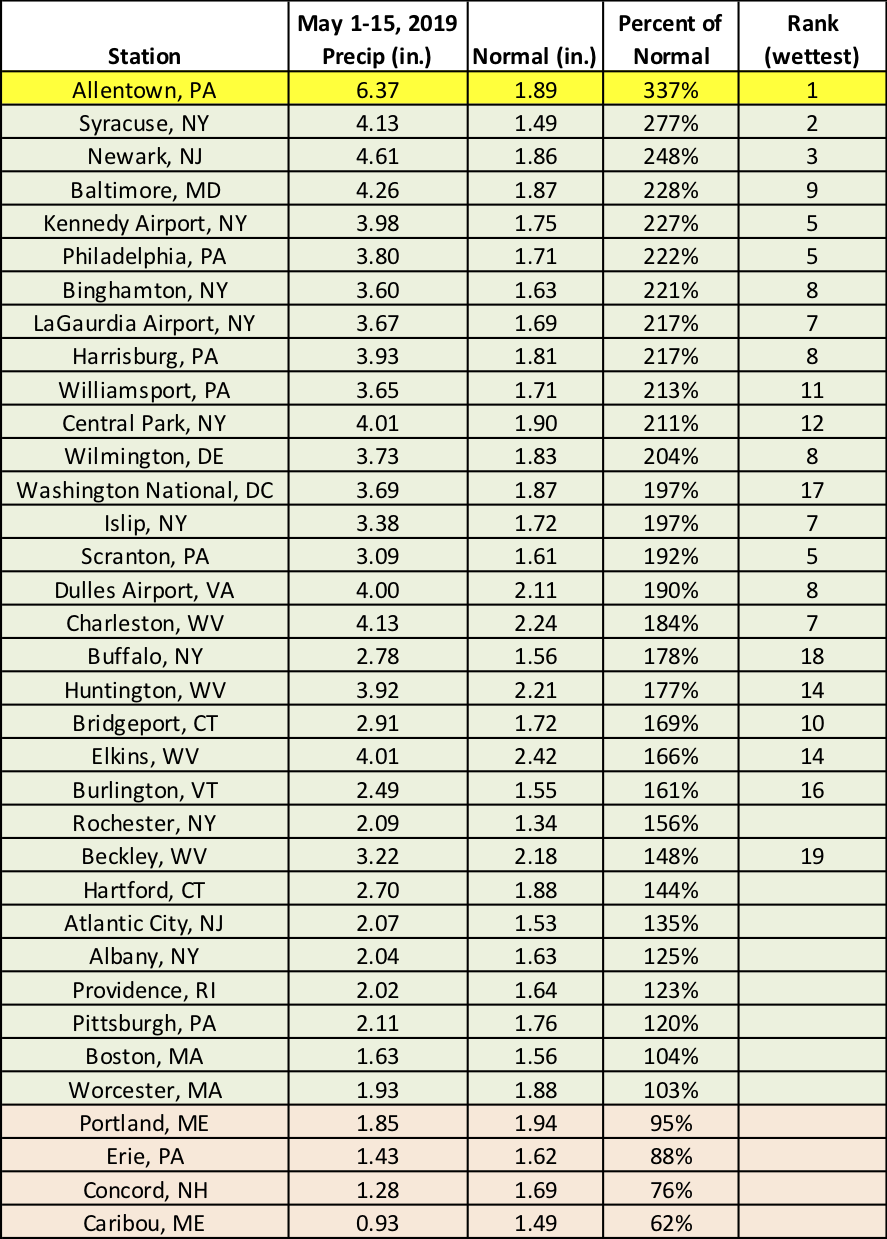
The May 1-15 period ranked among the 20 wettest on record for 23 major climate sites, with Allentown being record wet.
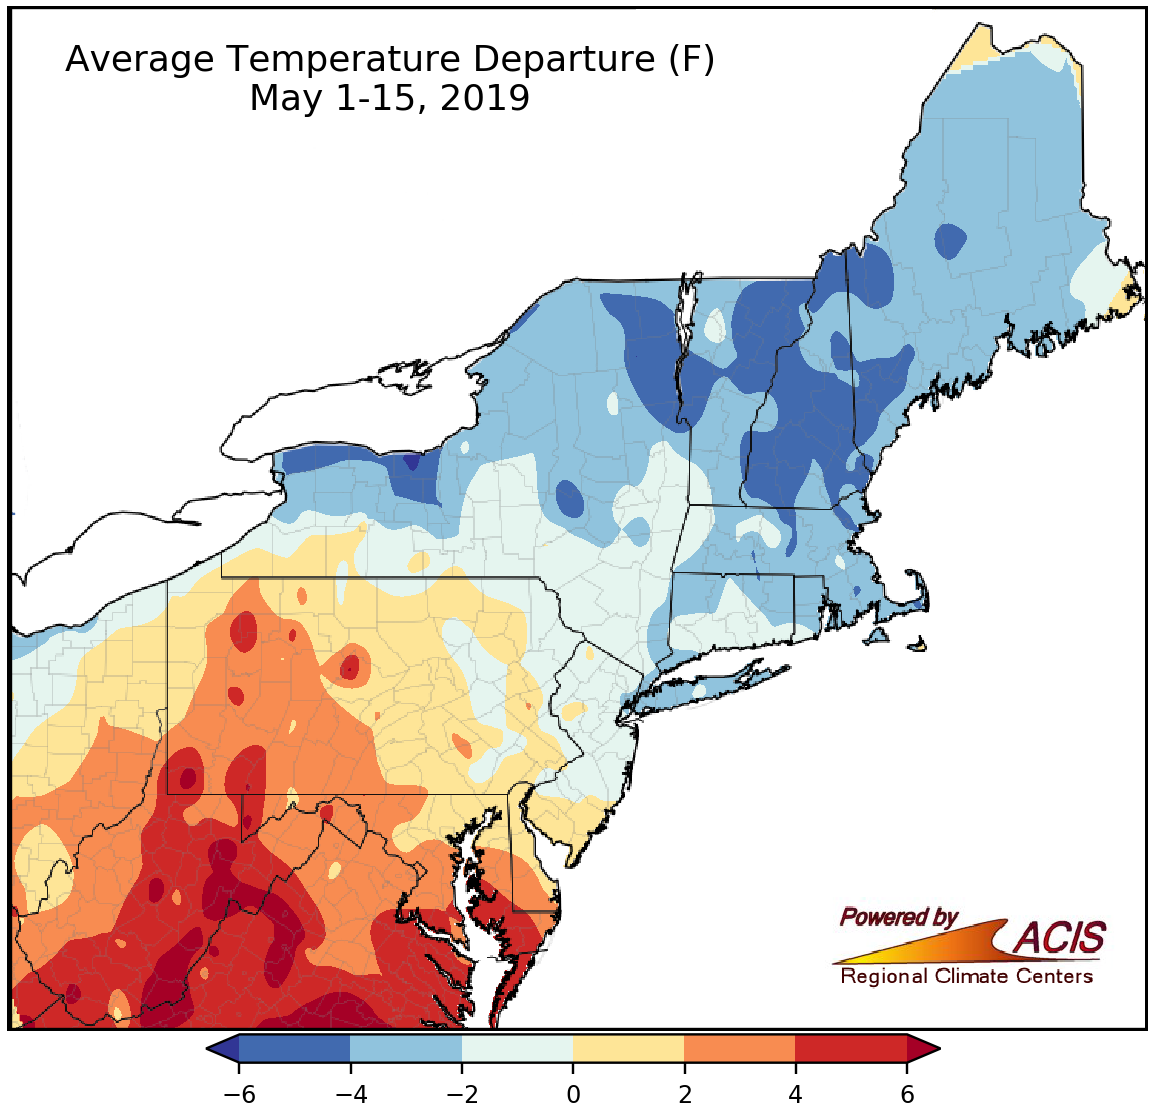
May 1-15 average temperatures ranged from 6°F below normal to more than 6°F above normal.
Average temperatures during the first two weeks of May were wide-ranging, from 6°F below normal to more than 6°F above normal. The dividing line roughly ran along Pennsylvania’s borders with New York and New Jersey, with areas to the northern and east being below normal and areas to the south and west being above normal. The coldest spots of 4-6°F below normal were generally in New York and northern New England, while the warmest spots of more than 6°F above normal were in West Virginia. As for the 35 major climate sites, seven ranked this May 1-15 period among their 20 coldest on record, while three ranked it among their 20 warmest.
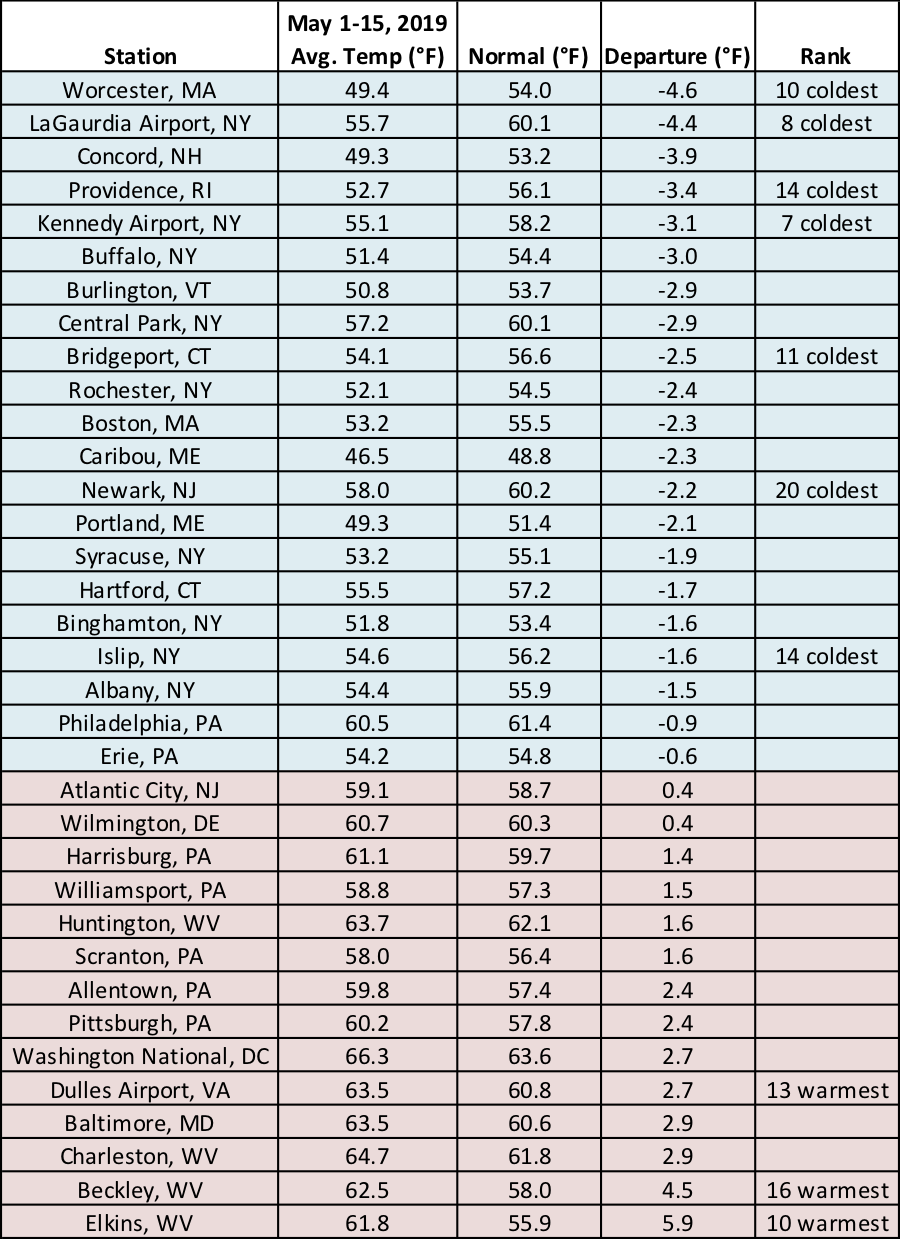
At the major climate sites, average temperatures during the first two weeks of May ranged from 4.6°F below normal in Worcester, MA, to 5.9°F above normal in Elkins, WV.
The Northeast typically doesn’t see much snow in May. In fact, only 11 major climate sites average measurable snowfall (0.1 in.) during the first half of the month. Of those, none received measurable snow this May 1-15 period! The only two sites reporting snow were Caribou, ME, and Worcester, MA, with a trace.
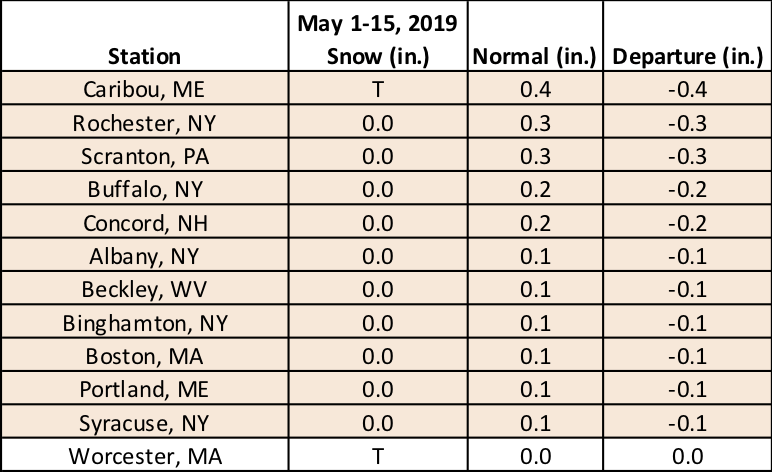
None of the major climate sites saw measurable snow during the first half of May.
What about June? NOAA’s Climate Prediction Center favors above-normal temperatures for eastern parts of the Northeast, with equal chances of below-, near-, or above-normal temperatures for the rest of the region. For precipitation, the whole region falls into the equal chances category.
CPC’s temperature outlook indicates either equal chances or a tilt towards above-normal temperatures for June in the Northeast.
CPC’s June precipitation outlook shows equal chances for the Northeast.