S(n)o(w) Long to a Cold First Half of May!
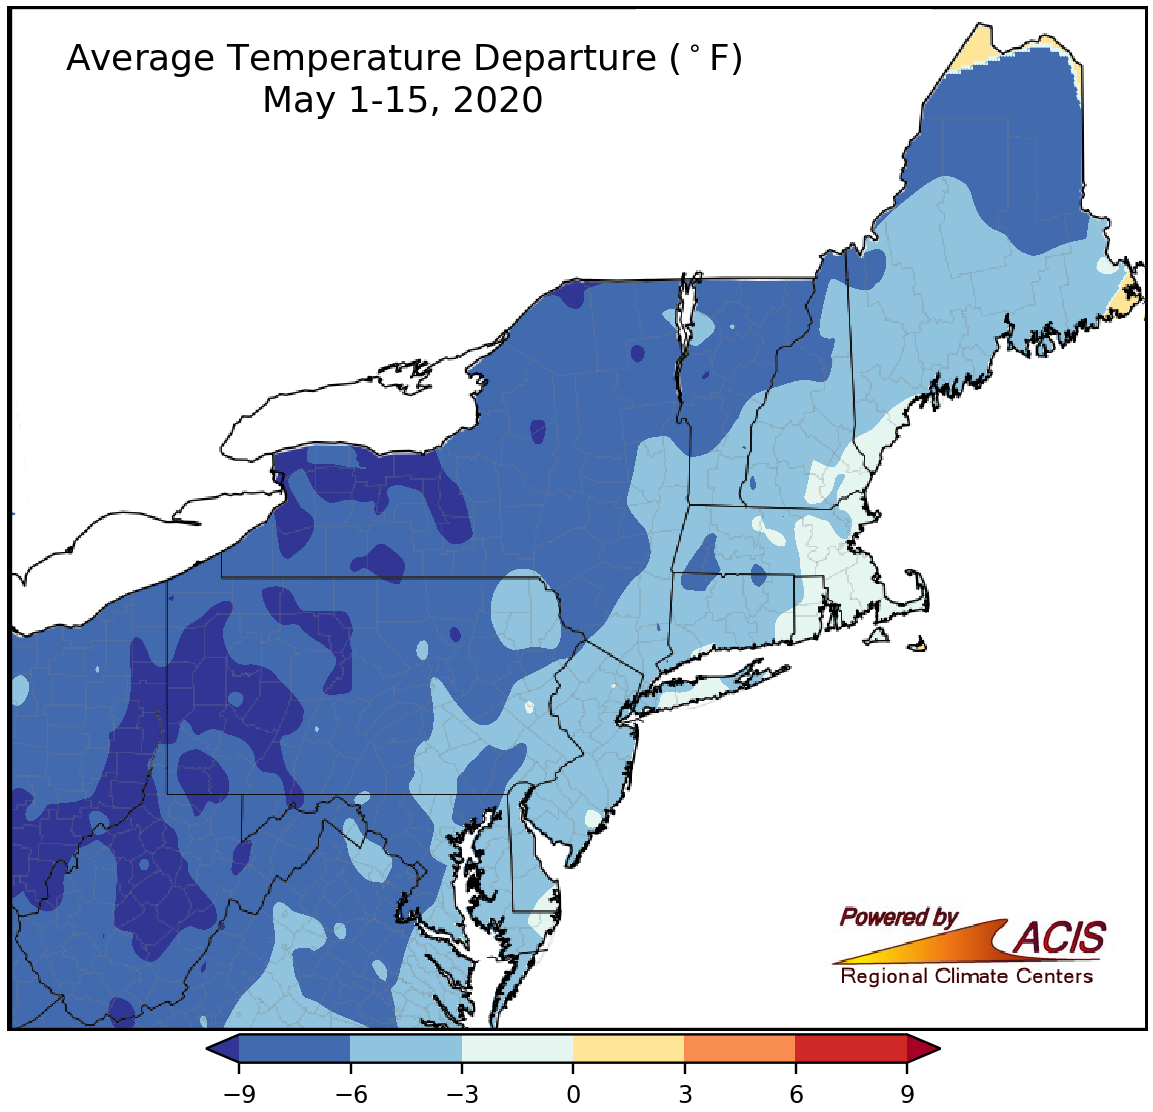
May 1-15 average temperatures ranged from more than 9°F below normal to within 3°F of normal.
The first half of May was colder than normal across the entire Northeast. Average temperatures ranged from more than 9°F below normal in interior locations such as West Virginia, the western half of Pennsylvania, and western/central New York to within 3°F of normal in coastal locations such as southern Maine, southeastern New Hampshire, eastern Massachusetts, and Rhode Island. All 35 major climate sites were colder than normal, with 29 of them ranking this first half of May among their 20 coldest on record. Average temperatures at the major climate sites ranged from 9°F below normal in Rochester, NY, to 1.3°F below normal in Portland, ME.
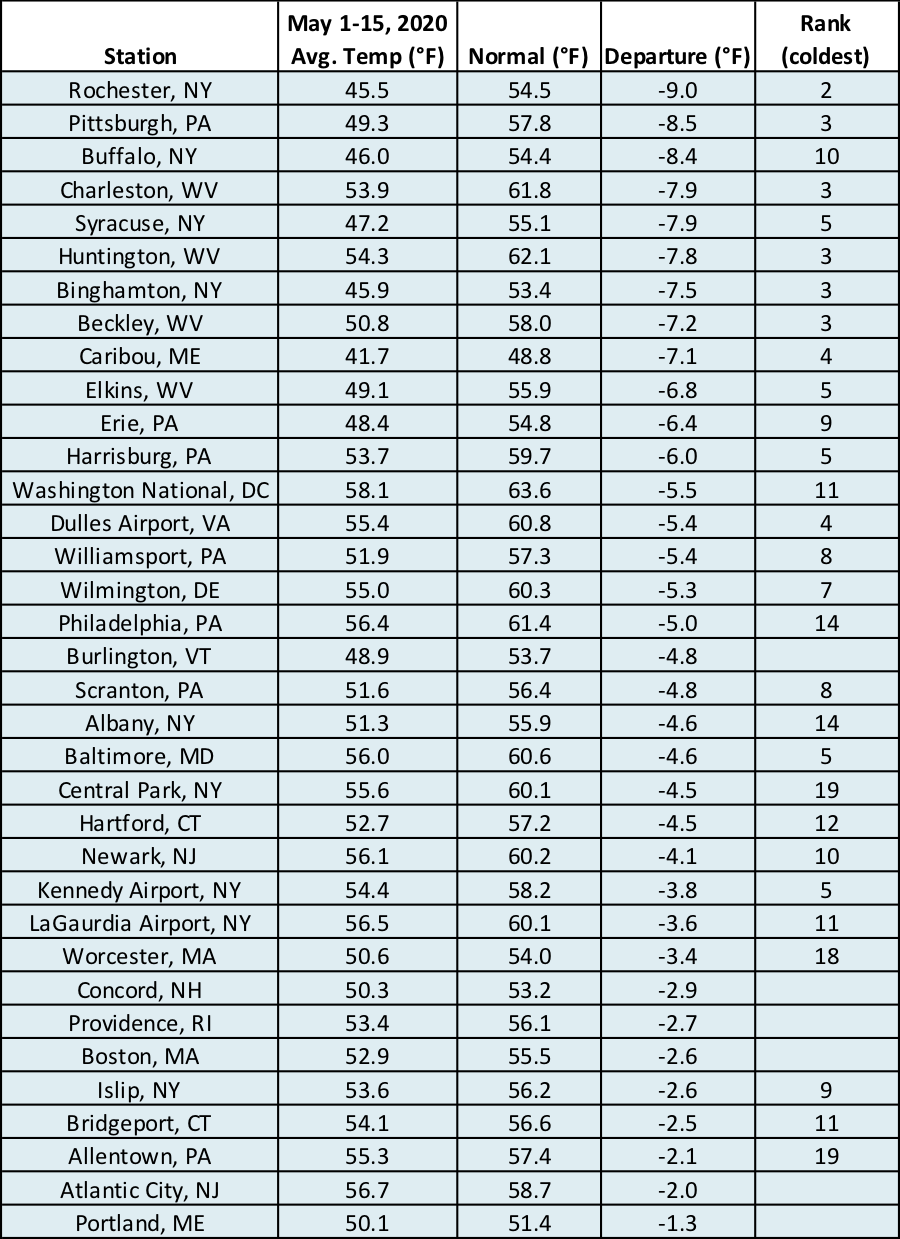
Twenty-nine of the 35 the major climate sites ranked this first half of May among their 20 coldest on record.
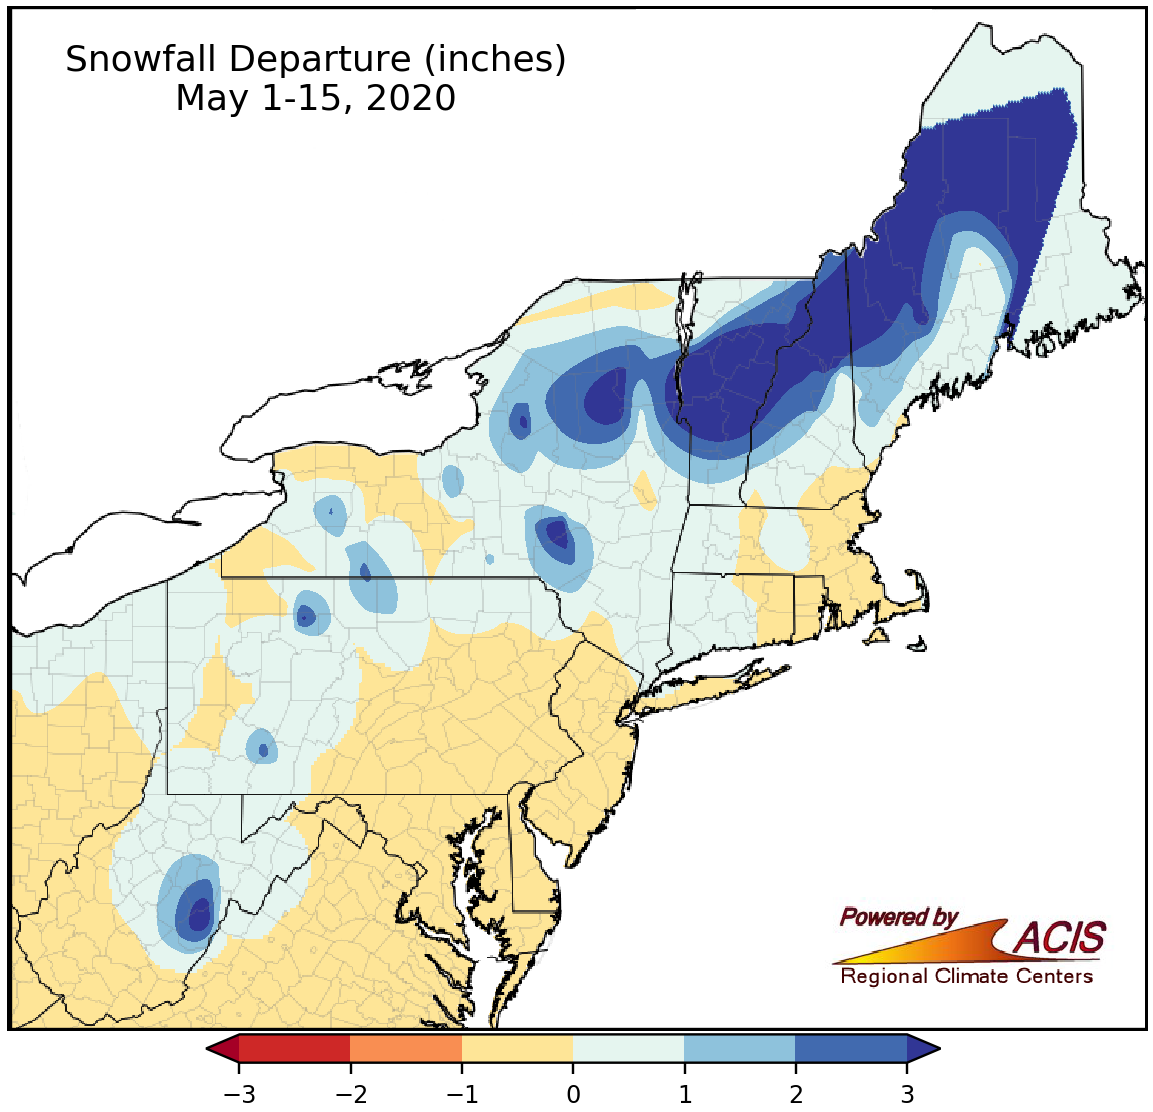
May 1-15 snowfall ranged from near normal to more than 3 inches above normal.
Typically, the Northeast doesn’t see much snow in May. So, when it does snow in May, it doesn’t take much to make it a snowy month! For instance, Elkins, WV, saw 1.5 inches of snow on May 8, making it the snowiest May on record. Overall, May 1-15 snowfall ranged from near normal to more than 3 inches above normal, with the greatest surpluses in northern New England and the higher elevations of northern/southeastern New York and eastern West Virginia. At the 35 major climate sites, May 1-15 snowfall ranged from 0.3 inches below normal in Scranton, PA, to 5.5 inches above normal in Caribou, ME. Nine major climate sites (that received measurable snow) ranked this May (yes, the full month) among their 15 snowiest on record. Even for some sites that only saw a trace the snow in May was noteworthy. For example, Bridgeport, CT, recorded a trace of snow for only the third time on record in May.
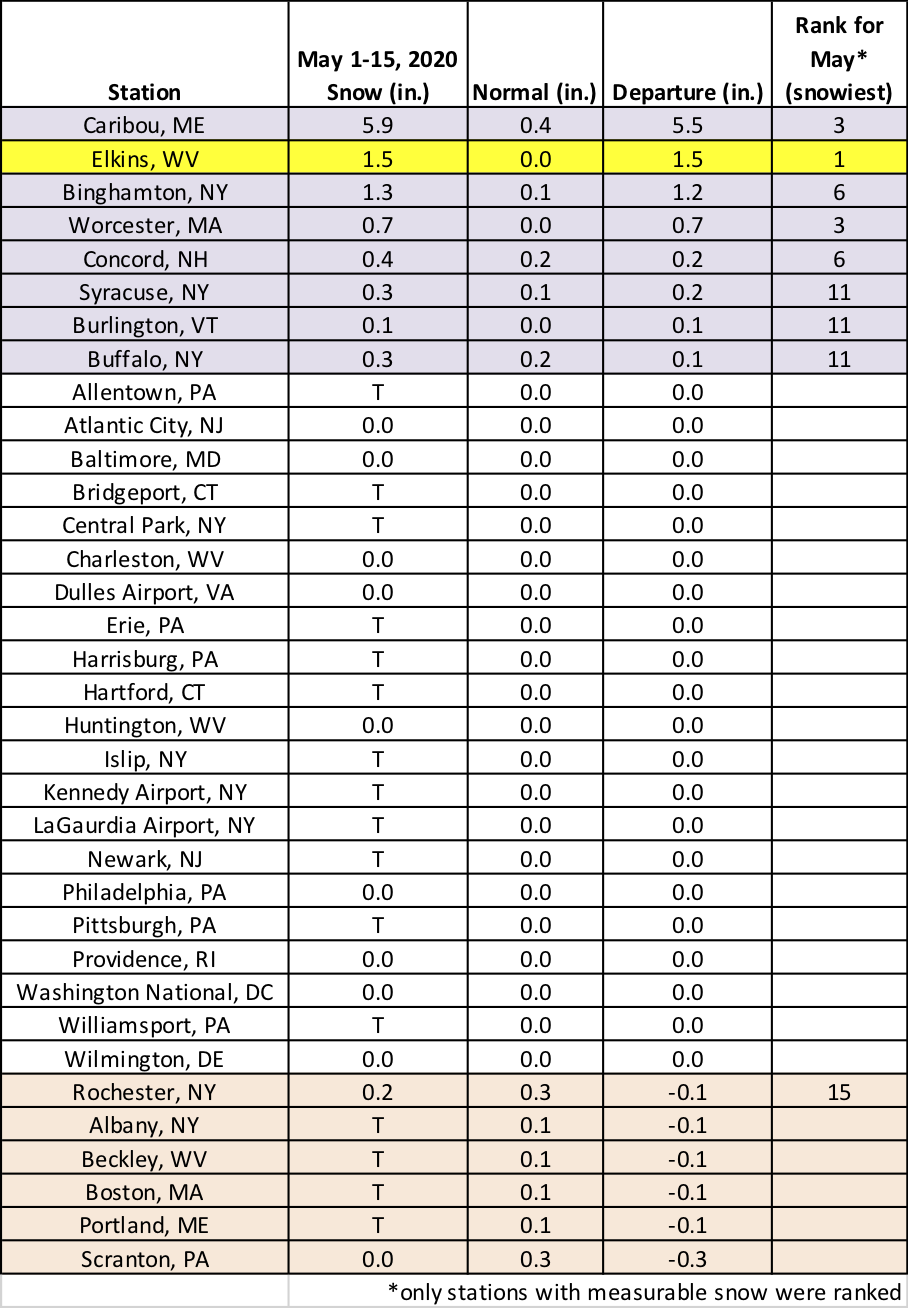
Nine major climate sites ranked this May among their 15 snowiest on record.
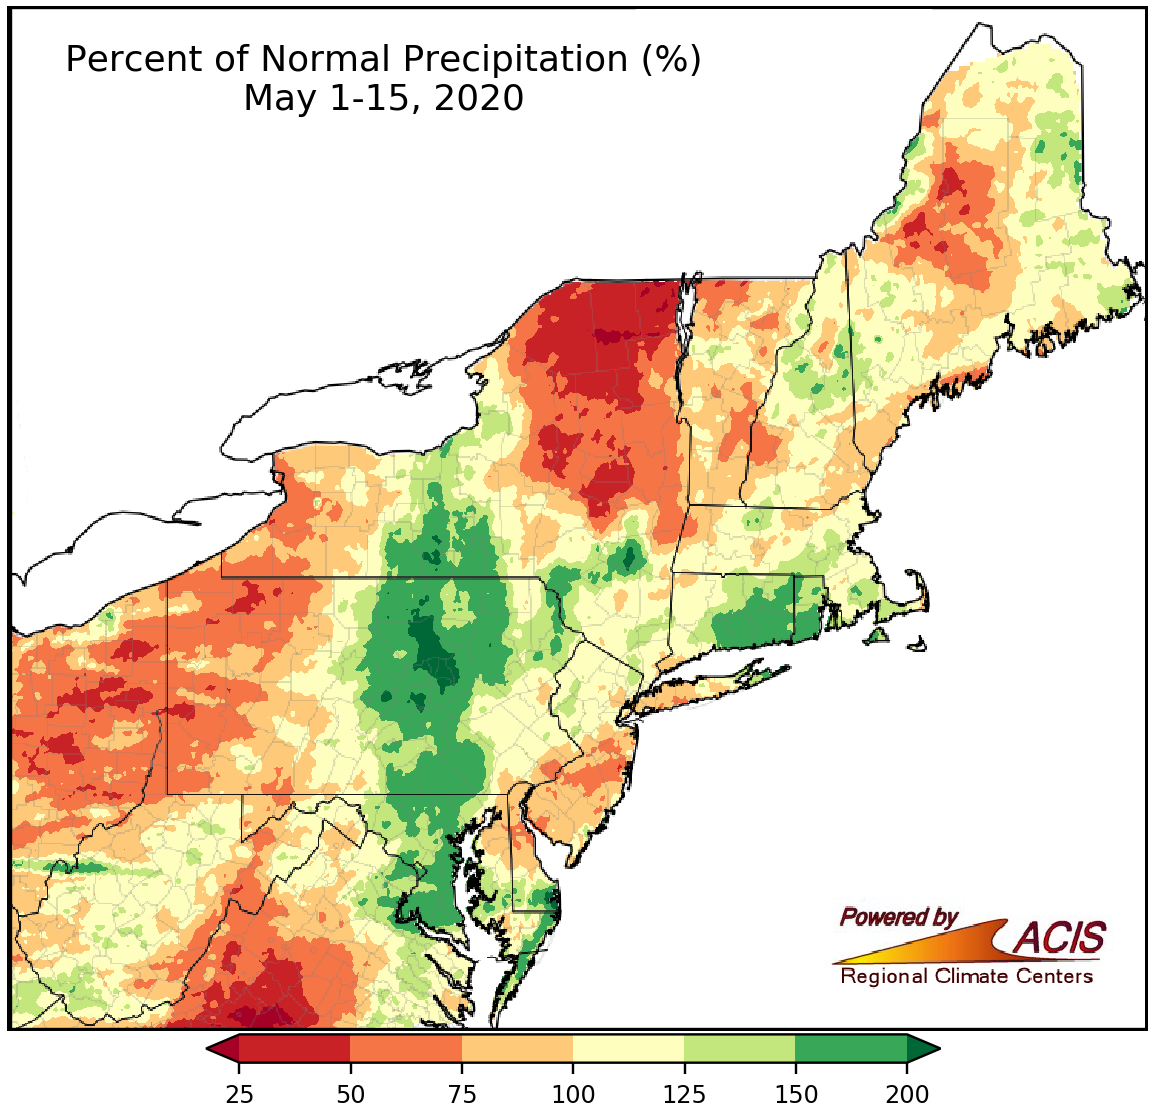
May 1-15 precipitation ranged from 25% of normal to more than 200% fo normal.
Precipitation during the first half of May varied, ranging from less than 50% of normal in several locations including northern New York to more than 200% of normal in central Pennsylvania. At the major climate sites, precipitation ranged from 41% of normal in Philadelphia, PA, and Rochester, NY, to 150% of normal in Providence, RI. Two sites, Newark, NJ, and Kennedy Airport, NY, ranked this first half of May among their 20 driest on record.
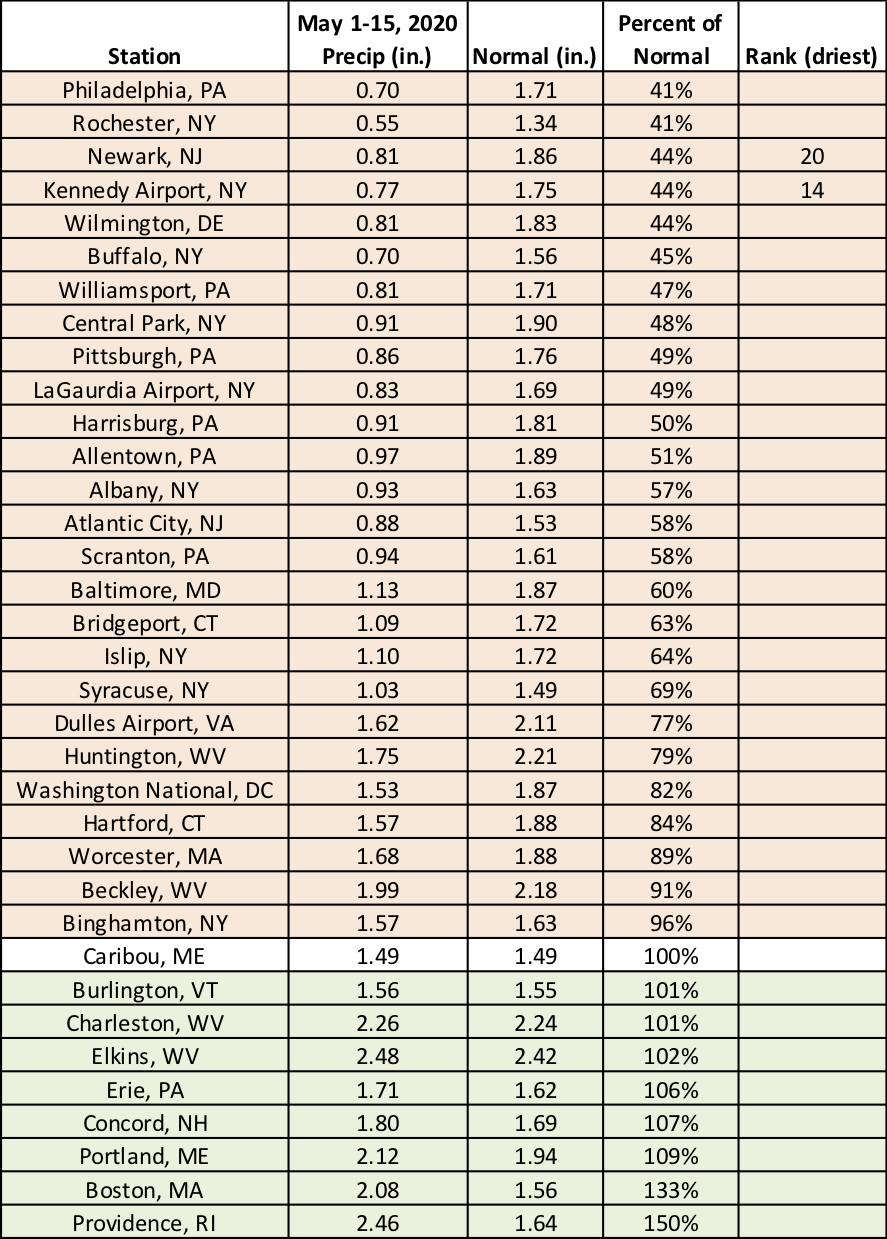
Twenty-six of the 35 major climate sites were drier than normal during the first half of May.
What does the rest of May look like? NOAA’s Climate Prediction Center favors above-normal temperatures and near- or above-normal precipitation.
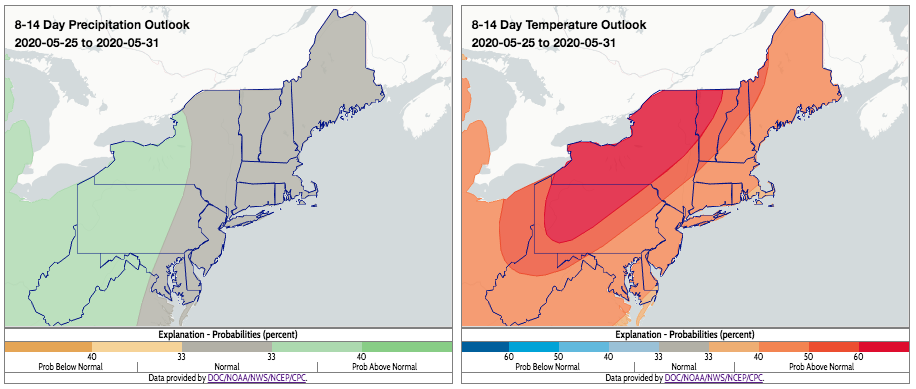
CPC’s temperature outlook indicates a tilt towards above-normal temperatures for the rest of May in the Northeast. Click to enlarge.