Mid-July - Hit or Miss Rainfall
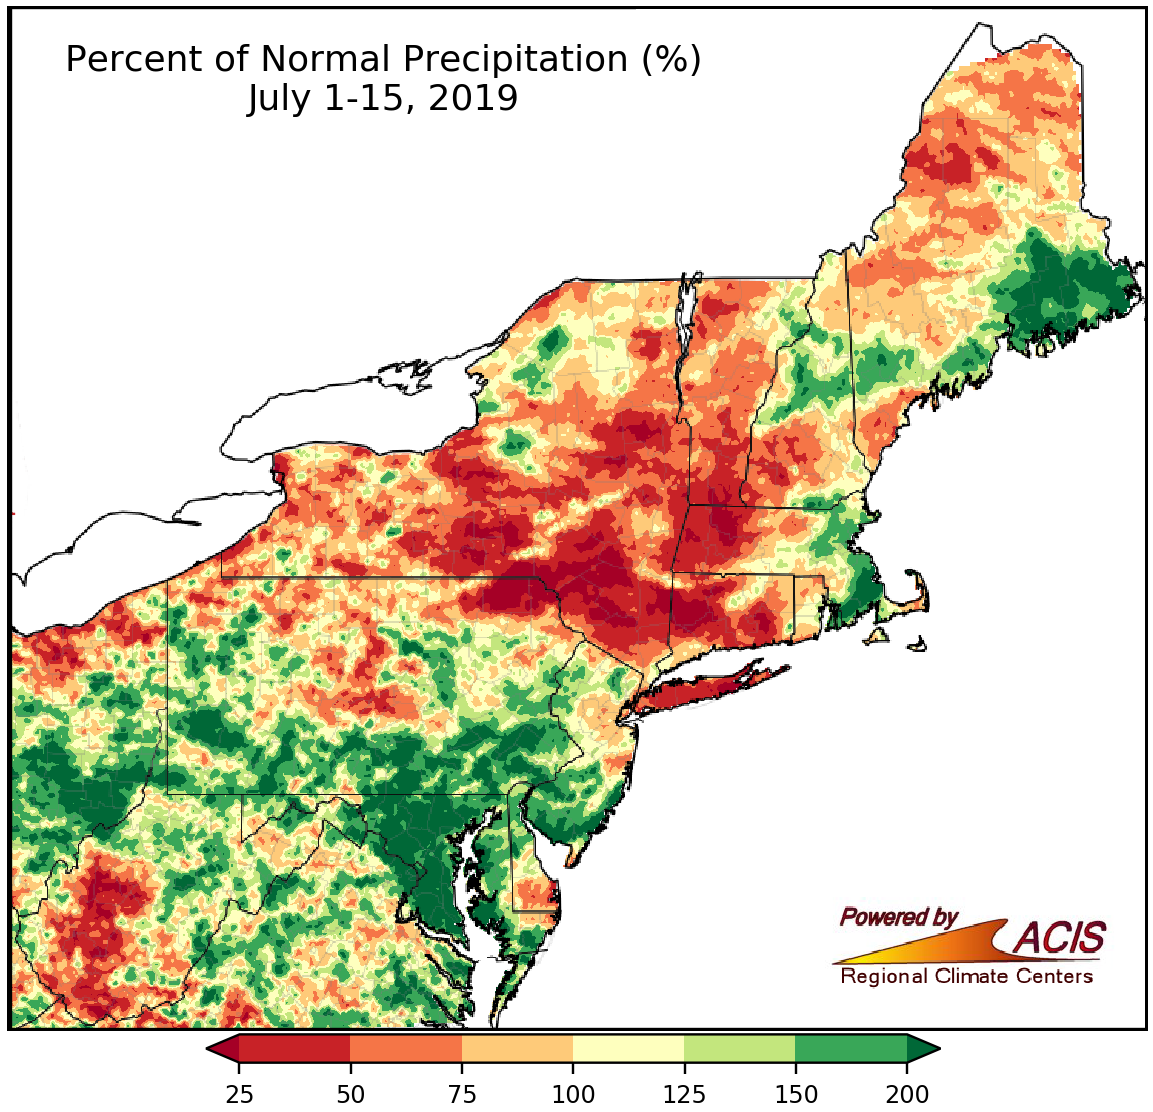
July 1-15 rainfall ranged from less than 25% of normal to more than 200% of normal.
Rainfall during the first two weeks of July was hit or miss across the Northeast, with the driest areas receiving less than 25% of normal and the wettest areas picking up more than 200% of normal. For instance, Syracuse, NY, saw only 5% of their normal July 1-15 rainfall, while Washington National, D.C., saw 306% of normal. Six of the 20 drier-than-normal major climate sites ranked this July 1-15 period among their 20 driest. On the other hand, another six major climate ranked the period among their 20 wettest on record.
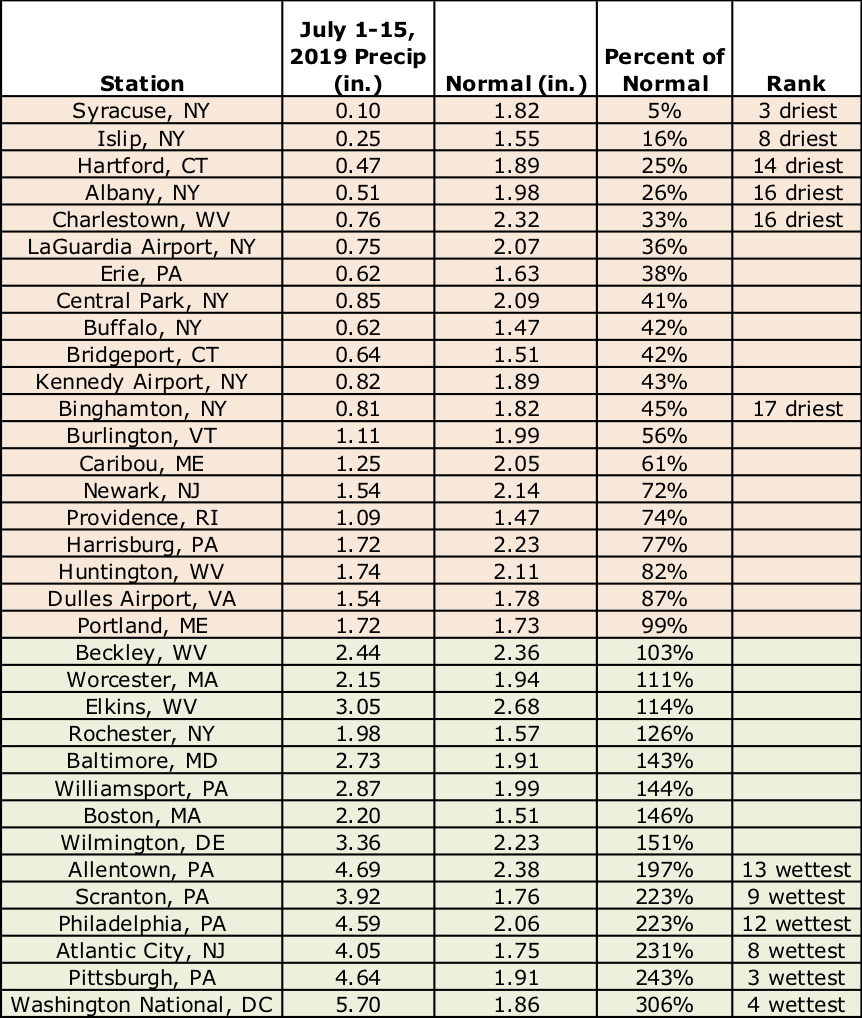
Precipitation so far this July at the major climate sites ranged from 5% of normal in Syracuse, NY, to 306% of normal at Washington National, D.C.
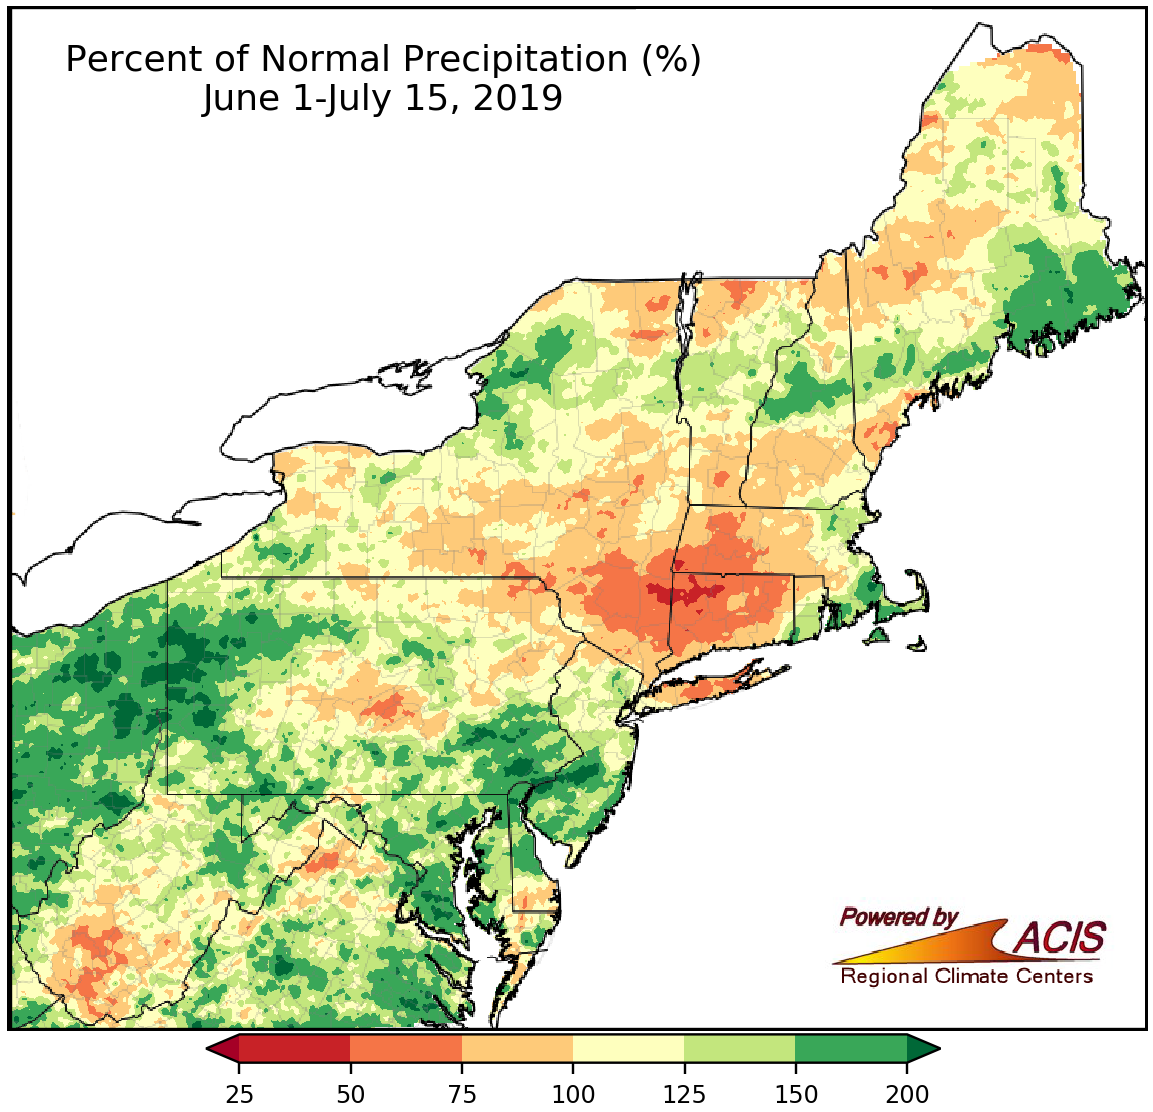
June 1-July 15 rainfall ranged from less than 50% of normal to more than 200% of normal.
Precipitation during the first half of summer was also variable, with parts of New York and southern New England seeing less than 50% of normal and parts of Pennsylvania and New Jersey seeing more than 200% of normal. In fact, this June 1-July 15 period was the wettest on record for Philadelphia, PA. Plus, another nine major climate sites ranked this first half of summer among their 20 wettest. Conversely, the period ranked among the 20 driest at three major climate sites.
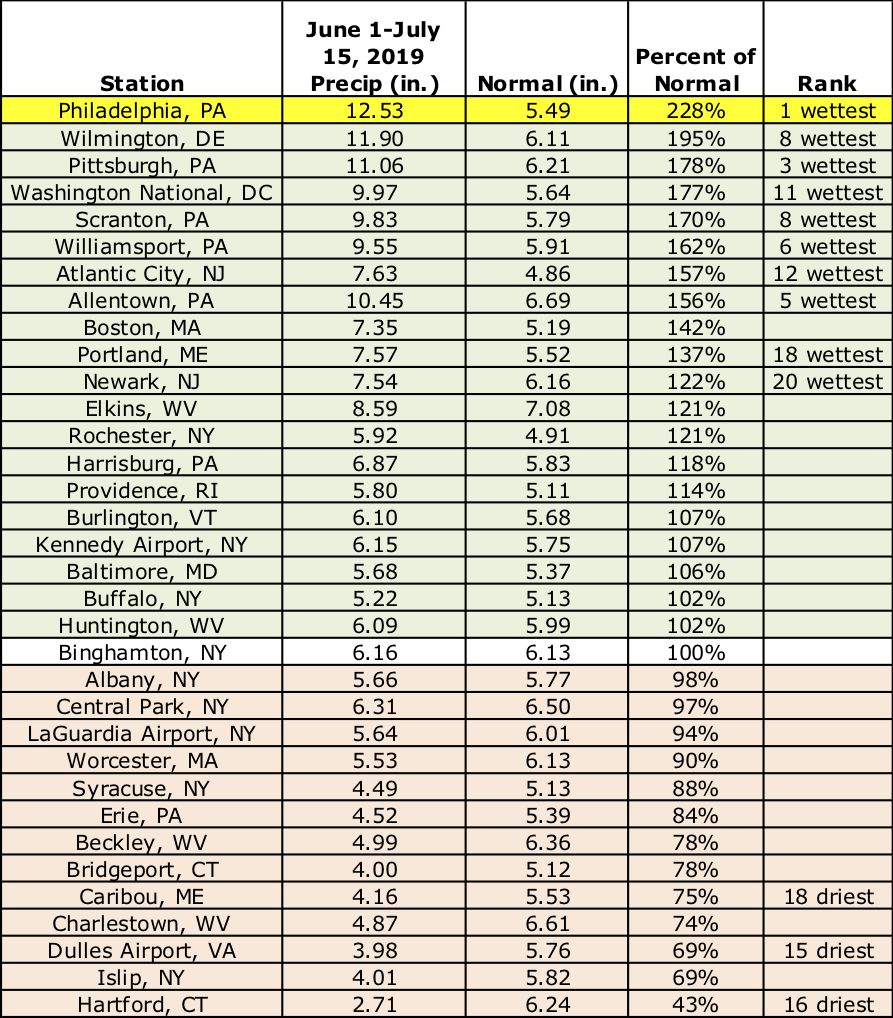
Philadelphia, PA, had a record wet first half of summer but rainfall totals were highly variable across the Northeast.
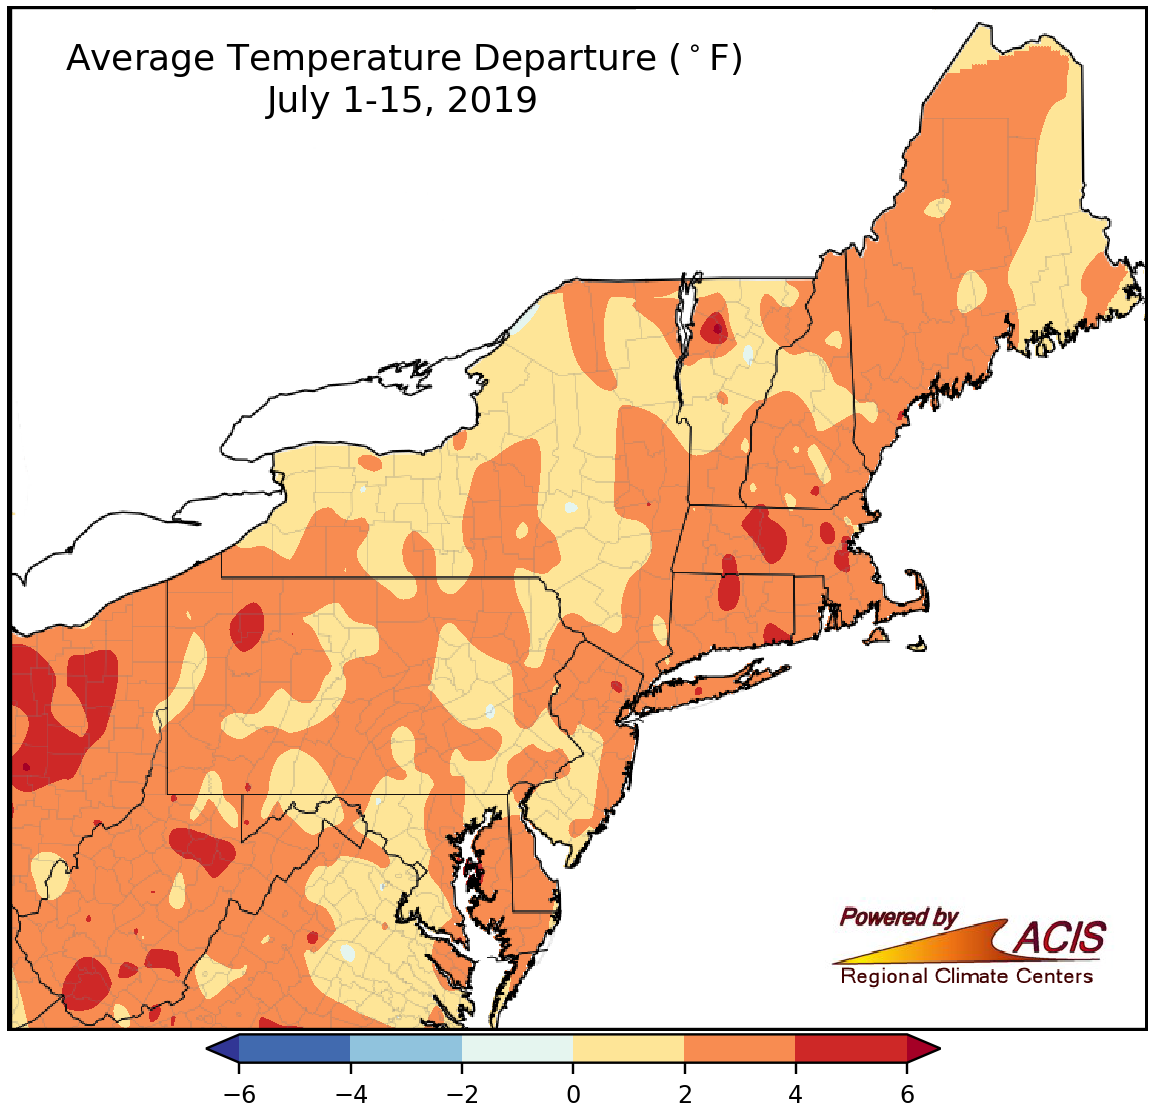
So far, July has been warmer than normal for the entire Northeast.
Average temperatures during the first half of July were up to 6°F above normal. All 34 major climate sites experienced warmer-than-normal temperatures, with 28 of them ranking this July 1-15 period among their 20 warmest on record. Boston, MA, had the largest departure at 5.4°F above normal.
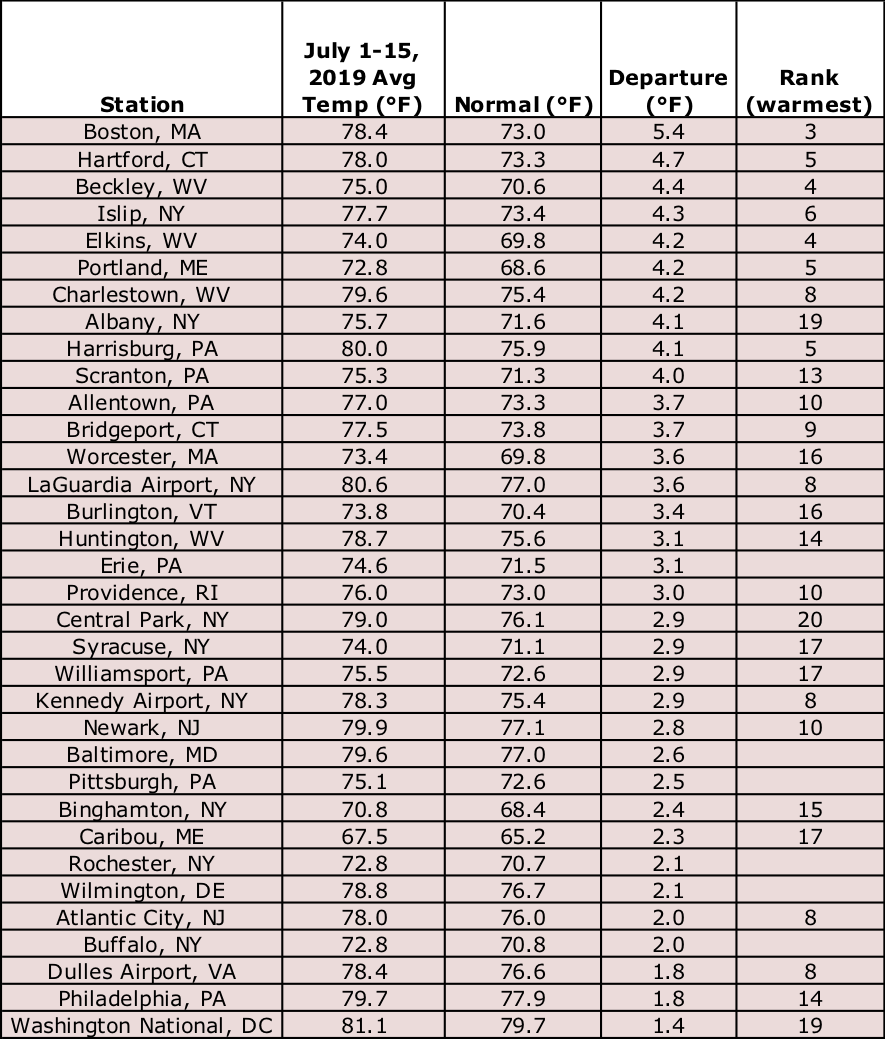
The first two weeks of July 2019 ranked among the 20 warmest on record at 28 major climate sites.
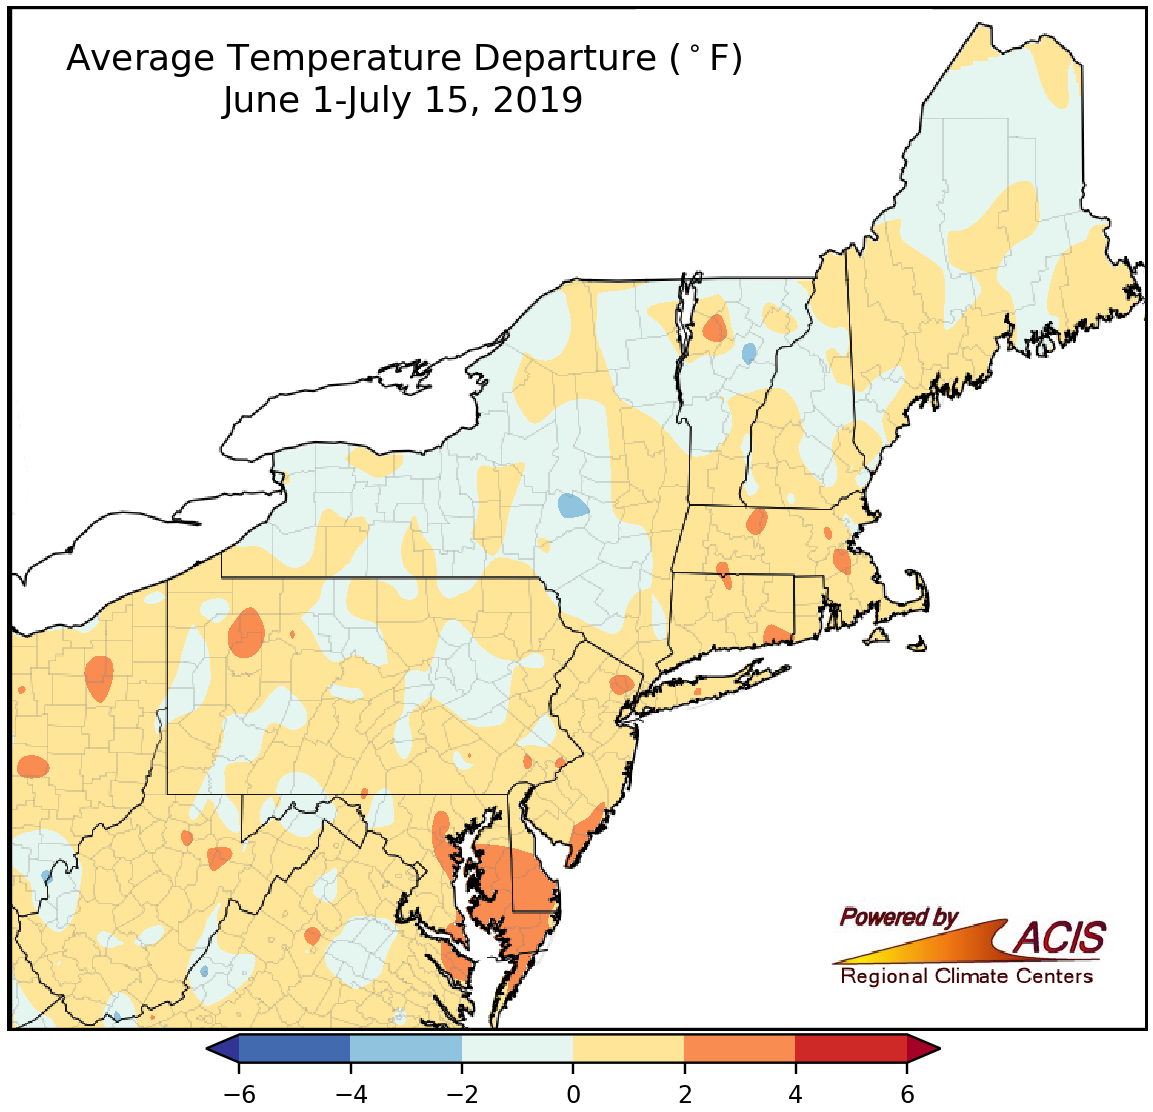
Average temperatures from June 1-July 15 ranged from 2°F below normal to 4°F above normal.
For a large portion of the Northeast, average temperatures during the first half of summer averaged out to be within 2°F of normal. However, there were a few warmer spots of up to 4°F above normal. Of the 32 warmer-than-normal major climate sites, 15 ranked this June 1-July 15 period among their 20 warmest on record.
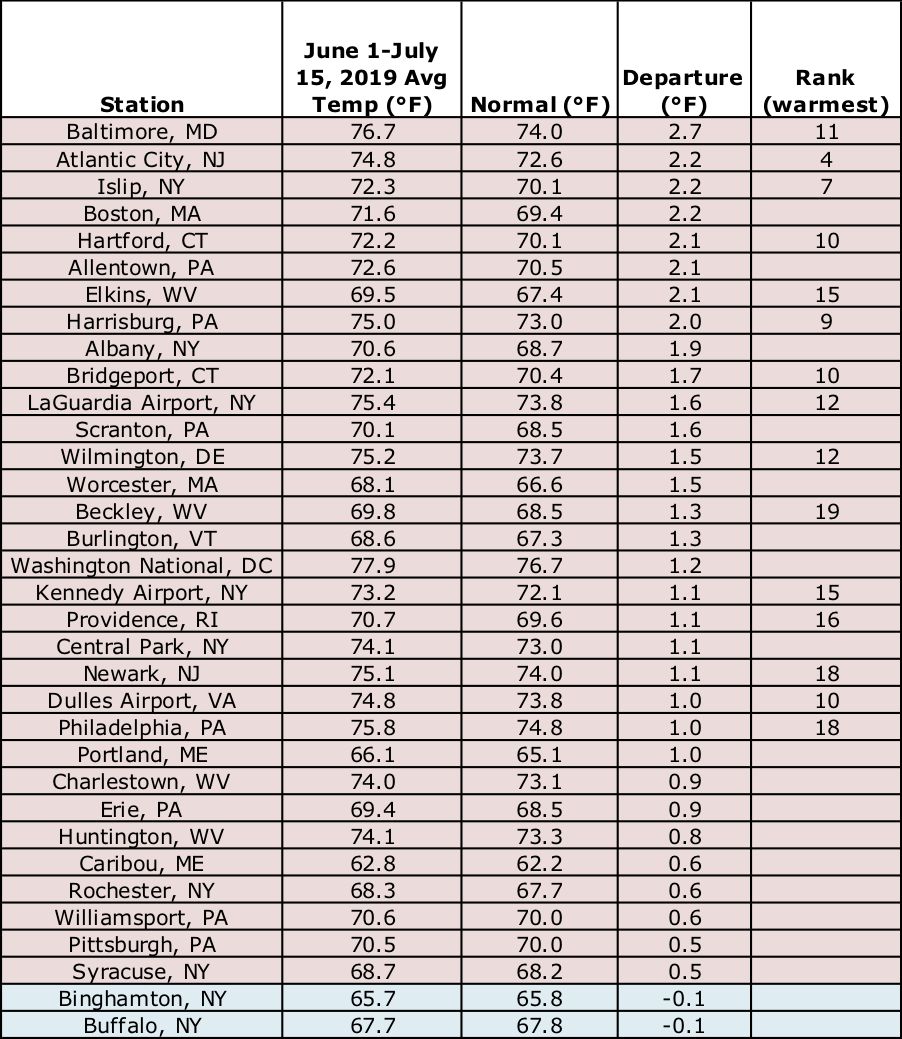
June 1-July 15 average temperatures at the major climate sites ranged from 0.1°F below normal in Binghamton and Buffalo, NY, to 2.7°F above normal in Baltimore, MD.