A Cool, Dry May Wraps Up Spring
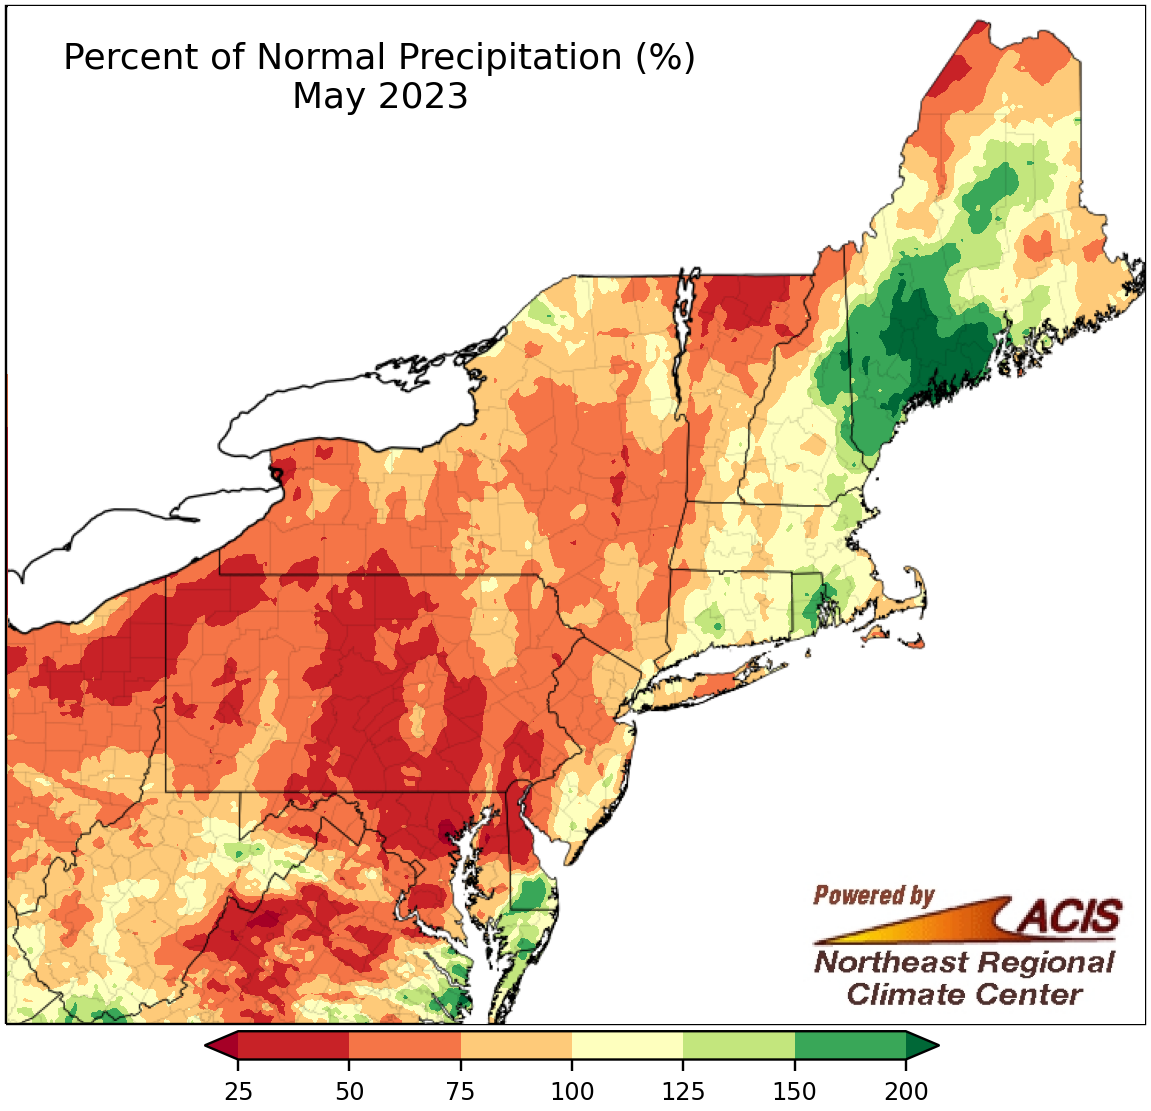
May precipitation ranged from 25% of normal to more than 200% of normal, with many areas on the dry side of normal.
Much of the Northeast saw below- or near-normal precipitation during May. The driest areas, including a swath of the Mid-Atlantic into New York, saw 25% to 50% of normal precipitation. However, portions of New England were wetter, particularly southern Maine which saw more than 200% of normal precipitation. This May was the driest on record for five (of 35) major climate sites - Philadelphia, Harrisburg, and Williamport, PA; Wilmington, DE; and Binghamton, NY - and ranked among the 20 driest on record for another 15 major climate sites. Only two of the climate sites were wetter than normal, with May precipitation for all sites ranging from 5% of normal in Harrisburg, PA, to 107% of normal in Portland, ME. With excessively dry conditions, reduced soil moisture, and low streamflow, there was widespread expansion of abnormally dry conditions in the Northeast.
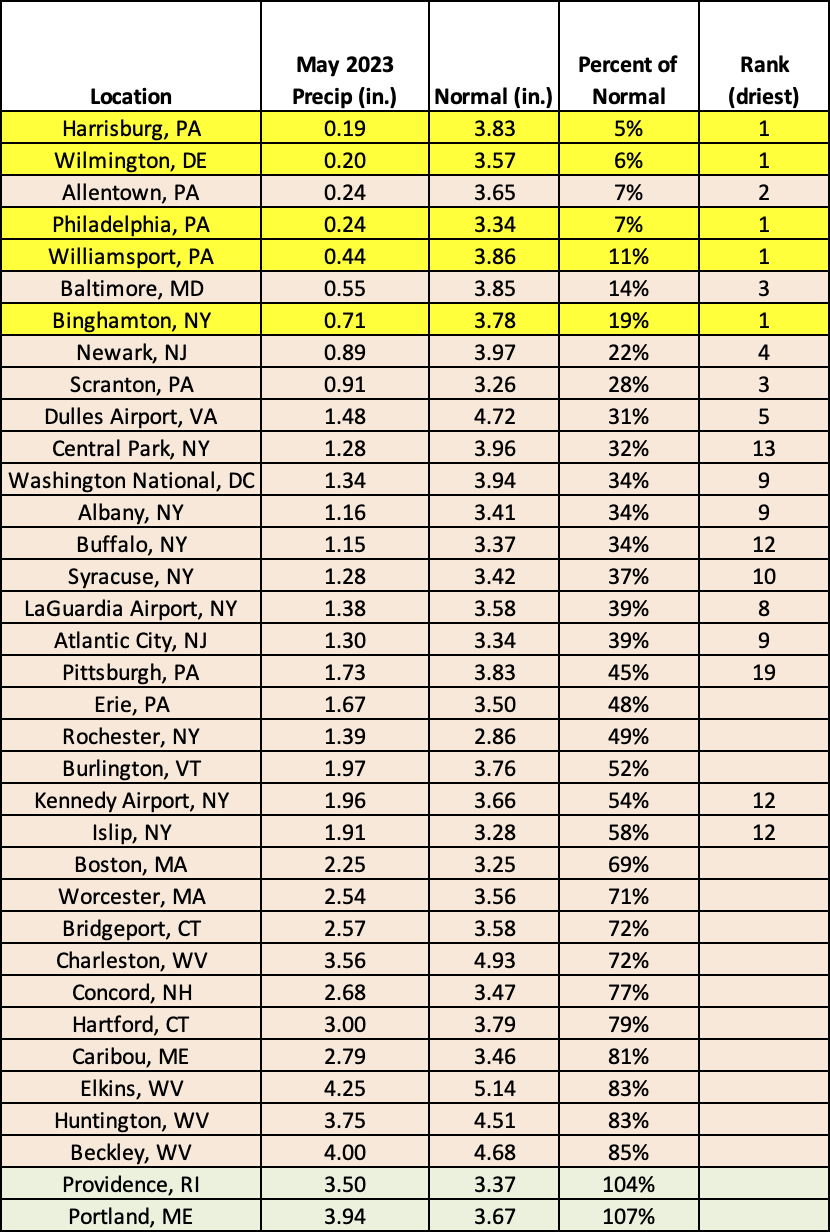
This May was record dry for five major climate sites and among the 20 driest for another 15 of the sites.
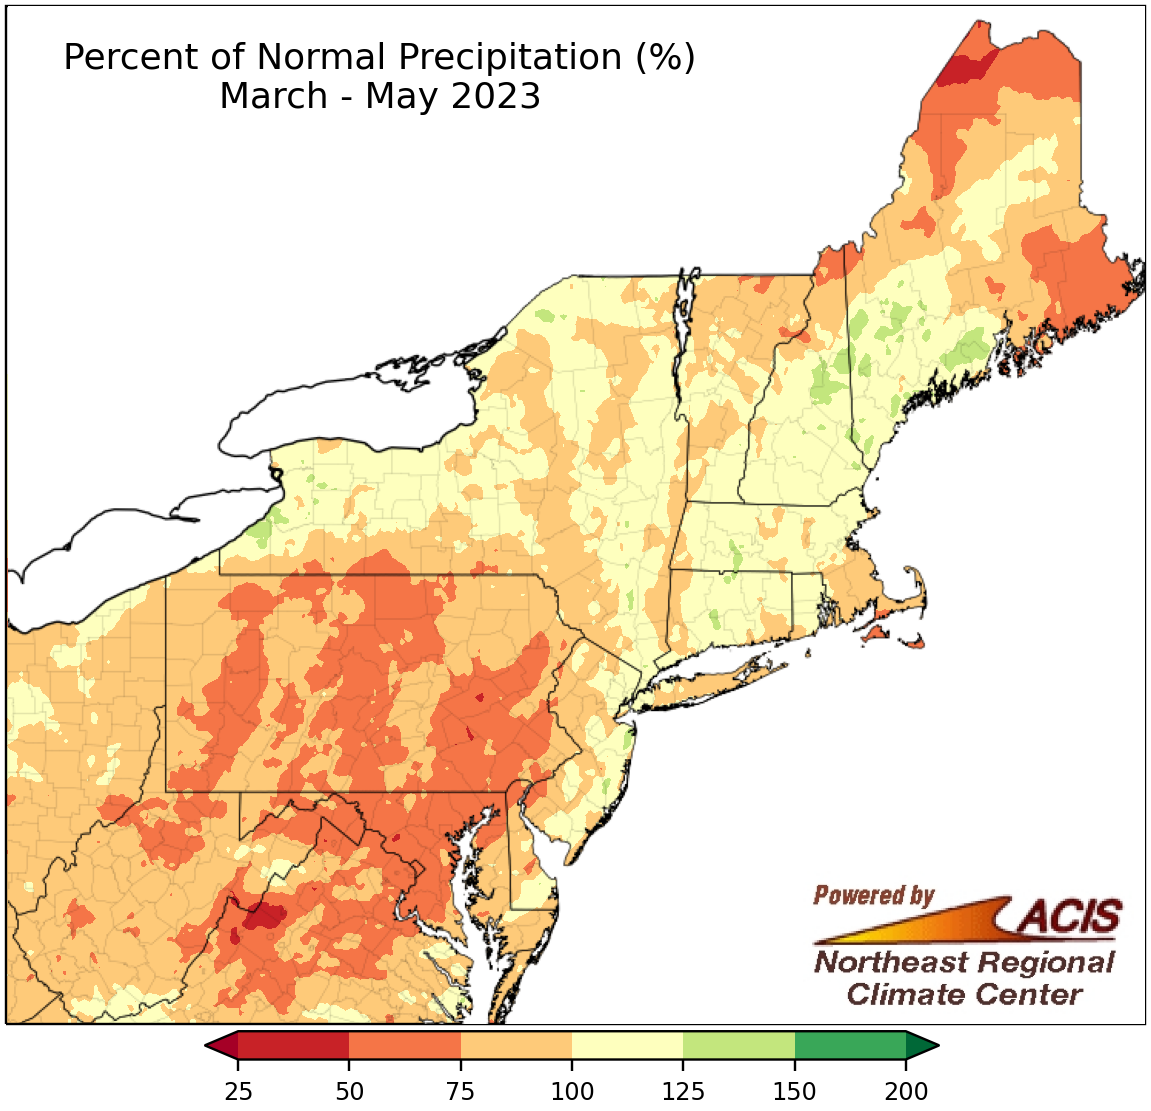
Spring precipitation ranged from 50% of normal to 150% of normal.
Spring precipitation was also below or near normal for much of the Northeast. The driest areas were generally in the Mid-Atlantic and eastern/northern Maine where precipitation ranged from 50% to 75% of normal. At the 35 major climate sites, spring precipitation ranged from 54% of normal at Dulles Airport, VA, to 115% of normal in Hartford, CT, with 25 sites being drier than normal. This spring ranked among the 20 driest on record at 10 of the major climate sites.
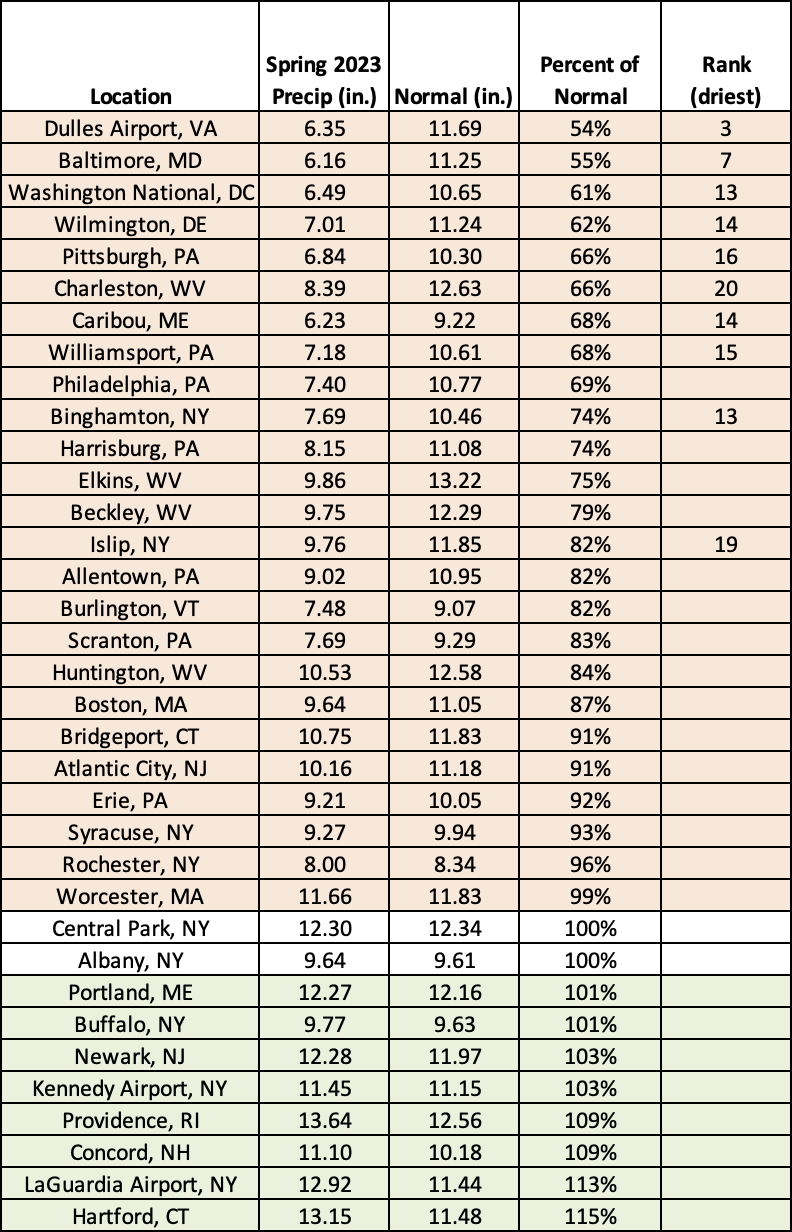
This spring ranked among the 20 driest on record for 10 major climate sites.
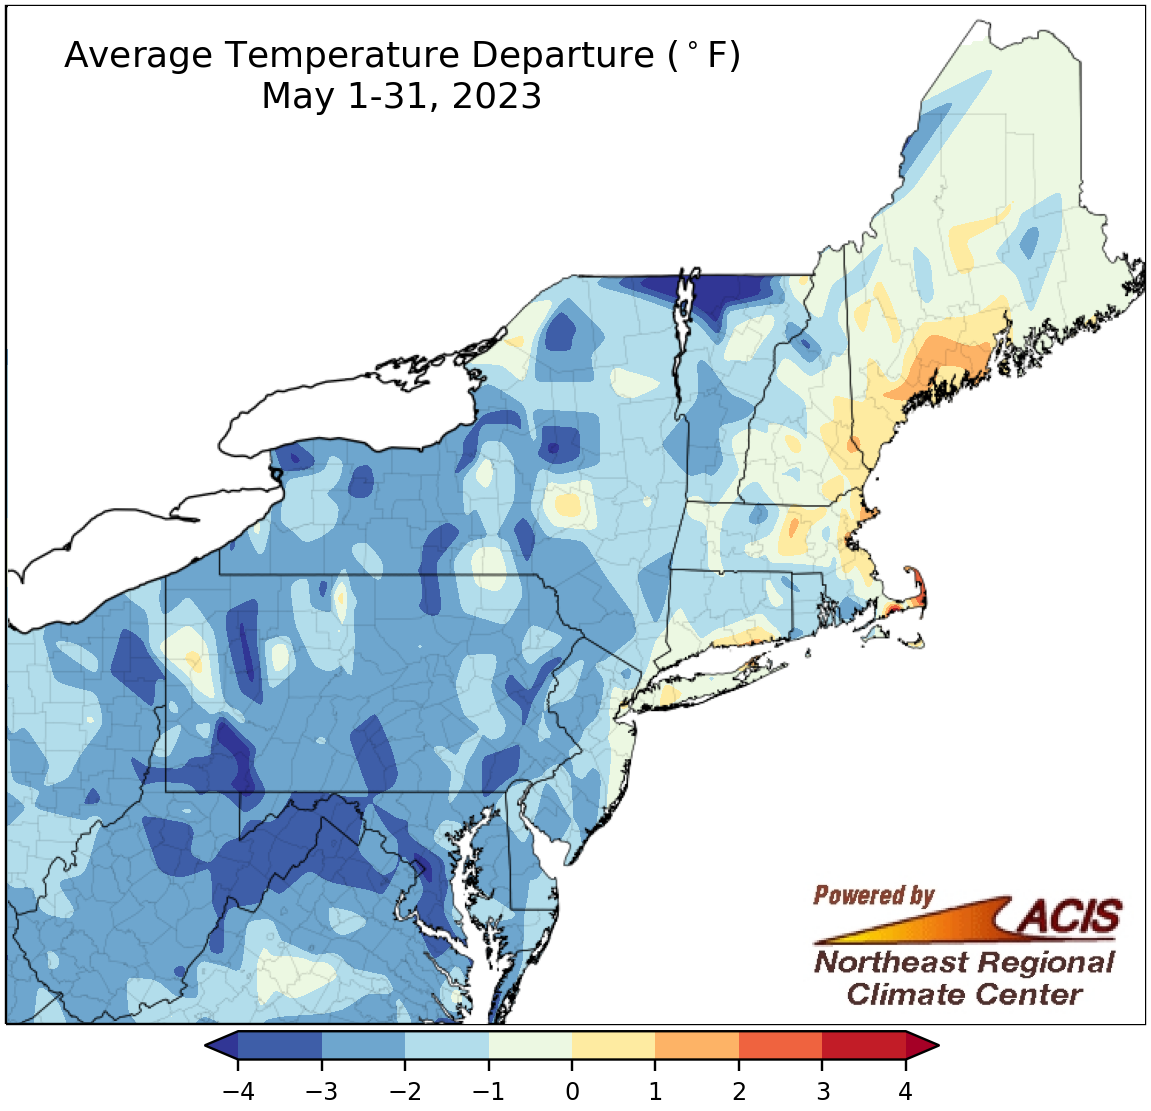
May average temperatures ranged from more than 4°F below normal to 2°F above normal.
For the first time since December 2022, quite a bit of the Northeast wrapped up a month on the cool side of normal. May average temperatures ranged from 4°F below normal to near normal for most areas, with parts of western Pennsylvania, northern New York, and northern Vermont being more than 4°F cooler than normal and some New England coastal areas being as much as 2°F warmer than normal. May average temperatures at the 35 major climate sites ranged from 3.4°F below normal in Allentown, PA, to 1.7°F above normal in Boston, MA, with 30 of the sites falling on the cool side of normal. This May was the 13th coolest in Atlantic City, NJ, but the 19th warmest for Portland, ME.
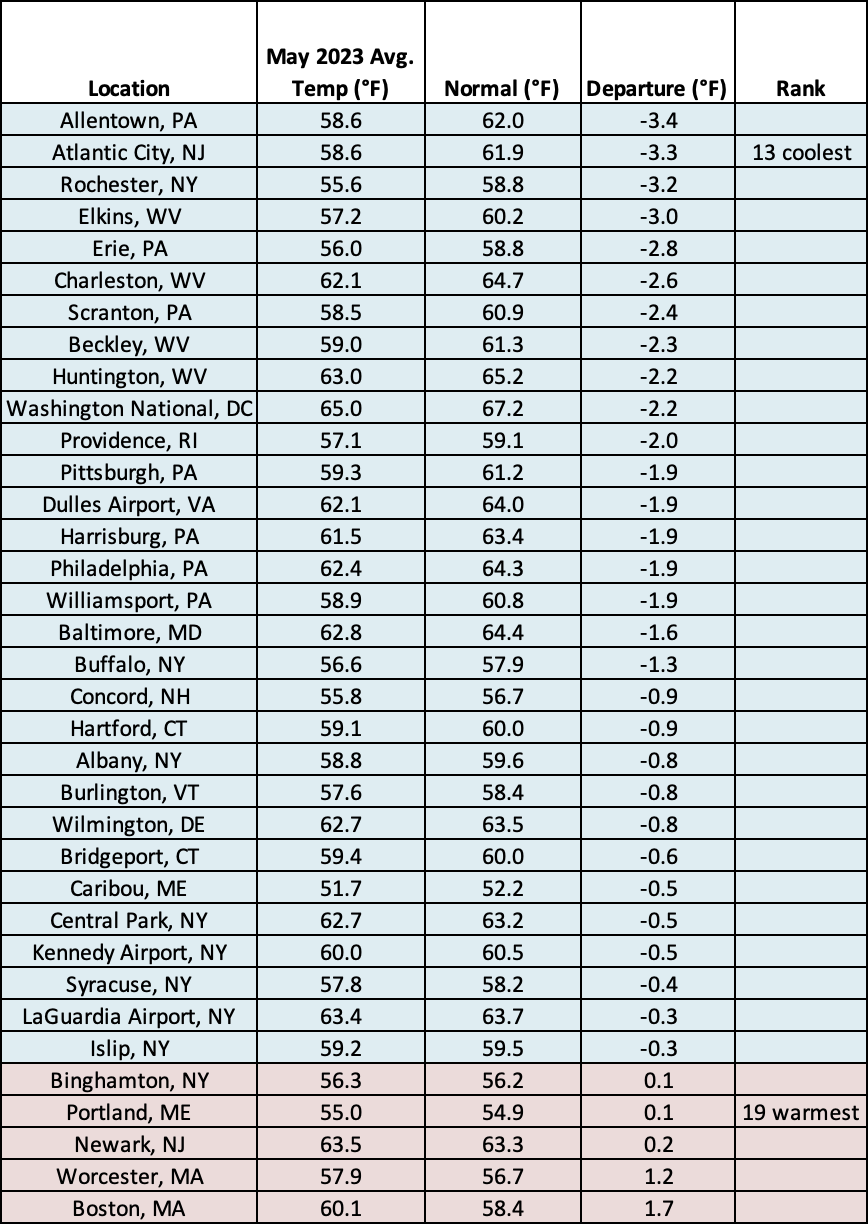
This May was the 13th coolest in Atlantic City, NJ, but the 19th warmest for Portland, ME.
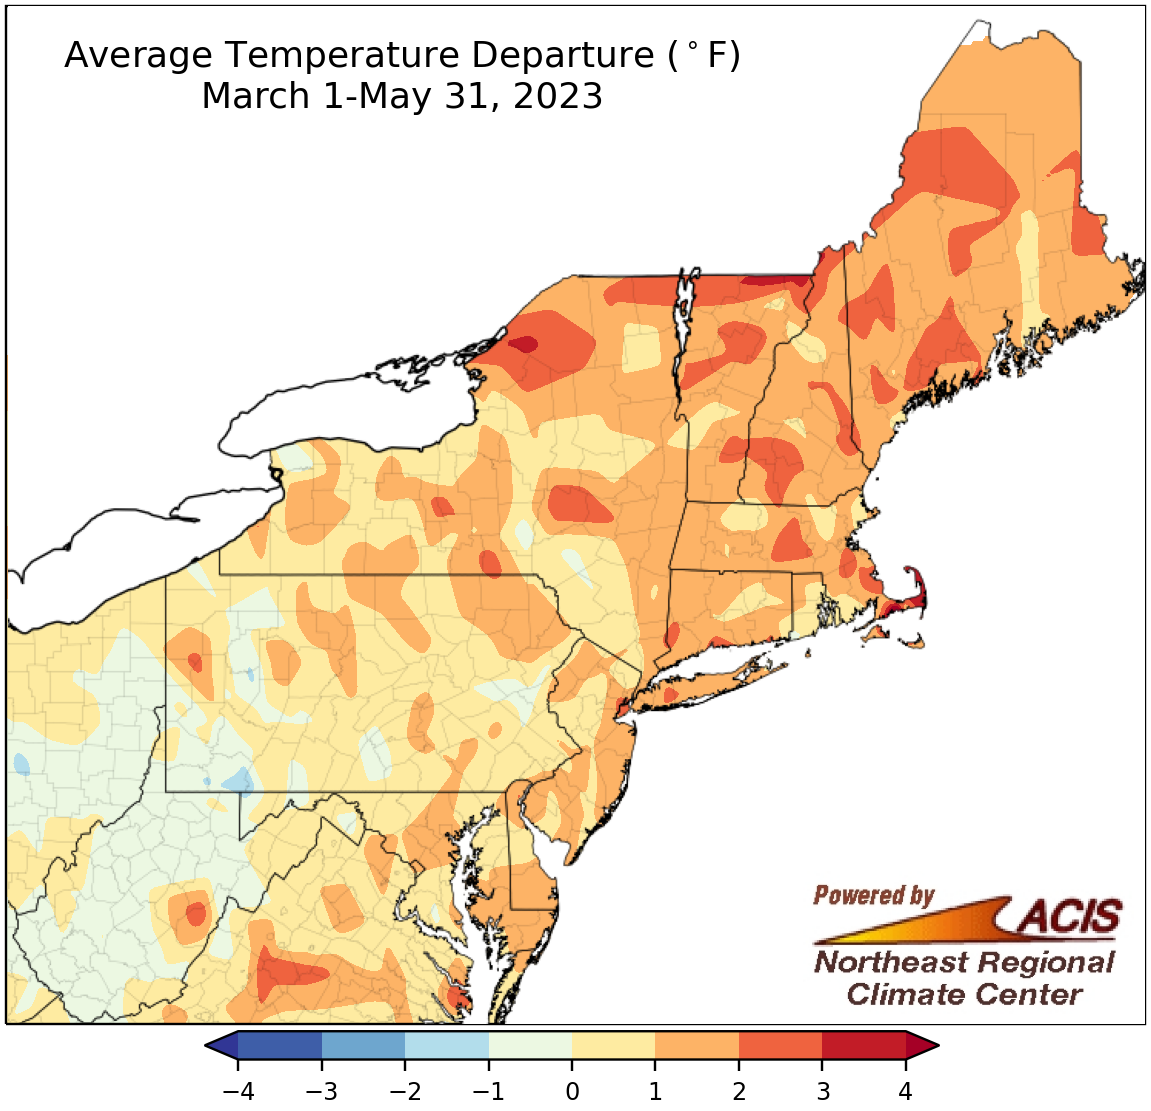
Spring temperatures ranged from 1°F below normal to 3°F above normal.
May was the temperature outlier as both March and April were warmer than normal. With that, spring average temperatures were near or above normal for most areas, ranging from 1°F below normal in the southwestern corner of the region to 3°F above normal in parts of New York and New England. At the 35 major climate sites, spring average temperatures ranged from 0.8°F below normal in Elkins and Charleston, WV, to 3.1°F above normal in Worcester, MA. Twenty-seven major climate sites had a warmer-than-normal spring, with 22 ranking this spring among their 20 warmest.
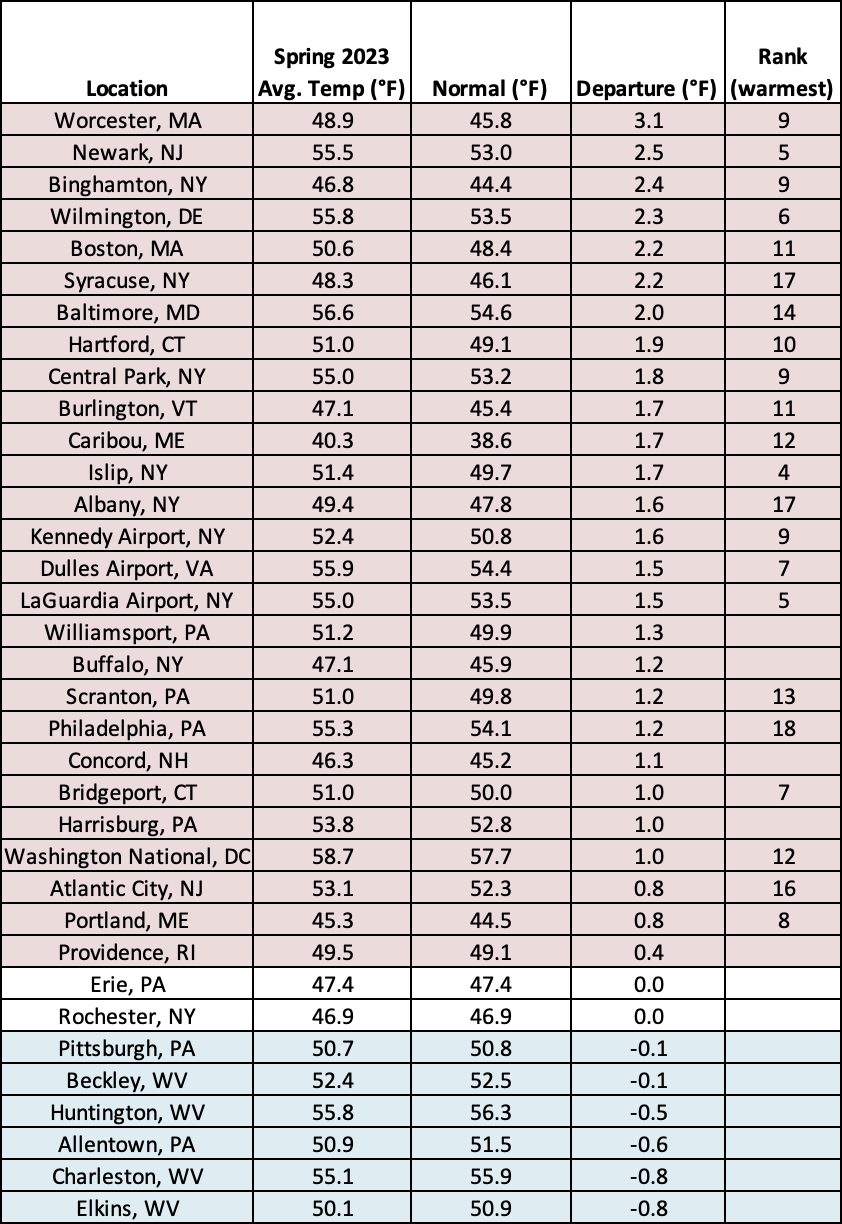
This spring ranked among the 20 warmest on record at 22 major climate sites.
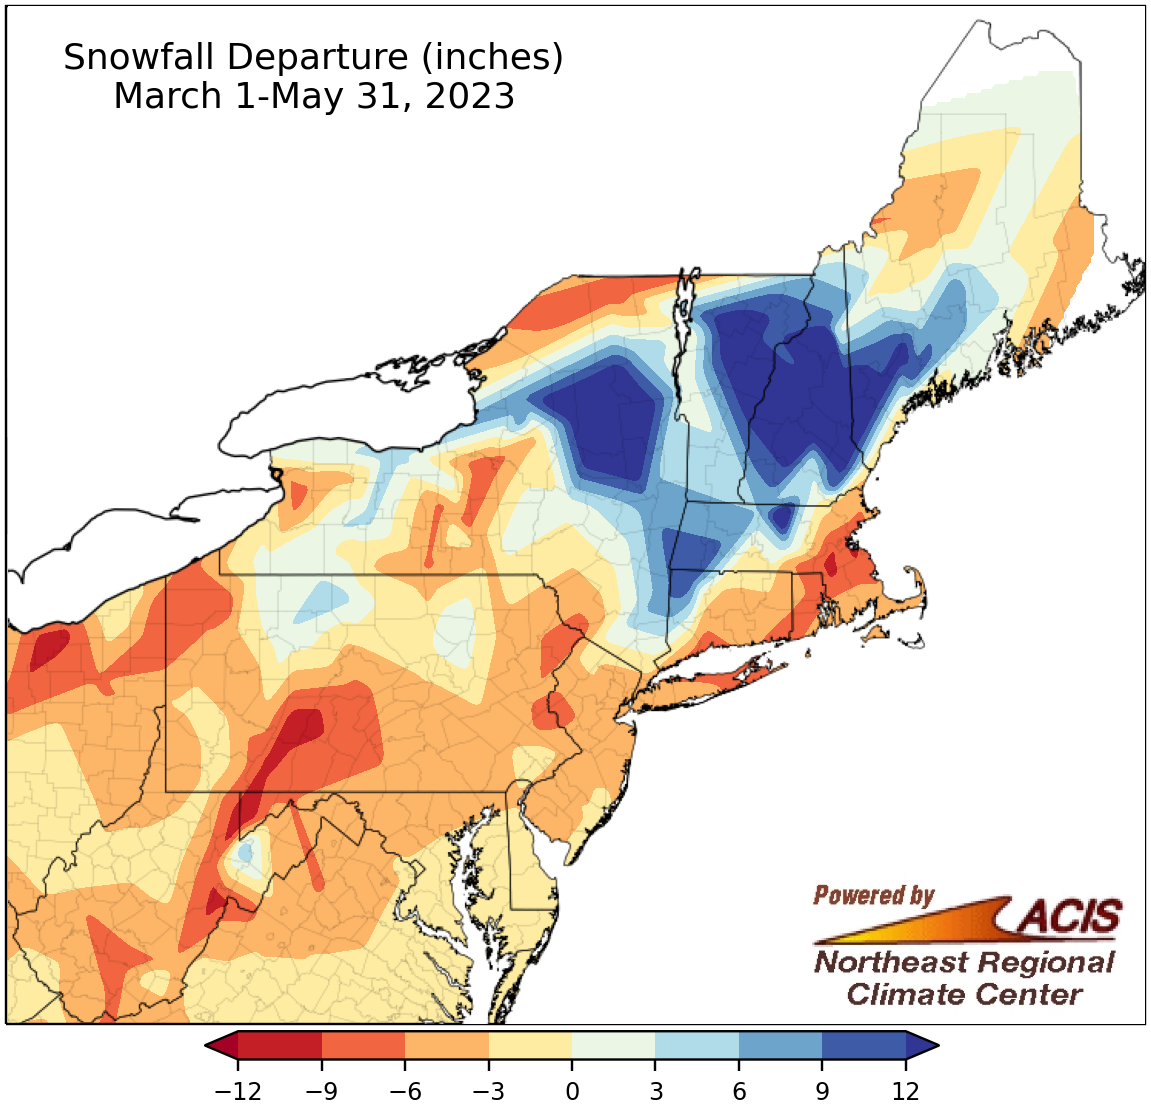
Spring snowfall ranged from 12 inches below normal to more than 12 inches above normal.
The largest storm of spring (and the entire snow season for some areas) occurred in mid-March, pushing spring snowfall totals above normal in portions of New York and New England. The largest spring snowfall surpluses of more than 12 inches were found in eastern/northern New York and interior/northern New England. Outside of these areas, spring snowfall was generally below or near normal, with the largest deficits of 9 to 12 inches in higher elevations of northern West Virginia, western Maryland, and southwestern Pennsylvania, as well as eastern Massachusetts. Spring snowfall at the 35 major climate sites ranged from 9.7 inches below normal in Boston, MA, to 7.3 inches above normal in Albany, NY. Of the 30 sites that saw below-normal snowfall, nine ranked this spring among their 20 least snowy on record.
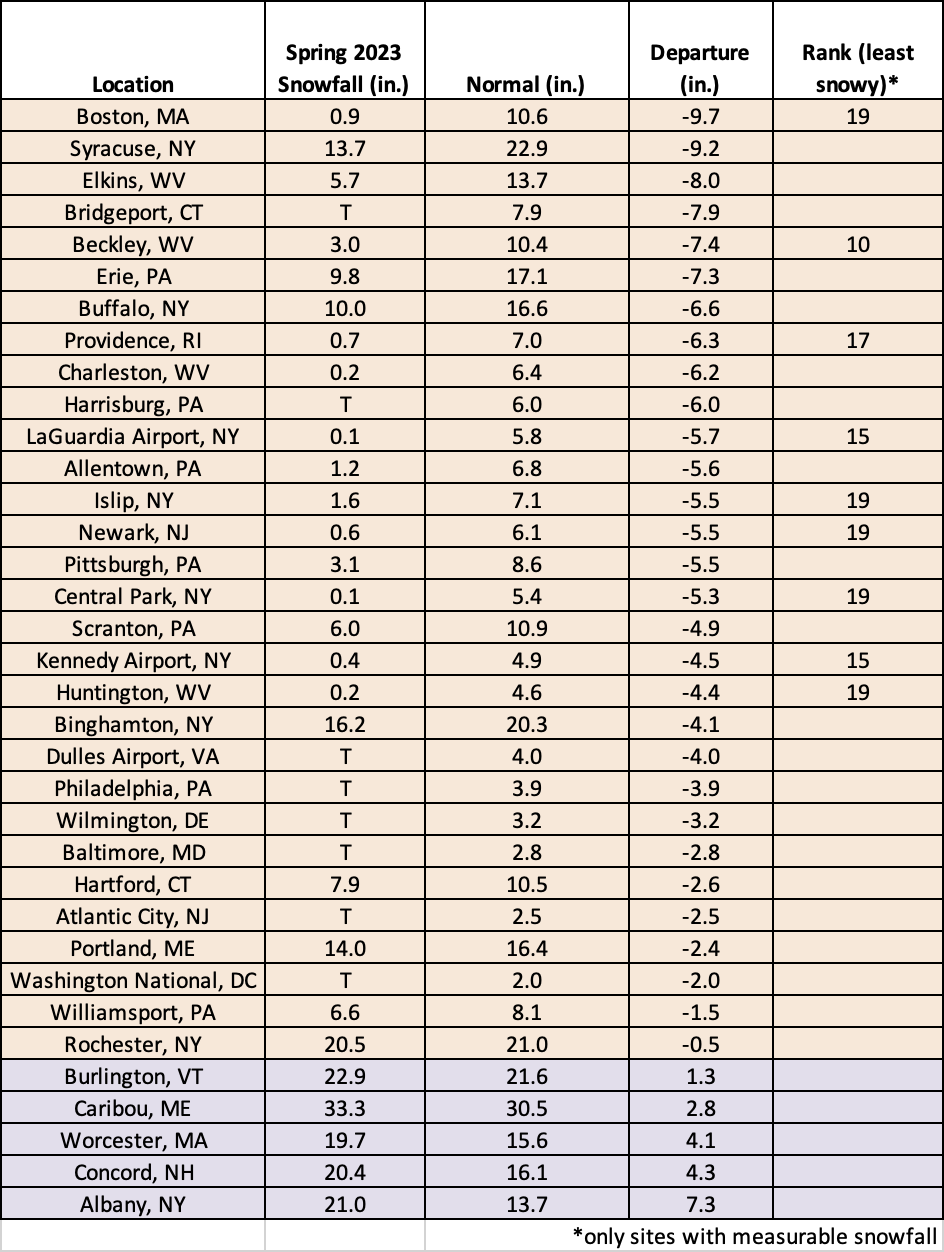
This spring ranked among the 20 least snowy on record for nine major climate sites.
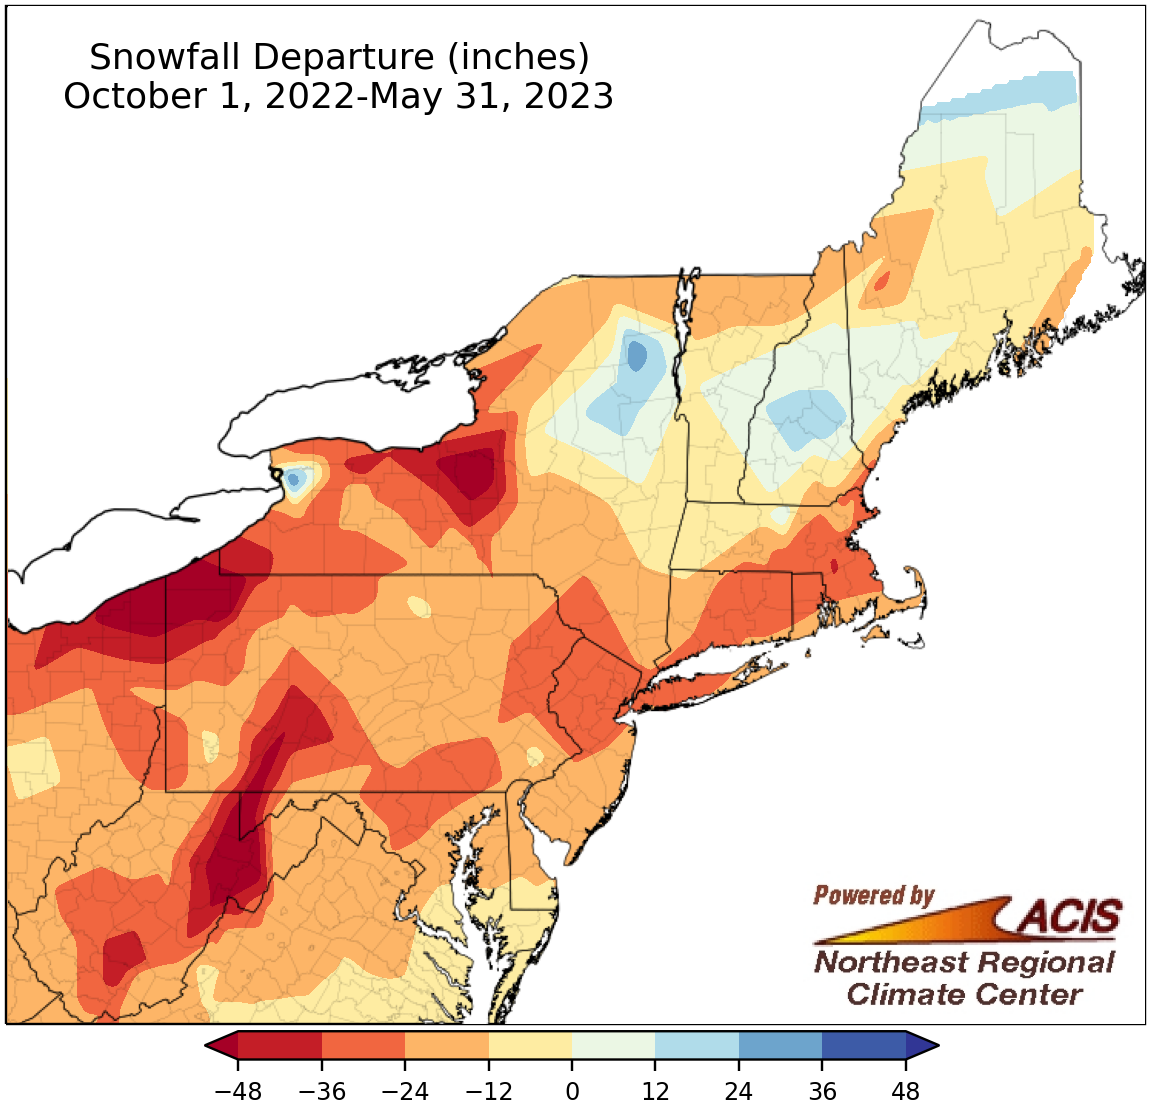
Seasonal (October-May) snowfall ranged from more than 48 inches below normal to 36 inches above normal.
The snow season, which runs from October through May, was noticeably lacking snow, with a majority of the Northeast seeing below or near-normal snowfall. The largest snowfall deficits of more than 48 inches were in central New York, northwestern Pennsylvania, and higher elevations of northern West Virginia, western Maryland, and southwestern Pennsylvania. This snow season was the least snowy on record at six major climate sites - Beckley, WV; Bridgeport, CT; Central Park, NY; Dulles Airport, VA; Baltimore, MD; and Atlantic City, NJ. The season ranked among the 10 least snowy for another 18 major climate sites and among the 20 least snowy for an additional 4 sites, meaning a total of 28 of the 35 sites had one of their 20 least snowy seasons on record.
There were a few notable outliers. Seasonal snowfall surpluses of more than 12 inches were found in northern Maine, areas that saw the heaviest snow during the mid-March nor’easter, and the Buffalo, NY, area which was hit by historic lake-effect snow events in November and December. In fact, this snow season was the fifth snowiest on record for Buffalo, NY, and the 18th snowiest for Caribou, ME. Overall, at the 35 major climate sites, seasonal snowfall ranged from 62.2 inches below normal in Syracuse, NY, to 38.2 inches above normal in Buffalo, NY.
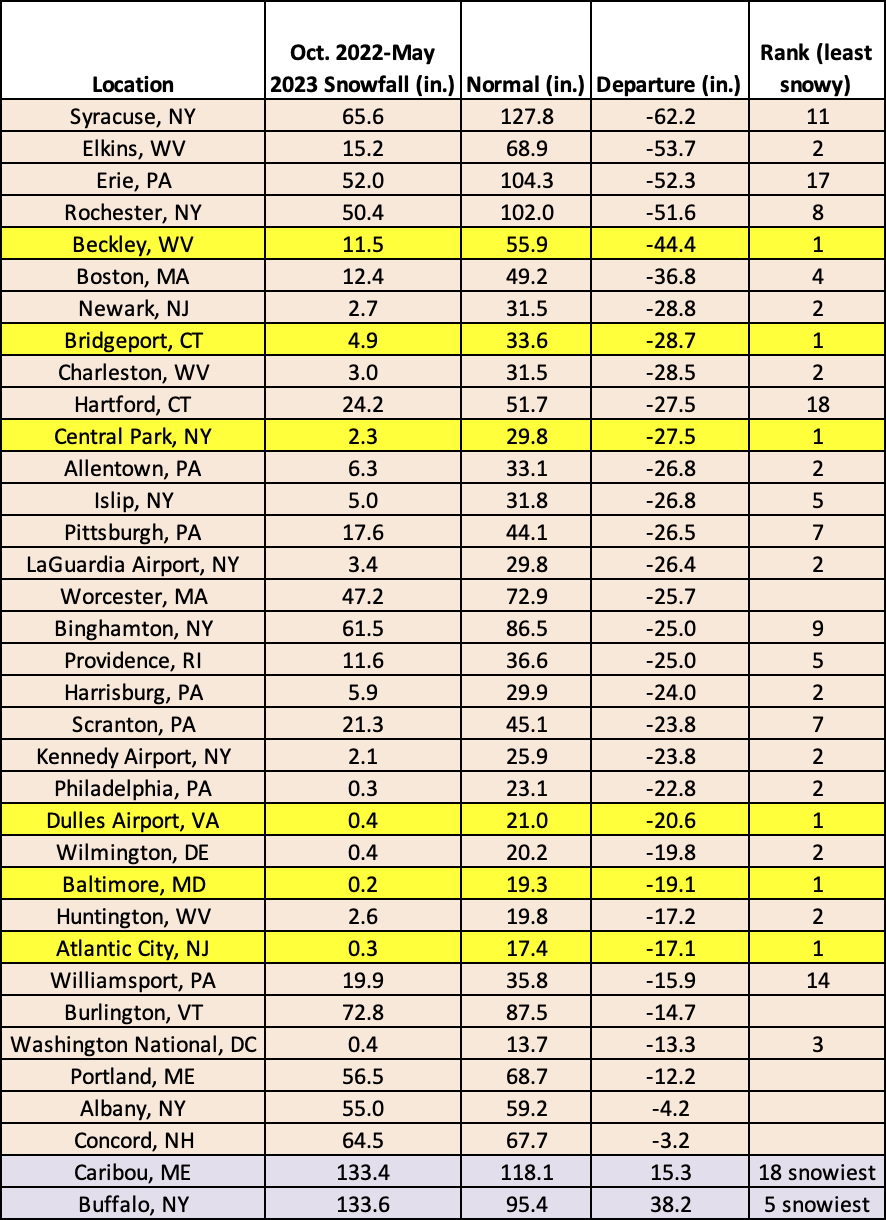
This snow season (October-May) ranked was the least snowy on record for six major climate sites and among the 20 least snowy on record for another 22 of the sites.
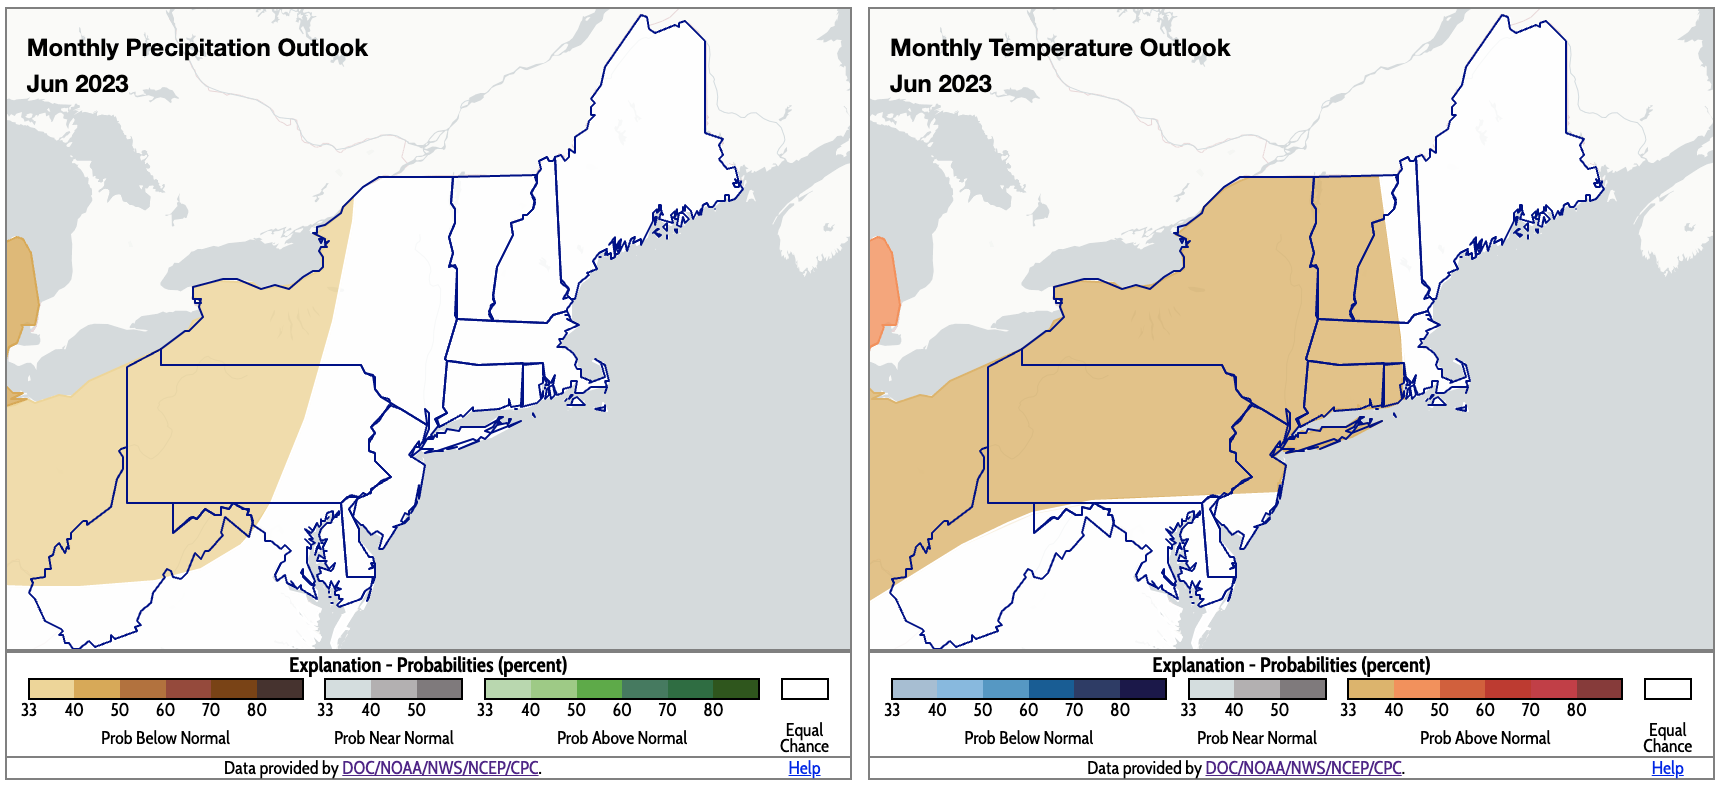
June is expected to be drier than normal for some interior areas (shaded tan - map left) and warmer than normal for multiple parts of the region (shaded orange - map right). Click to enlarge.
For June, NOAA’s Climate Prediction Center (CPC) favors drier-than-normal conditions for some interior Northeast locations including an area stretching from central West Virginia into northern New York. This is driven by expected dry conditions during the first week or so of June. There’s a tilt toward above-normal temperatures for multiple parts of the region including an area spanning from northwestern West Virginia into interior New England. This is based on expected above-normal temperatures during the second half of the month. Equal chances of below-, near-, or above-normal temperatures are forecast for the rest of the region, with New England potentially being cooler at the start of June.
For summer, there’s an increased likelihood of above-normal precipitation for the Mid-Atlantic, parts of New York and Connecticut, and southwestern Massachusetts. Above-normal temperaures are favored for most of the Northeast, particularly coastal areas due to above-normal sea-surface temperatures and decadal climate trends.
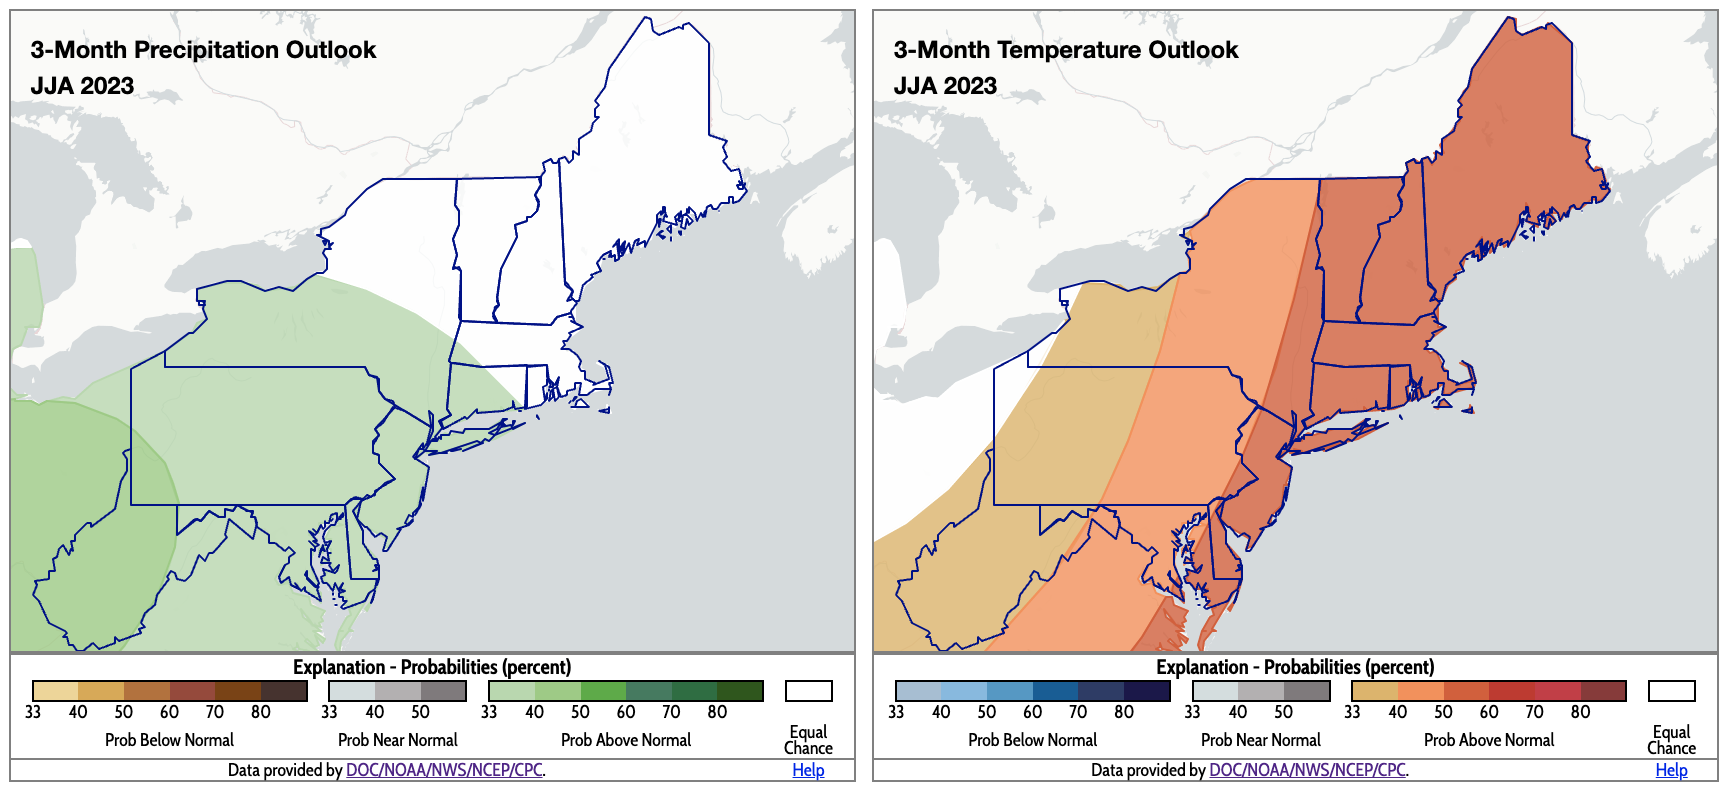
CPC’s summer outlooks indicate a tilt toward above-normal precipitation for multiple areas (shaded green - map left) and above-normal temperature for most of the Northeast (shaded orange - map right). Click to enlarge.