March - All Lion, No Lamb
The month known for “coming in like a lion and going out like a lamb” was pretty much all lion.
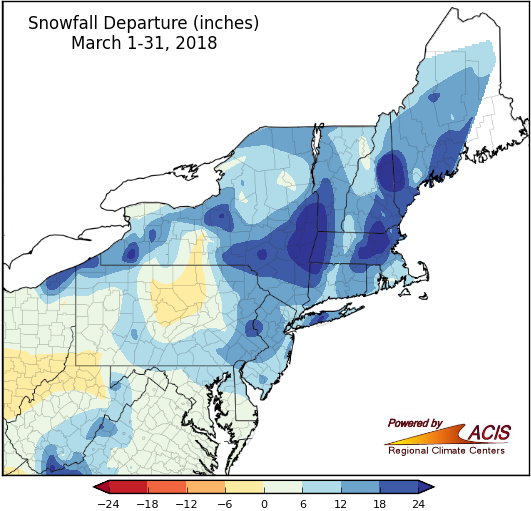
A majority of the region received above-normal snowfall during March, as indicated by the blue colors on the map.
March was snowier-than-normal for almost the entire Northeast. Snowfall ranged from within 6 inches of normal to more than 24 inches above normal, with the greatest departures in parts of eastern New York and New England. Islip, NY, had its snowiest March on record (since 1964), and another 26 major climate sites ranked this March among their 20 snowiest Marches on record. Another interesting point was this March was snowier than February at all but one major climate site. The snowfall surplus was thanks to four nor’easters that moved through the region during the month.
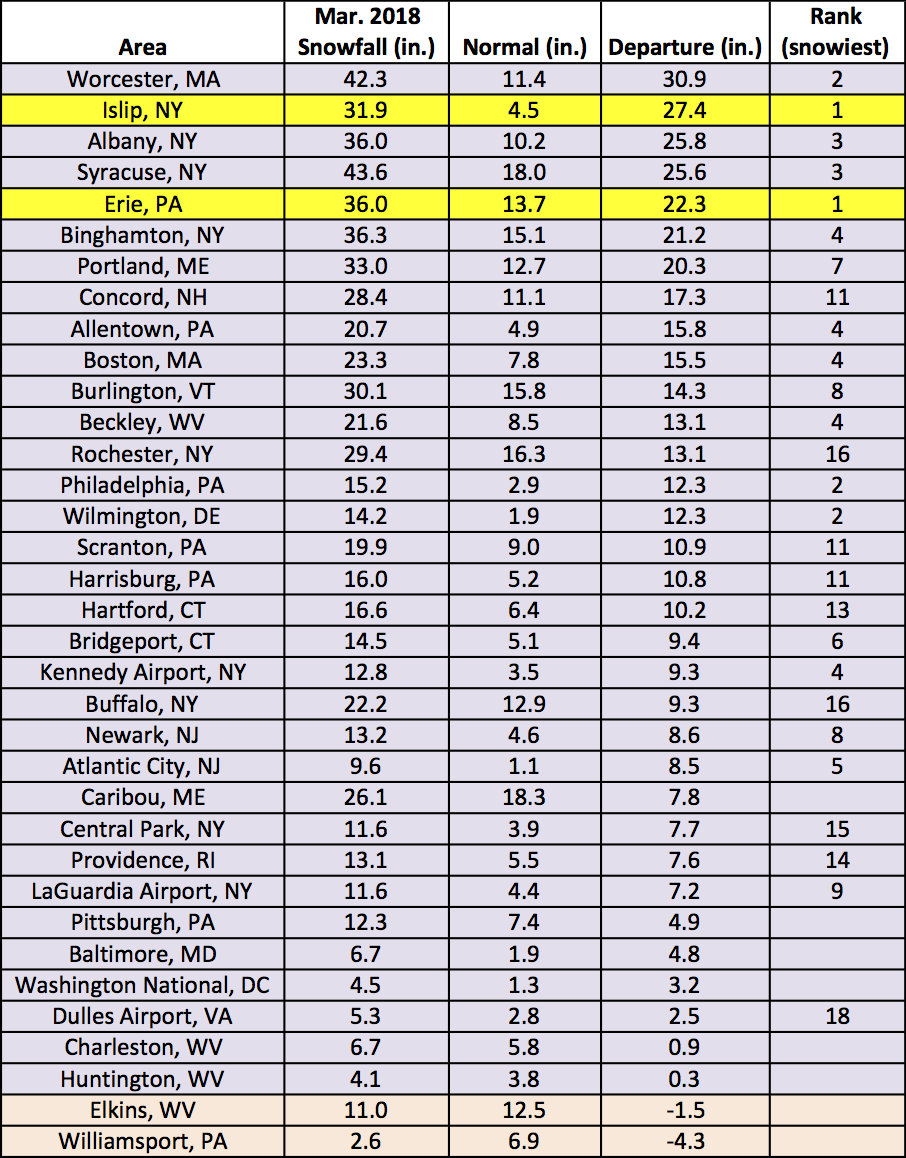
Islip, NY, had its snowiest March on record. All but two major climate sites saw above-normal March snowfall.
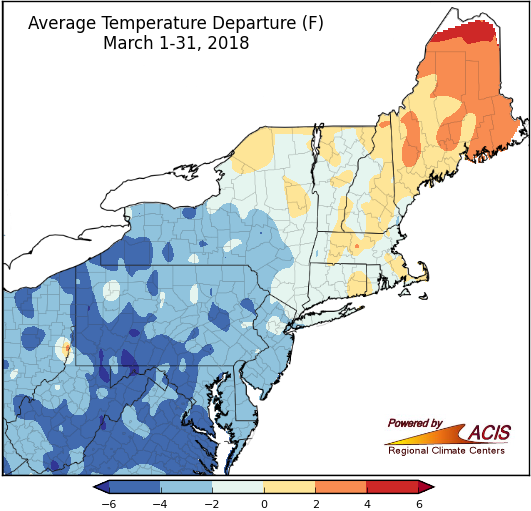
March average temperatures generally ranged from 6°F below normal to 6°F above normal, with most areas on the cold side of normal.
March featured colder-than-normal temperatures for almost all areas outside of New England and northeastern New York. Temperatures were up to 6°F below normal in the coldest areas, parts of West Virginia, Maryland, Pennsylvania, and western New York. At seven of the 30 colder-than-normal major climate sites, this March ranked among the 20 coldest Marches on record. In addition, six sites had their longest streak of consecutive below-normal March days since 1960 - Atlantic City, NJ; Binghamton, NY; Central Park, NY; Dulles Airport, VA; Harrisburg, PA; Philadelphia, PA; and Wilmington, DE. For 26 major climate sites, February was actually warmer than March!
On the other hand, temperatures were up to 6°F above normal in parts of Maine. In fact, Caribou, ME, had its 11th warmest March on record.
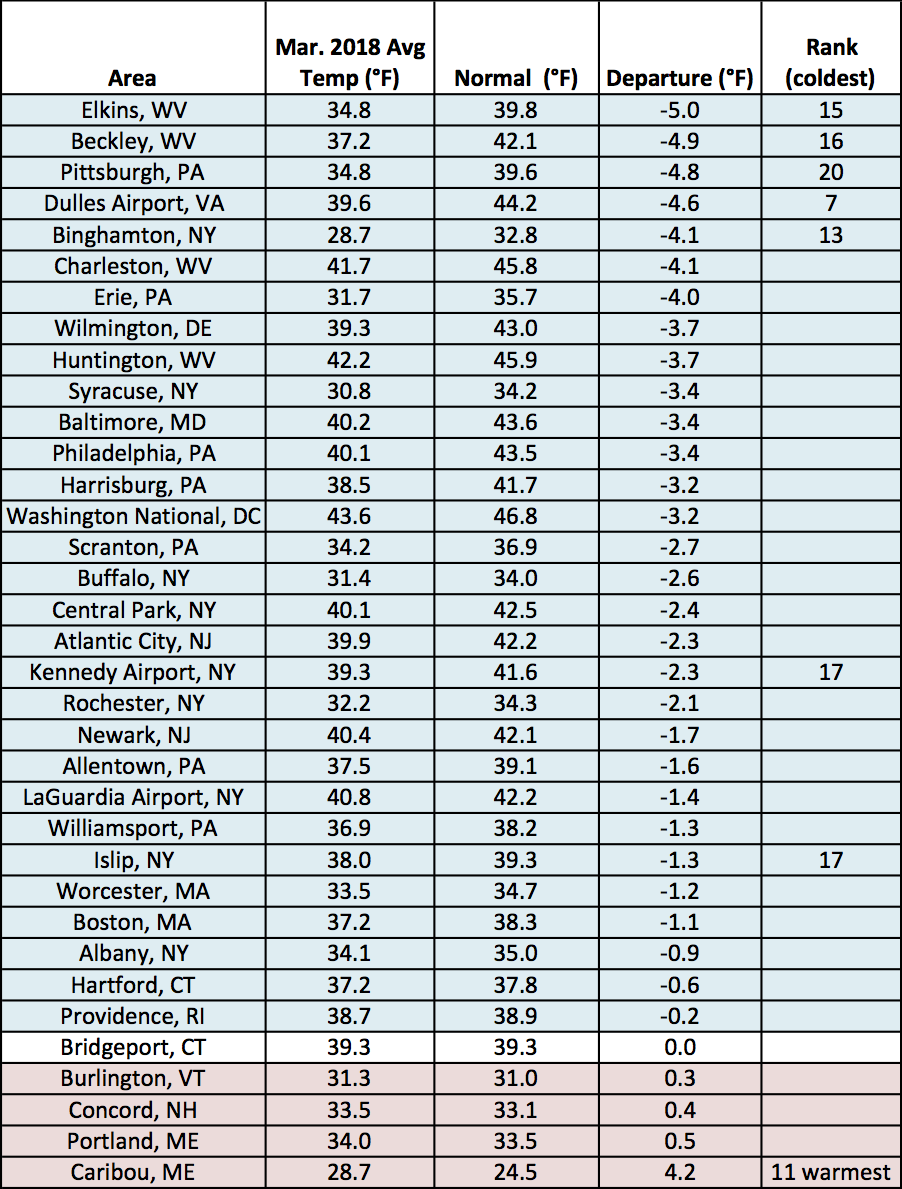
30 major climate sites were colder than normal for March.
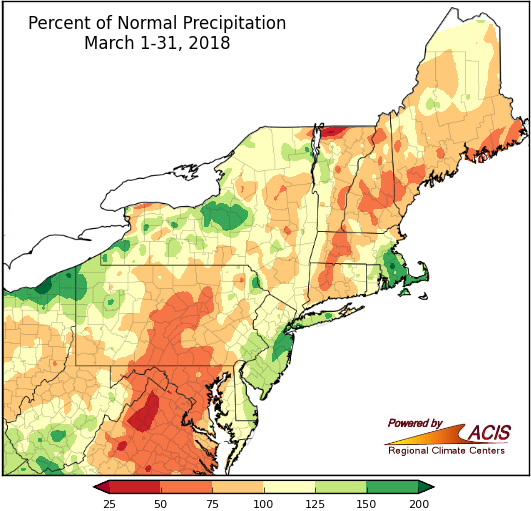
March precipitation ranged from 50% of normal to 200% of normal.
Precipitation was more variable during March, ranging from 50% of normal to 200% of normal. Some of the drier areas, which saw 50% to 75% of normal, included eastern West Virginia, Maryland, central Pennsylvania, and parts of New England. Fourteen major climate sites saw below-normal March precipitation, with two ranking this March among their 20 driest. Abnormal dryness and moderate drought lingered in parts of Maryland during the month.
Some of the wetter areas, which saw 150% to 200% of normal precipitation, were in southern West Virginia, northwestern Pennsylvania, central New York, central New Jersey, and southeastern Massachusetts. Of the 20 wetter-than-normal climates sites, four ranked this March among their 20 wettest.
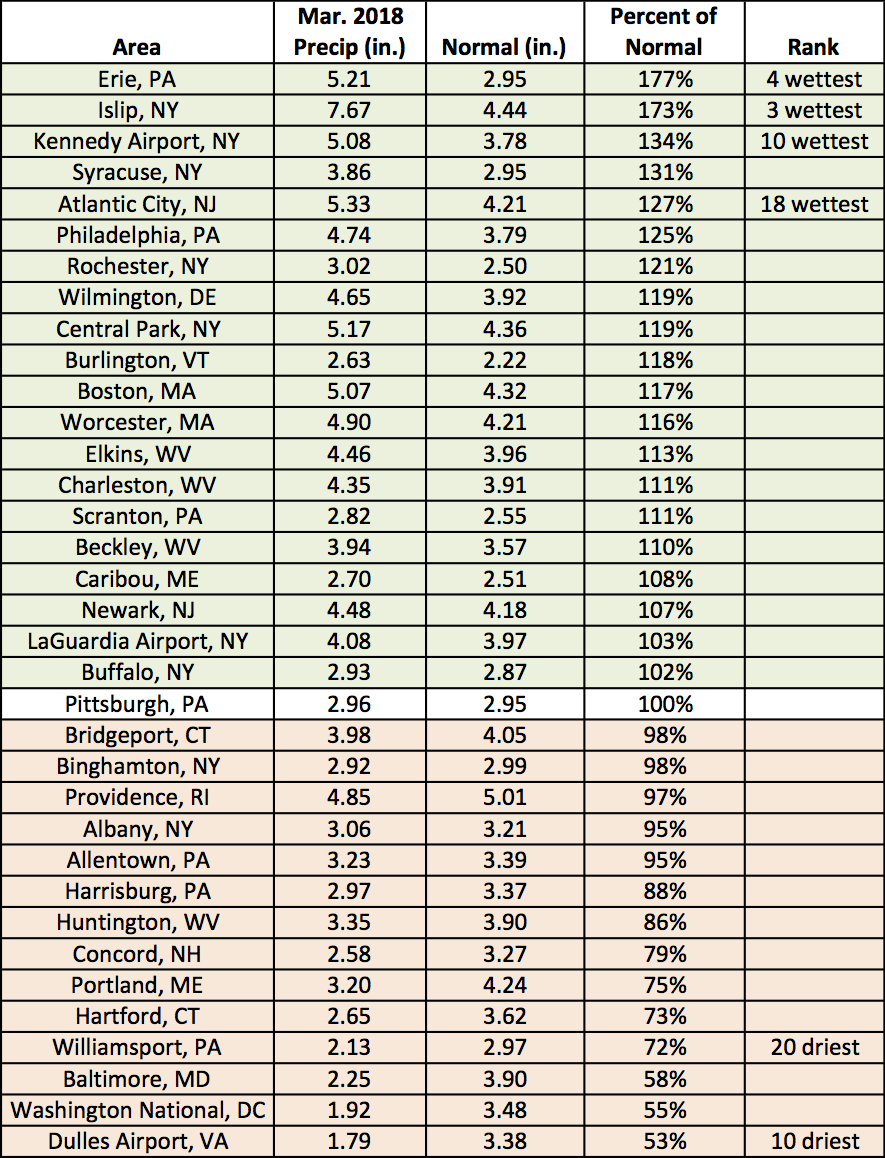
Precipitation at the major climate sites ranged from 53% of normal at Dulles Airport, VA, to 177% of normal in Erie, PA.
It looks like April may bring more of the colder-than-normal conditions we experienced during March. The Climate Prediction Center’s (CPC) April outlook indicates there’s an increased chance of below-normal temperatures for the entire Northeast. In addition, April could be wet as above-normal precipitation is favored for the entire region, according to CPC.
NOAA’s Climate Prediction Center April temperature outlook indicates increased chances of below-normal temperatures for the Northeast.
The April precipitation outlook indicates increased chances of above-normal precipitation for the region.