A Midsummer Recap
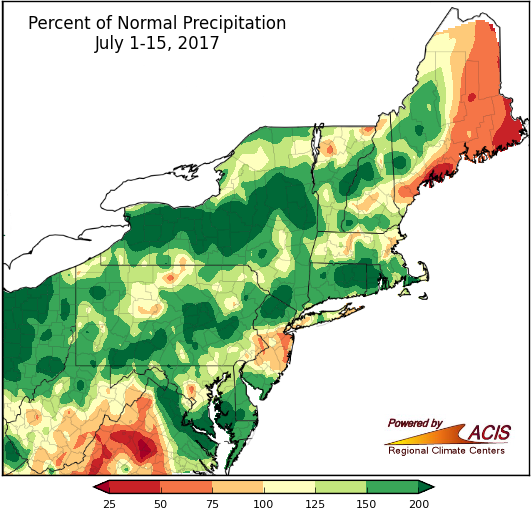
Areas shaded dark green have seen more than double their normal precipitation so far this July.
A large portion of the Northeast was wetter than normal during the first two weeks of July, receiving 100% to more than 200% of normal rainfall. The precipitation frequently fell in quick, heavy bursts, resulting in flash flooding in some areas. Conversely, portions of Maine, central New Jersey, and eastern West Virginia received below-normal rainfall, with parts of coastal Maine seeing less than half their normal precipitation so far this July. Twenty-three of the region’s 35 major climate sites saw above-normal rainfall, with 14 of them ranking this July 1-15 period among their top 20 wettest. However, Portland, ME, had its 10th driest first half of July on record.
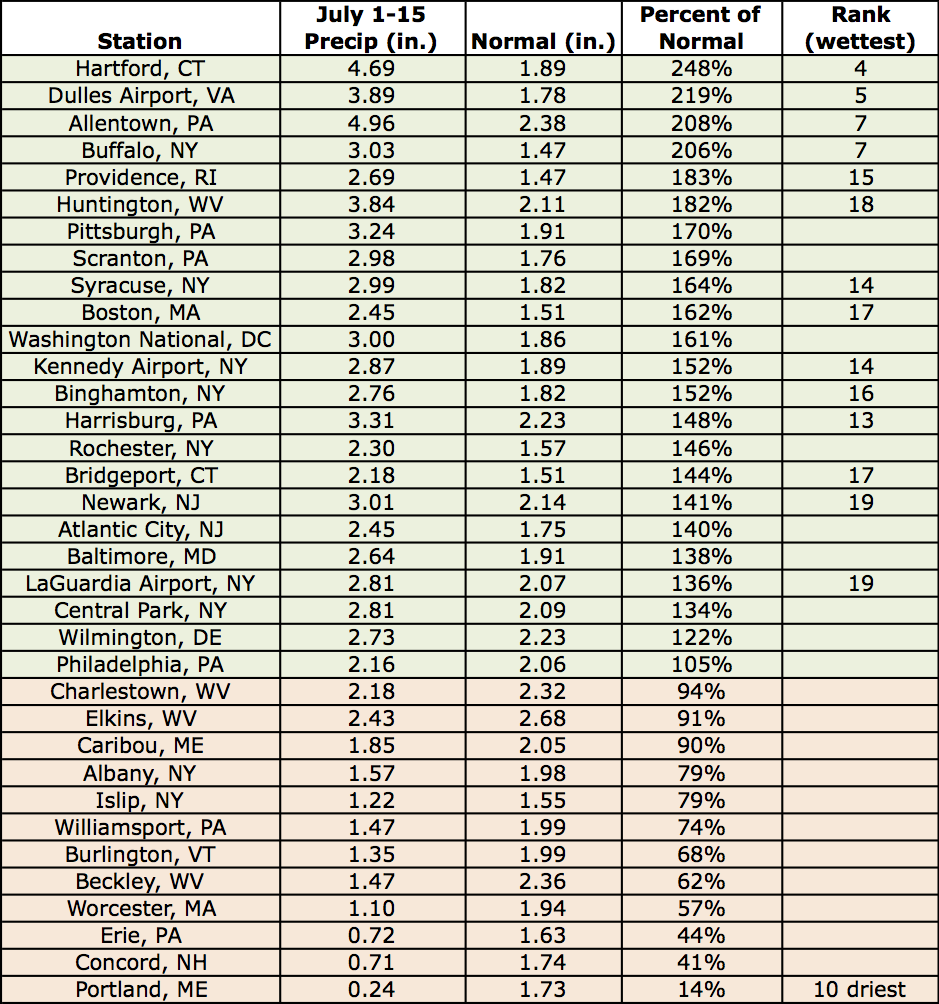
Precipitation so far this July at the major climate sites ranged from 14% of normal in Portland, ME, to 248% of normal in Hartford, CT.
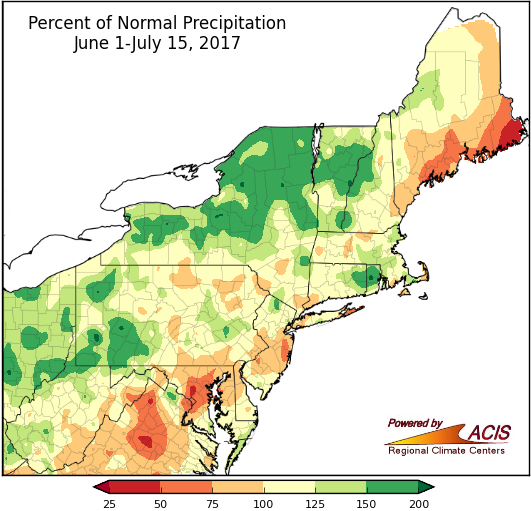
June 1 - July 15 rainfall was above normal for a large portion of the Northeast.
During the first half of summer (June 1- July 15), precipitation ranged from 25% to 200% of normal, with much of the region on the wet side of normal. The driest areas were in coastal Maine and central Maryland, while the wettest areas were generally in western Pennsylvania, upstate New York, central Vermont, and northern Rhode Island. Ten of the 25 wetter-than-normal major climate sites ranked this first half of summer among their top 20 wettest.
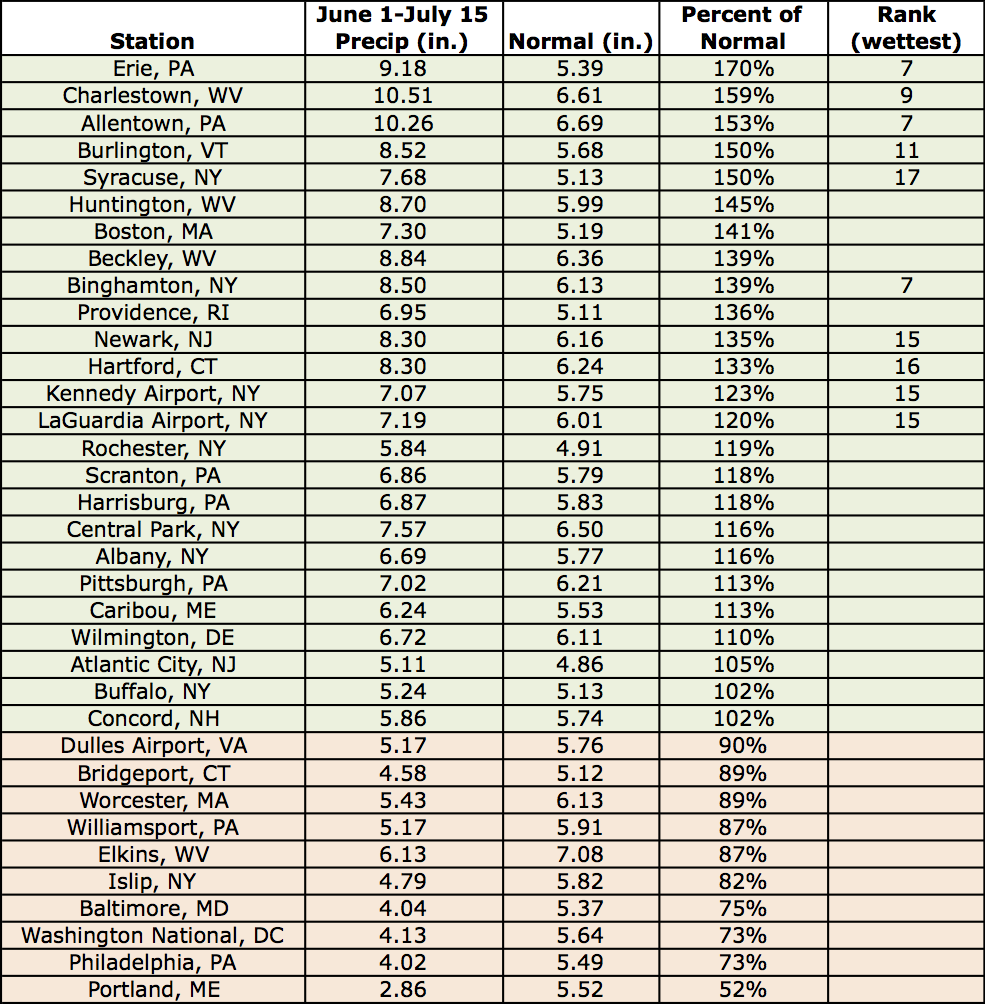
June 1 - July 15 precipitation at the major climate sites ranged from 52% of normal in Portland, ME, to 170% of normal in Erie, PA.
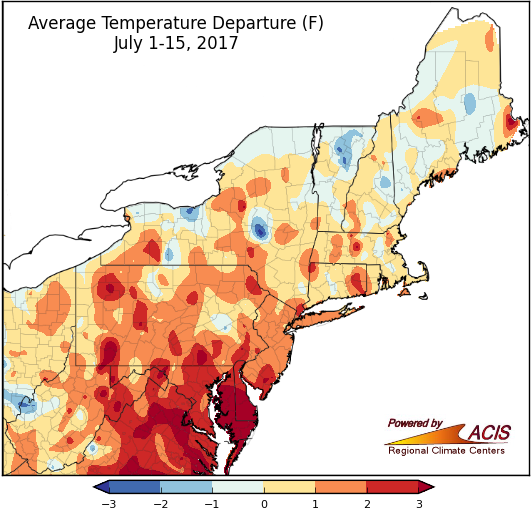
For much of the Northeast, the first two weeks of July were up to 3°F above normal.
During the first half of July, average temperatures ranged from 2°F below normal to more than 3°F above normal. Most areas were warmer than normal, with the warmest areas of more than 3°F above normal in eastern Maryland and southern Delaware. Twenty-nine of the region’s 35 major climate sites experienced above-normal temperatures, with nine of those sites ranking this first half of July among their top 20 warmest.
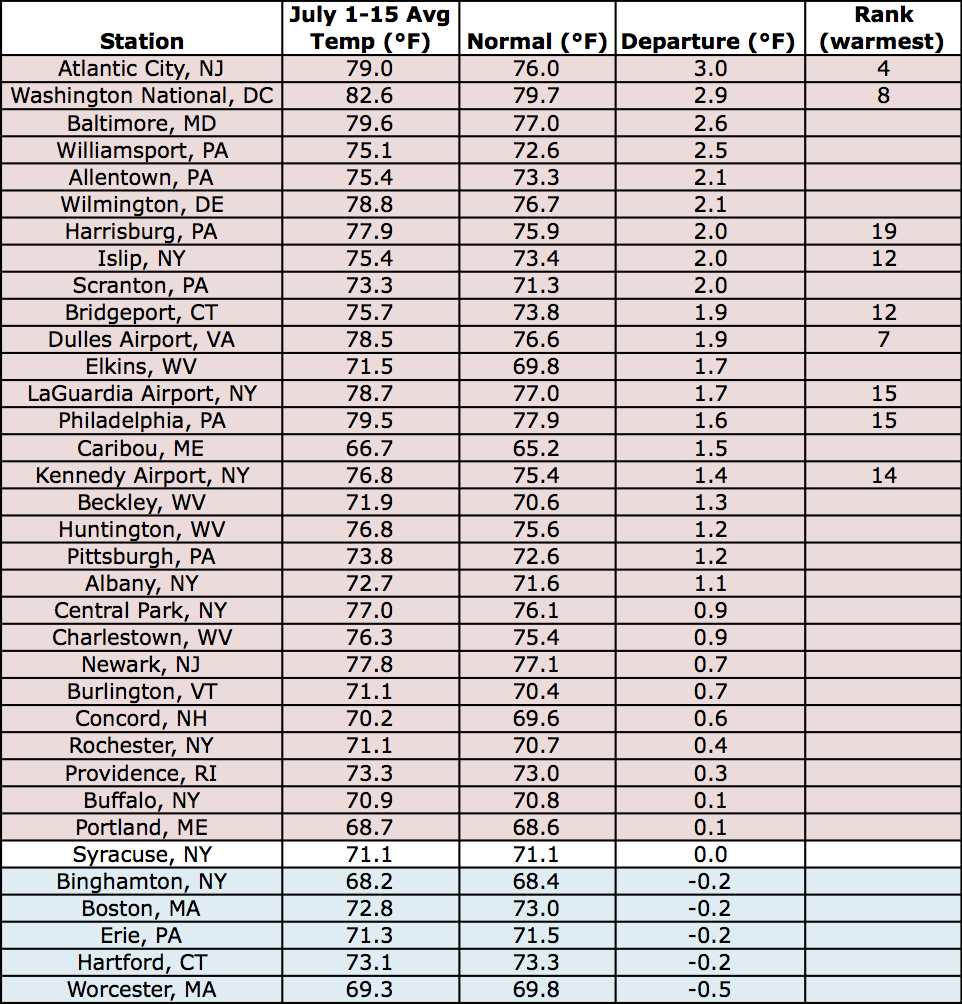
Average temperatures so far this July at the major climate sites ranged from 0.5°F below normal in Worcester, MA, to 3.0°F above normal in Atlantic City, NJ.
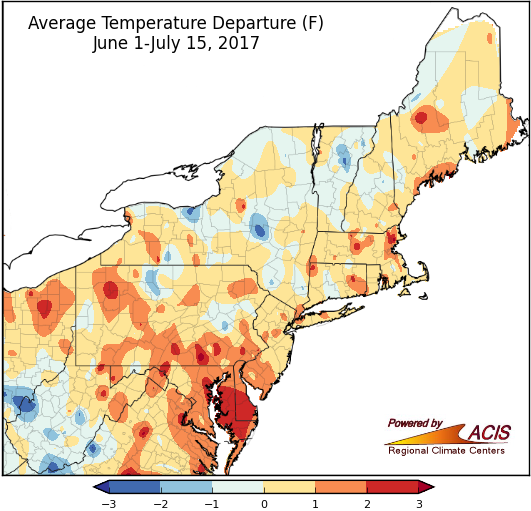
For many areas, average temperatures from June 1 - July 15 ranged from 1°F below normal to 2°F above normal.
Average temperatures during the first half of summer were above normal for a large portion of the region, but overall ranged from 2°F below normal in portions of West Virginia and New York to 3°F above normal in eastern Maryland and southern Delaware. Eleven of the 32 warmer-than-normal major climate sites ranked this first half of summer among their top 20 warmest.
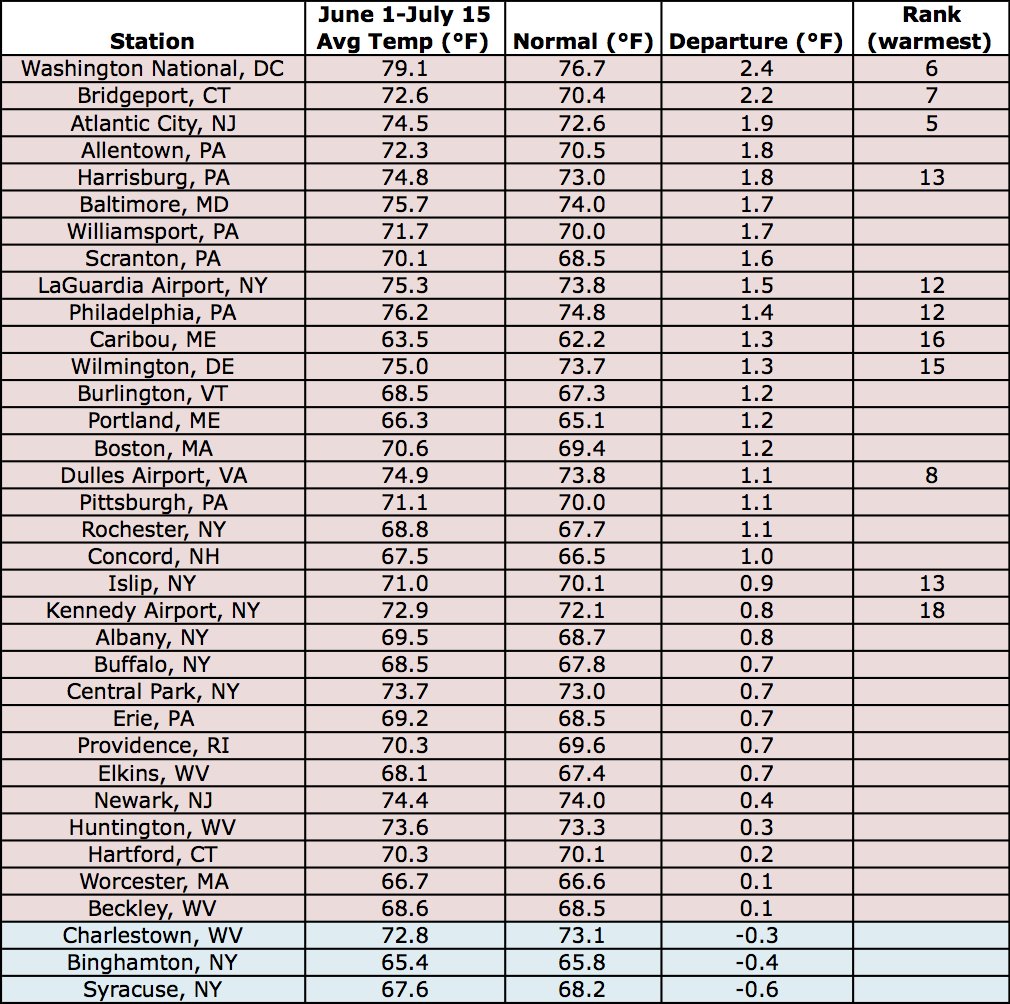
At the major climate sites, June 1 - July 15 average temperatures ranged from 0.6°F below normal in Syracuse, NY, to 2.4°F above normal at Washington National, DC.