What is Long-Term Drought?
A drought is typically considered long-term after a duration of six months. As short-term drought turns to long-term drought and seasons change, impacts shift as well. Long-term precipitation totals are considered, and well and reservoir levels are a concern. A few precipitation events may prevent conditions from deteriorating, but may not be enough to alleviate long-term deficits.
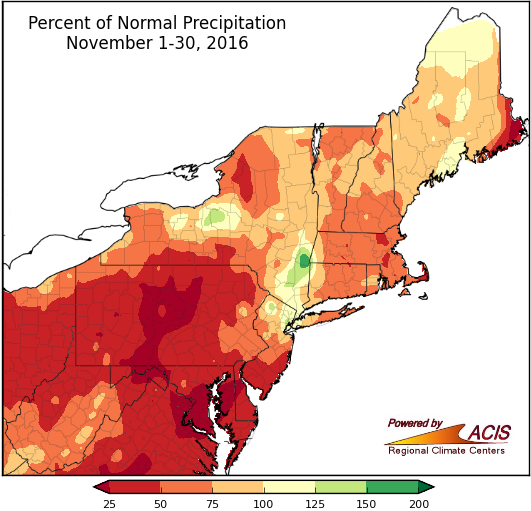
November featured below-normal precipitation for much of the region.
Despite a few rain events, a majority of the region had below normal precipitation for November.
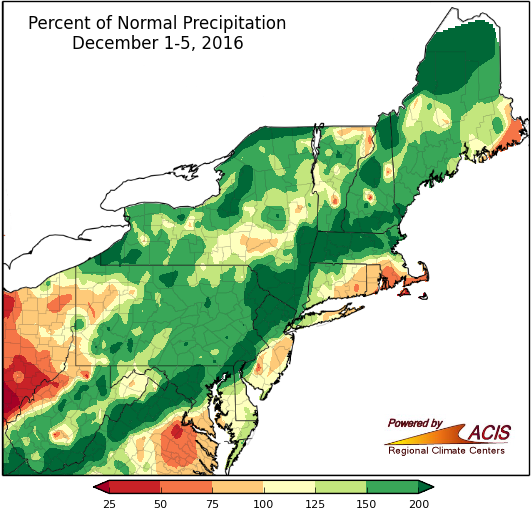
A look at December precipitation.
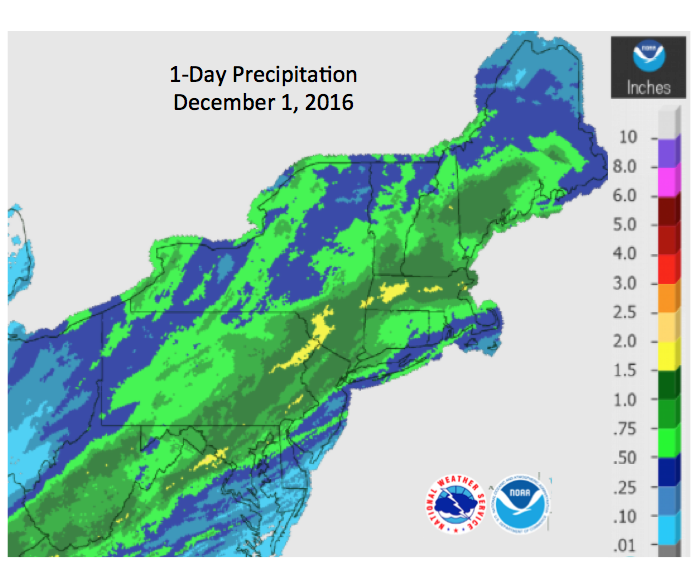
December-to-date precipitation looks like an improvement, with large areas of well above-normal precipitation. Most of that precipitation actually fell at the very end of November – just after observations were taken and therefore included in December’s totals. Regardless of which month received the precipitation, long-term precipitation deficits remain for many areas.


90 Day and 6 Month SPI


12 Month and 24 Month SPI
The Standardized Precipitation Index (SPI) is negative for dry conditions and positive for wet conditions. The SPI uses historical station data to calculate the probability of a precipitation event. The index value directly corresponds to the standard deviation based on the historical data and can be directly related to U.S. Drought Monitor categories. A larger negative value indicates drier conditions. You can see in the map progression, from 90 day to 24 months, that the longer time periods show increasing dry conditions.
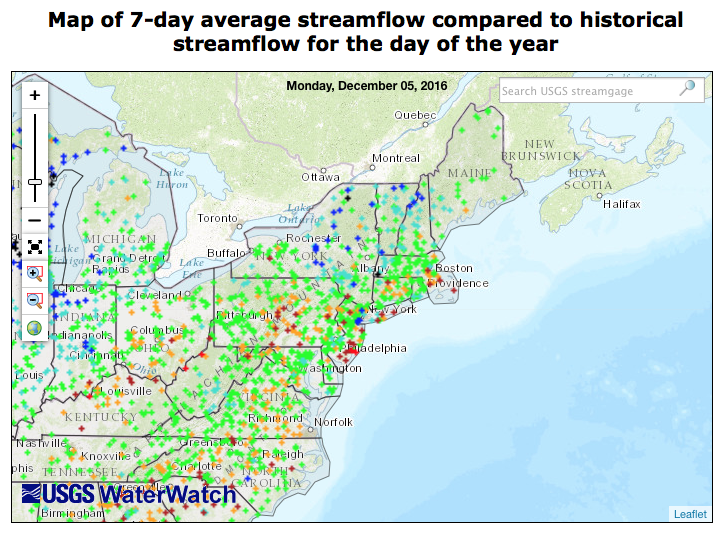
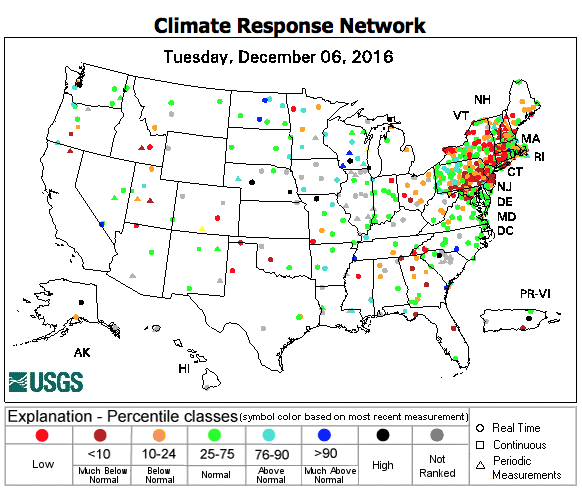
7-day average streamflow compared to historical streamflow from USGS WaterWatch (left). A network of wells to monitor the effects of droughts & other climate variability on groundwater levels. USGS Groundwater Watch (right)
Recent rains have resulted in streamflow increases to near-normal (green dots) or above-normal (blue dots) in many locations. Some of these increases will only be a temporary response to short-term precipitation and could decline quickly. The map on the right shows low well levels (red dots) that are indicative of a long-term drought.