Severe Weather Climatology
Severe weather can happen any time of the day or year, but in the Northeast, the historical probability of severe weather (tornado, hail, or thunderstorm wind) increases from late March through late September, with a peak in June and July.
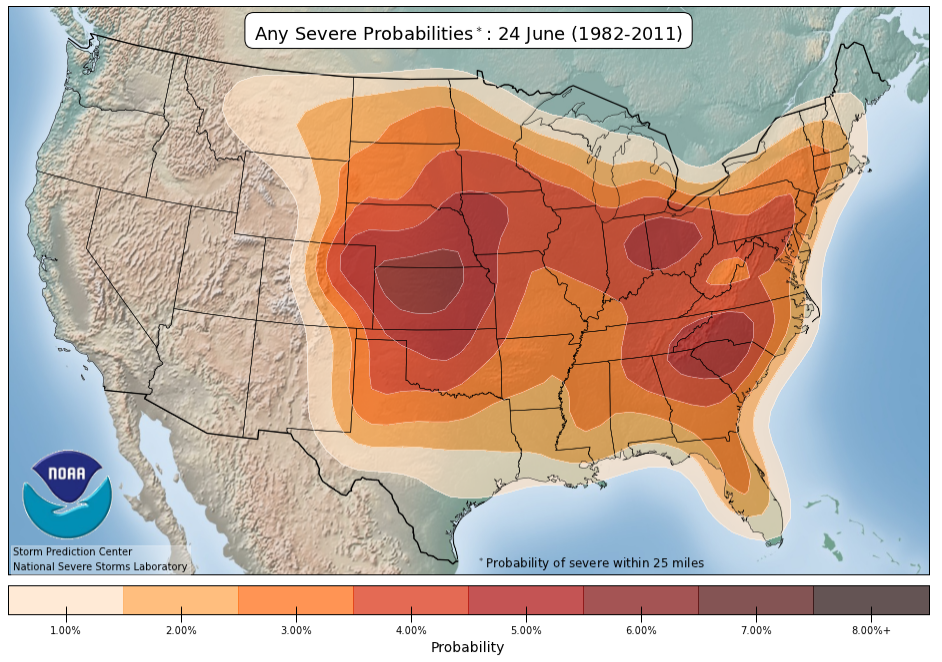
Historical probability of severe weather within 25 miles near June 24. Click to enlarge.
At least one tornado has touched down in the Northeast every year since 1952. The average annual number of tornadoes for the region is 46 (based on 1985-2014). The region averages at least one tornado per month from April through November, with the greatest number (13) in July. However, tornadoes have occurred during the winter months.
EF0 and EF1 tornadoes are the most common, but the region has experienced tornadoes of every strength. The only F5 tornado on record (since 1950) was in western Pennsylvania during the major outbreak on May 31, 1985.
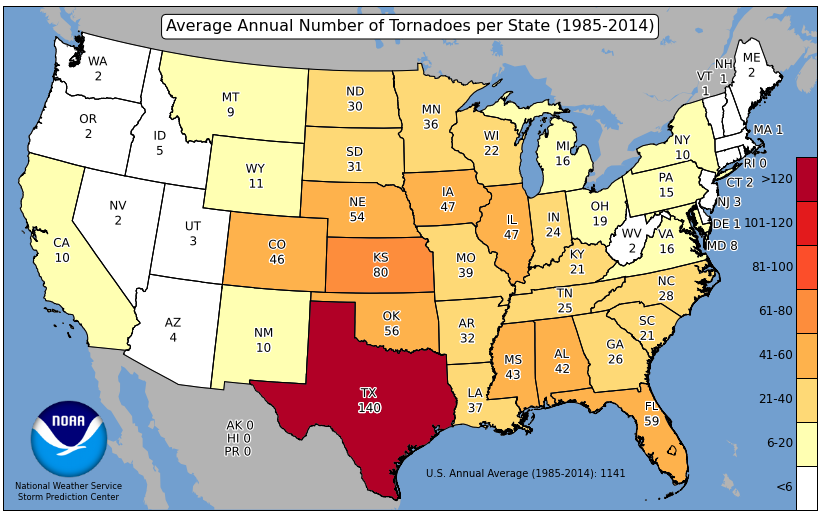
Pennsylvania averages the most tornadoes annually (in the region) with 15. Click to enlarge.
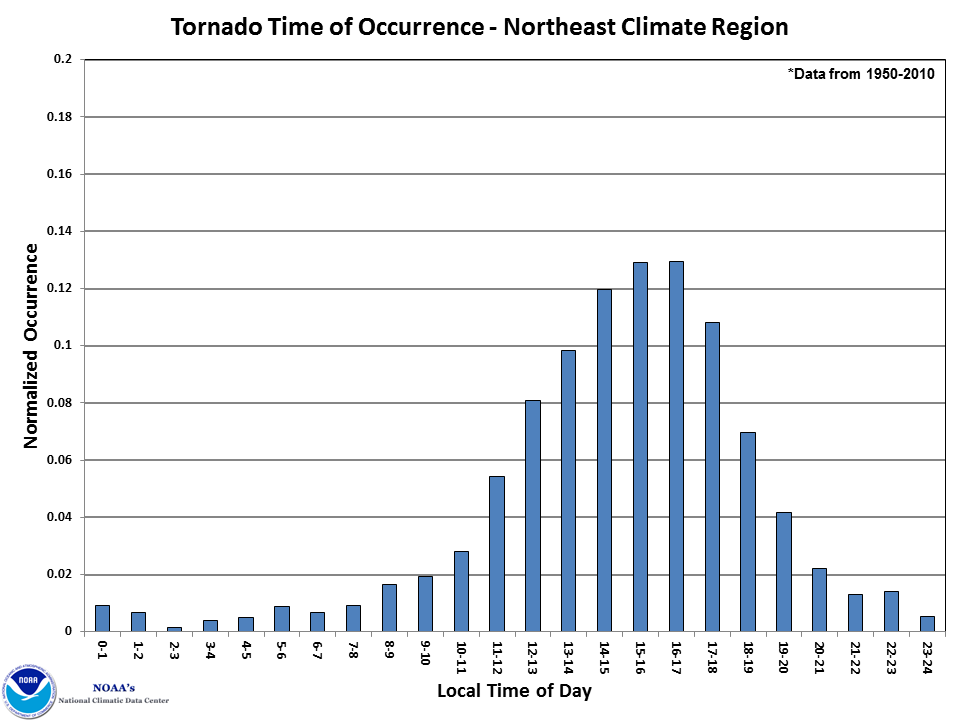
In the Northeast, tornadoes most frequently occur during the afternoon and evening hours. Click to enlarge.
Thunderstorms can also produce straight line winds, which can be as strong and damaging as some tornadoes. The National Centers for Environmental Information (NCEI) storm database shows that the strongest straight line winds reported in the Northeast were around 150 mph.
Large hail doesn’t occur as frequently in the Northeast as in other parts of the country. However, the largest hailstones in the region have ranged from 2.5" (tennis ball) to 4.5" (softball).
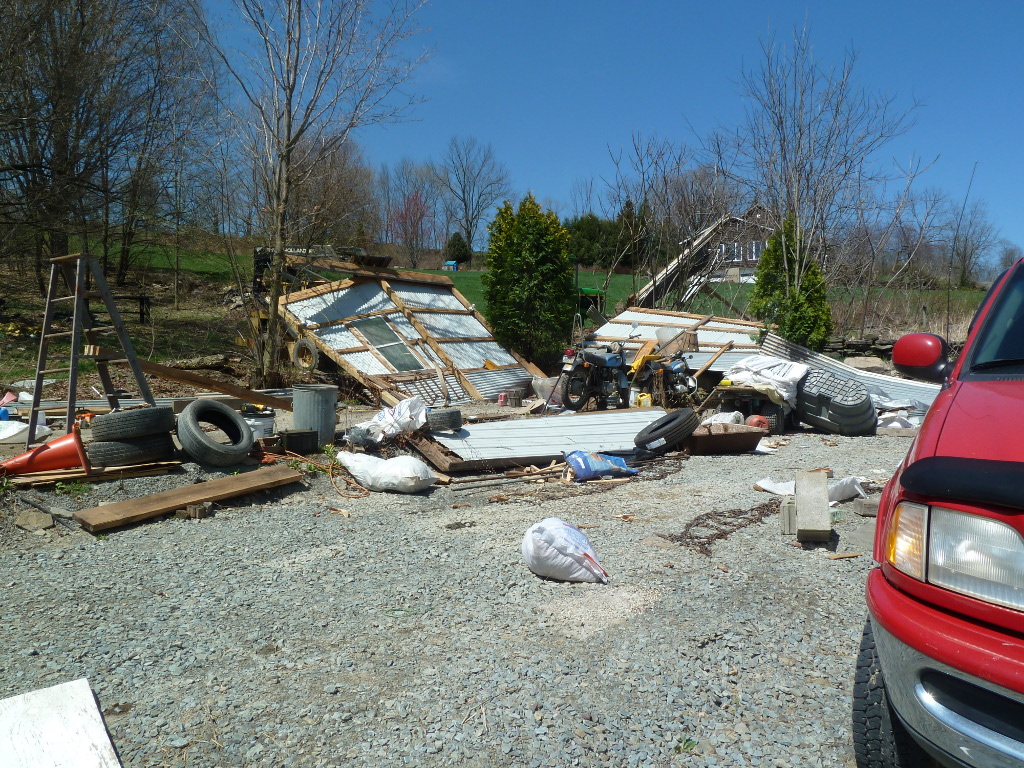
Straight line winds of up to 110 mph destroyed this outbuilding. Photo from NWS Binghamton.
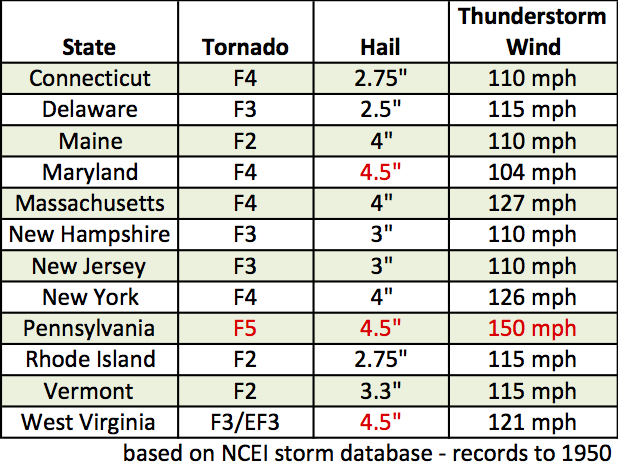
The table lists each state’s strongest tornado, largest hail, and highest thunderstorm wind speed. The red text denotes the region’s most extreme.
Another hazard of thunderstorms is flash floods. In the Binghamton, NY National Weather Service (NWS) forecast area, nearly half of all the flash floods from 1986-2015 occurred during the summer months. The Pittsburgh, PA NWS forecast area averaged around 69 flash flood reports per year from 1986-2015. The peak time for flash floods in both areas was in the afternoon and evening.
Visit the Storm Prediction Center website for severe weather outlooks, watches, and reports. For your local forecast and current watches/warnings, visit the NWS website.
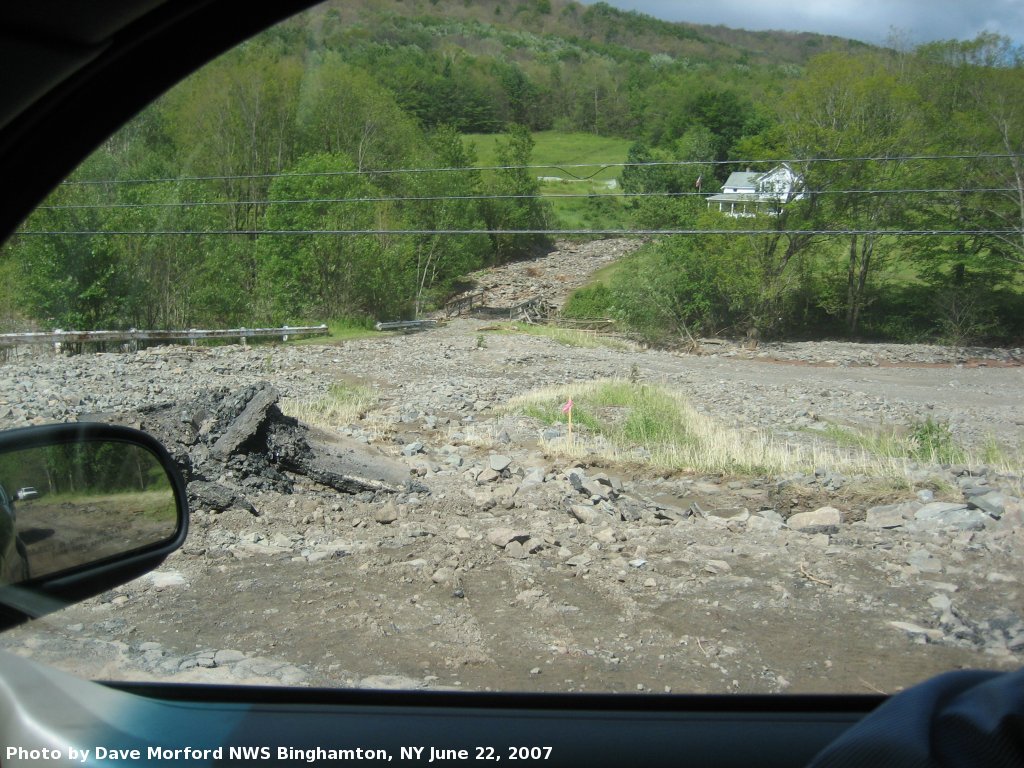
A private road and bridge were washed out by a flash flood. Photo from NWS Binghamton.