What is a Snow Survey and Who Uses It?
So far this January, the region has experienced alternating periods of cold, snowy weather and warm, wet weather. The rain and warmth have caused snow to melt and ice to move on area waterways, leading to an increased threat of flooding.
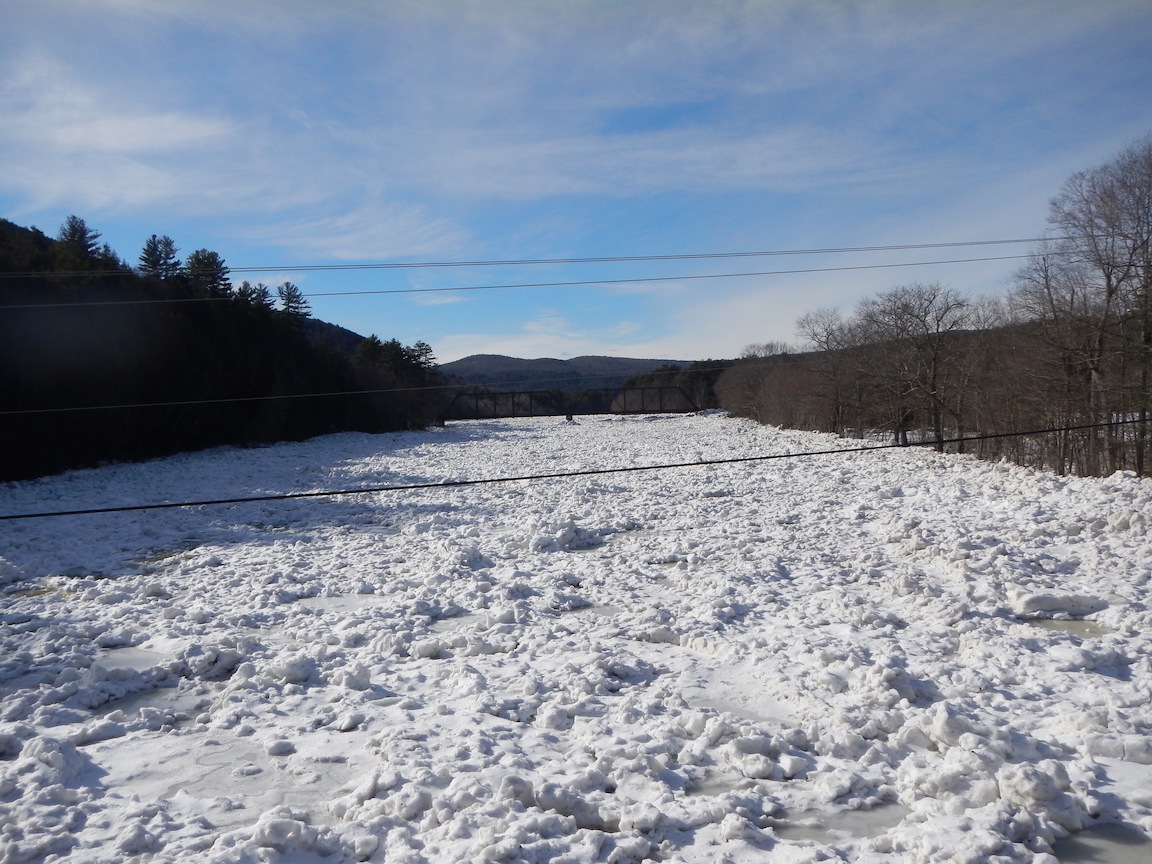
Ice jam in Warrensburg, NY, on January 24. Photo by Vince Spadaro.
Every year, the Northeast Regional Climate Center compiles snow depth and water content (snow water equivalent or SWE) data taken by volunteers at a set of fixed locations around New York. This snow survey, which is done every two weeks, is a valuable tool used by forecasters and water resource managers to monitor the potential for flooding. Maps from recent snow surveys, as well as an archive of past snow surveys, can be found here - http://www.nrcc.cornell.edu/regional/snowsurvey/snowsurvey.html. The next NRCC snow survey is next week (January 29-31). The snow survey runs through late April.
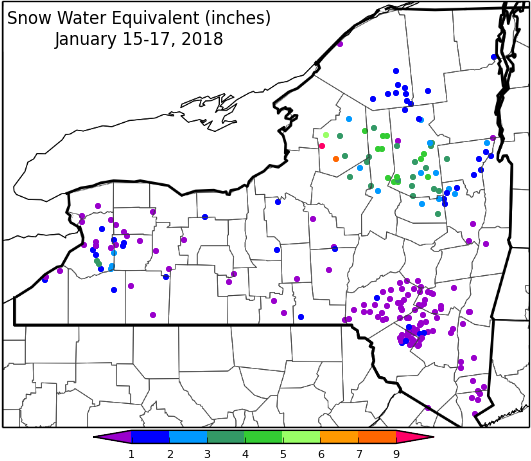
The water content of snow on the ground as of January 15-17 ranged from less than 1 inch in the Catskills to more than 9 inches east of Lake Ontario. Map by the Northeast Regional Climate Center.
The NRCC isn’t the only group that coordinates a snow survey. There’s the Maine Cooperative Snow Survey, with the data used by National Weather Service and emergency managers within the state. New Hampshire’s Department of Environmental Services also has a snow survey, which is performed every two weeks.
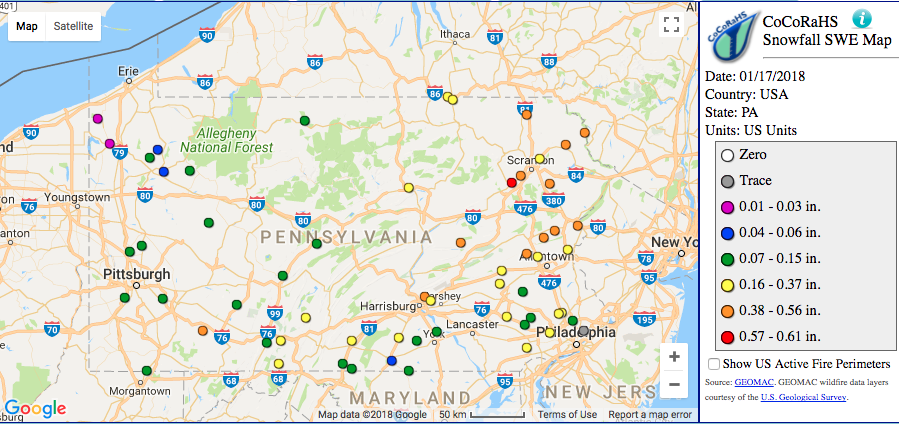
A CoCoRaHS map of snow water equivalent in Pennsylvania from January 17. Click to enlarge.
CoCoRaHS (Community Collaborative Rain, Hail, and Snow network) encourages its volunteers to measure snow depth and water content daily if possible, and if not, at least once a week on Snow Water Equivalent (SWE) Mondays. CoCoRaHS data are utilized every day by NOAA’s National Operational Hydrologic Remote Sensing Center (NOHRSC) to improve their snow products and computer models, which in turn helps improve flood forecasts. NOHRSC also performs aerial snow water equivalent measurements and river ice surveys, with a recent survey done in the Northeast. The NOHRSC data are used by the National Weather Service and River Forecast Centers to issue forecasts and outlooks.
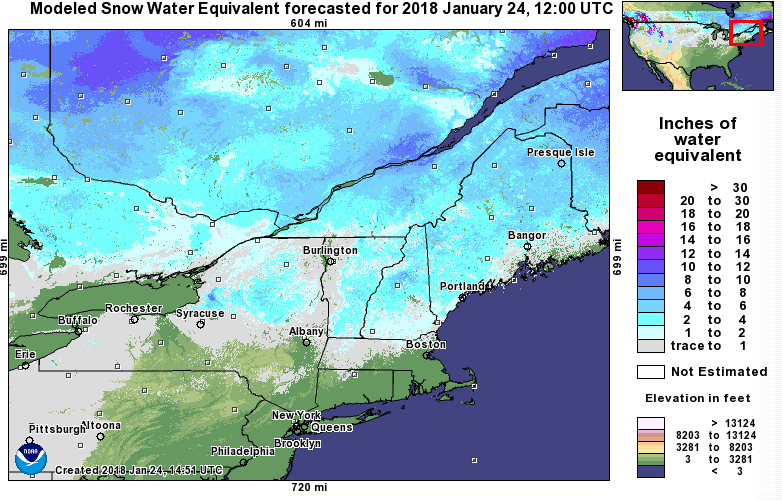
A map of modeled snow water equivalent at 8 AM on January 24 by NOAA’s NOHRSC. Click to enlarge.
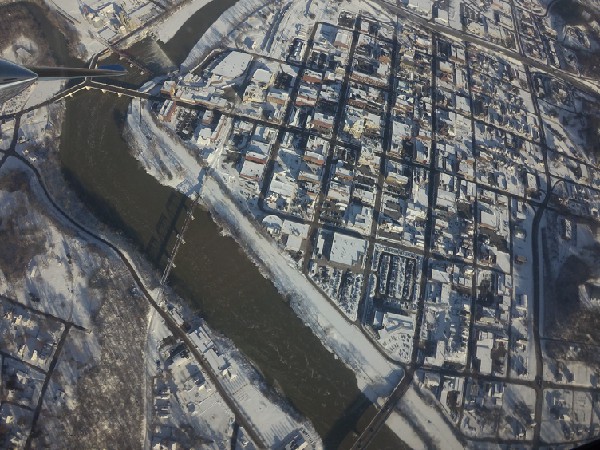
A photo from an aerial river ice survey done by NOAA’s NOHRSC.