Mid-February - In The Red
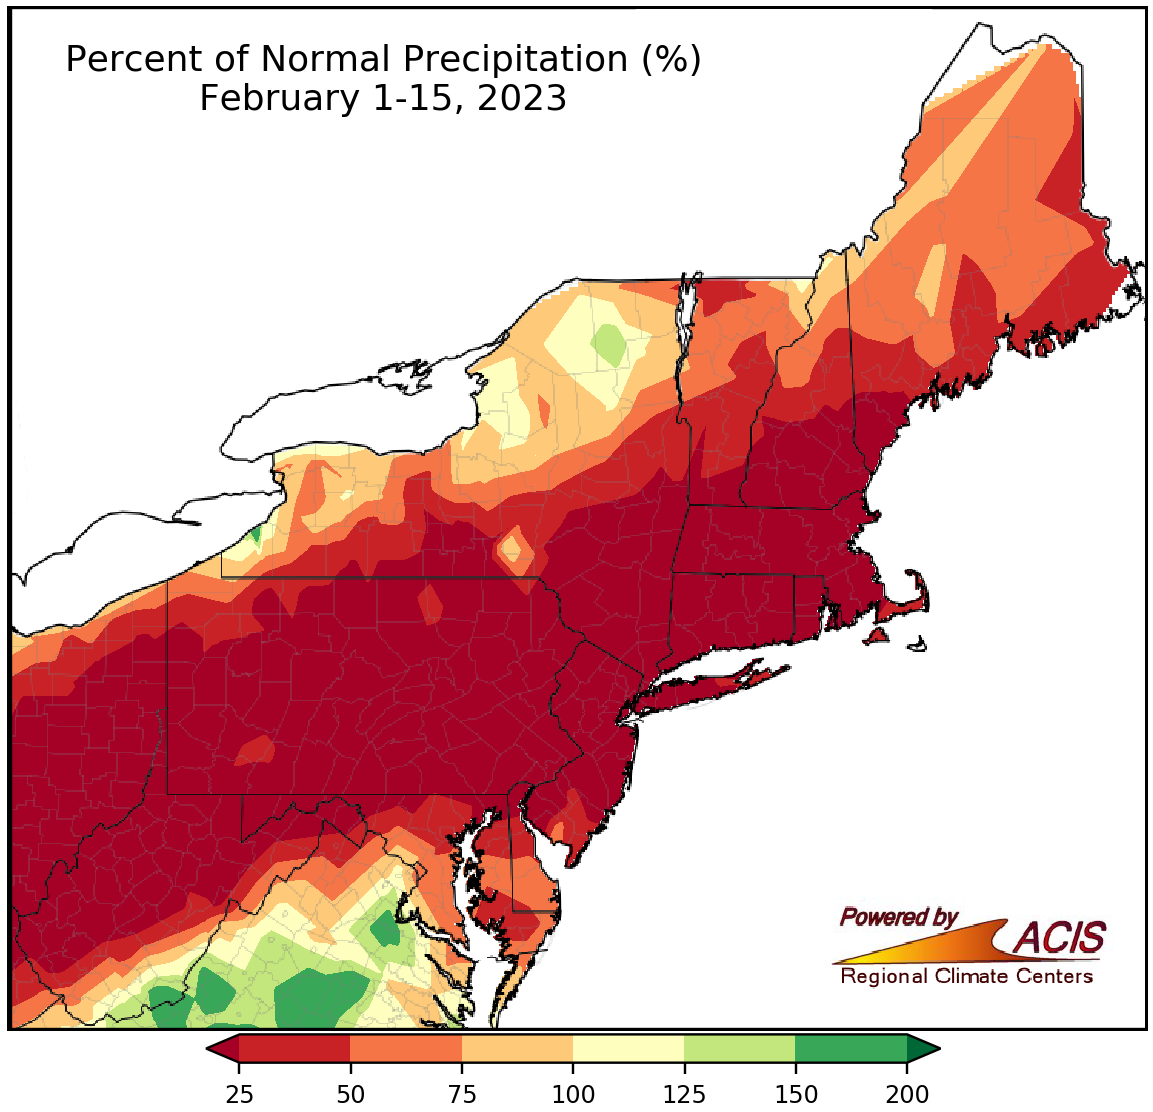
February 1-15 precipitation ranged from less than 25% of normal to near normal for most of the Northeast.
Almost the entire Northeast recorded precipitation deficits during the first half of February. The driest locations, shaded red in the map above, saw less than 25% of normal precipitation and include a large chunk of the region stretching from West Virginia to New England. In fact, 25 of the Northeast’s 35 major climate sites saw less than 25% of normal precipitation during the February 1-15 period. It was the driest first half of February for six major climate sites - Allentown, Harrisburg, and Scranton in Pennsylvania and Charleston, Elkins, and Huntington in West Virginia - and among the 20 driest for another 19 major climate sites. Overall, February 1-15 precipitation ranged from 0% of normal in Allentown, PA, which did not see measurable precipitation, to 99% of normal in Rochester, NY.
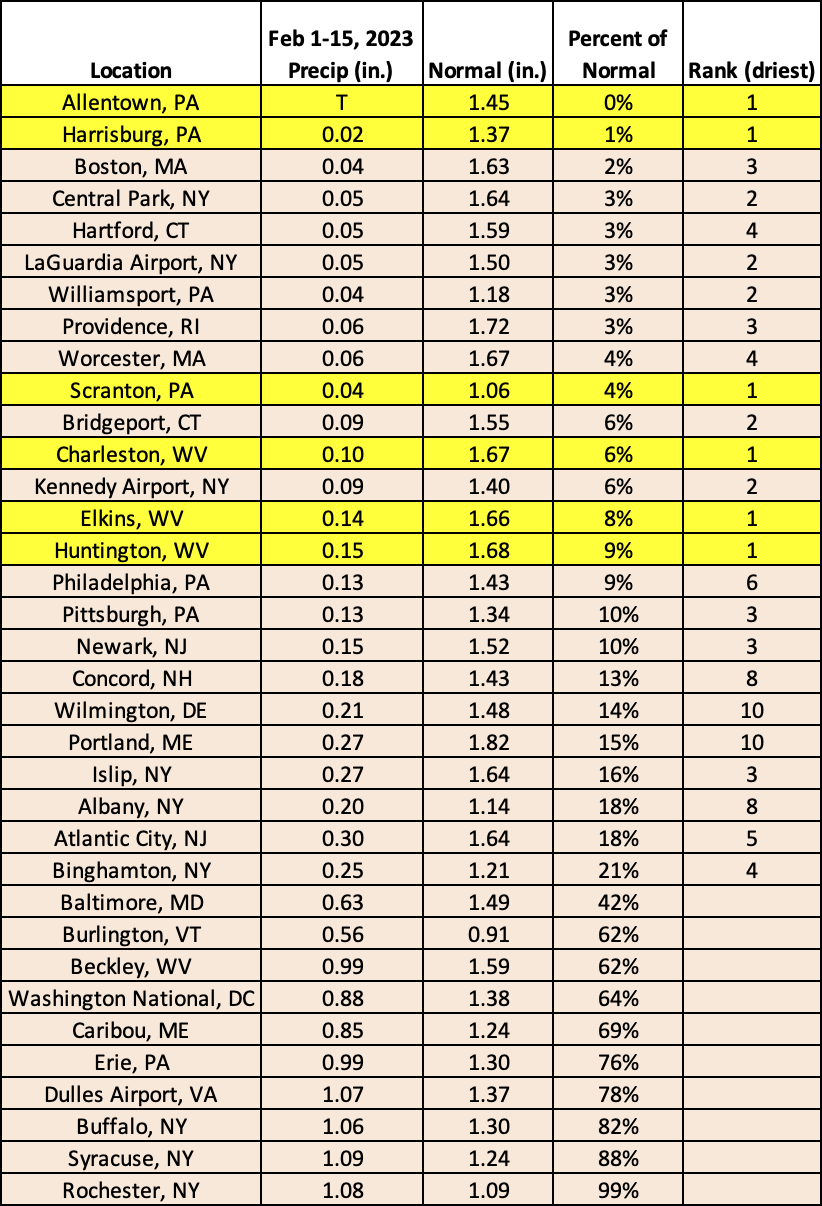
This February 1-15 period was record dry for six major climate sites and among the 20 driest for another 19 of the sites.
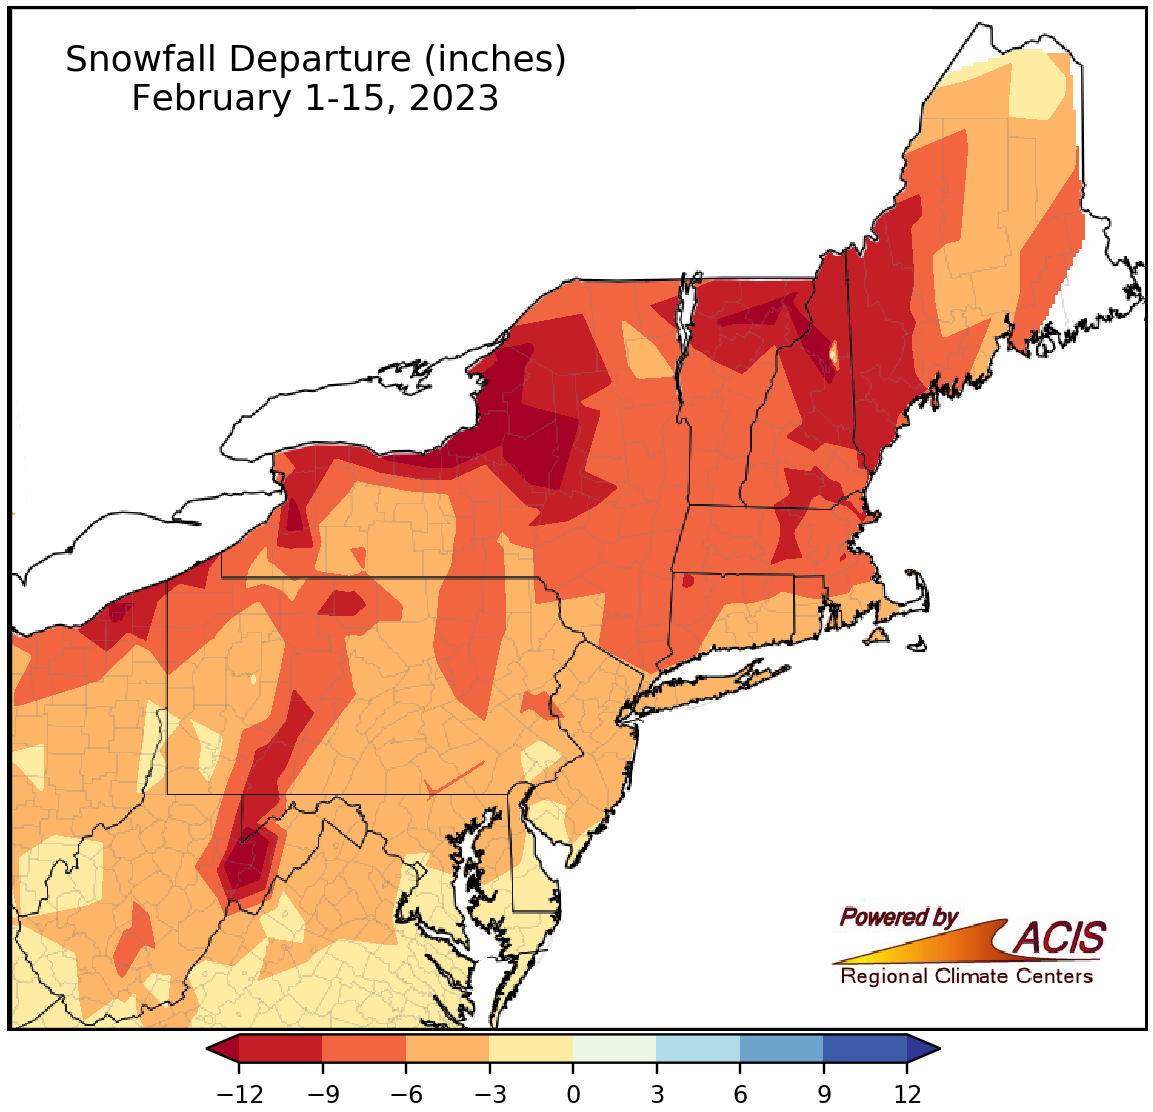
February 1-15 snowfall ranged from more than 12 inches below normal to near normal.
Similar to precipitation, February 1-15 snowfall was also in the red, with the entire Northeast reporting snowfall deficits. The greatest deficits of more than 12 inches were in lake-effect areas of New York and higher elevations of eastern West Virginia, northern Vermont, and northern New Hampshire, all shaded red in the map above. Snowfall during the first half of February at the 35 major climate sites ranged from 11.8 inches below normal in Worcester, MA, to 2.5 inches below normal in Washington, D.C. This February 1-15 period ranked as the least snowy on record for seven major climate sites, generally tying multiple years, and was among the 20 least snowy for another 19 of the sites.
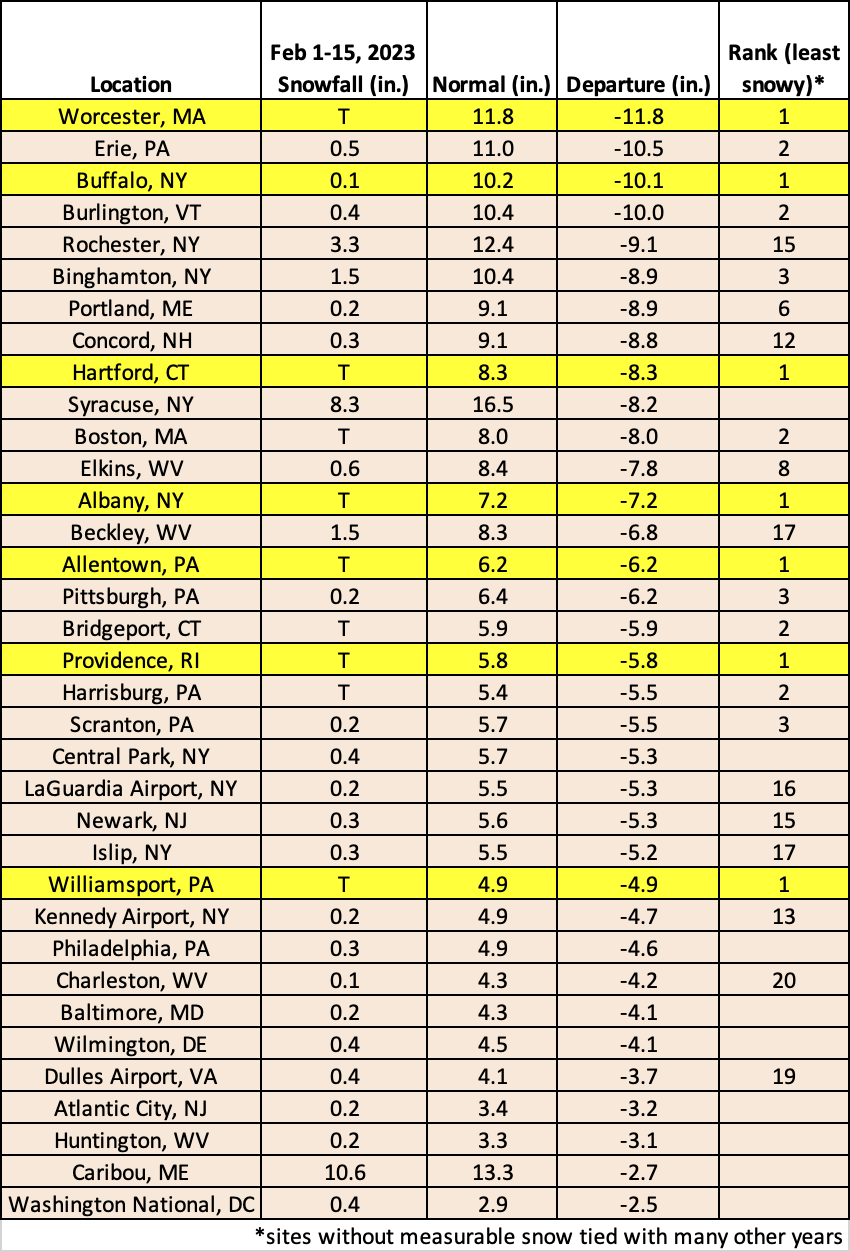
This February 1-15 period ranked as the least snowy for seven major climate sites and among the 20 least snowy for another 19 of the sites.
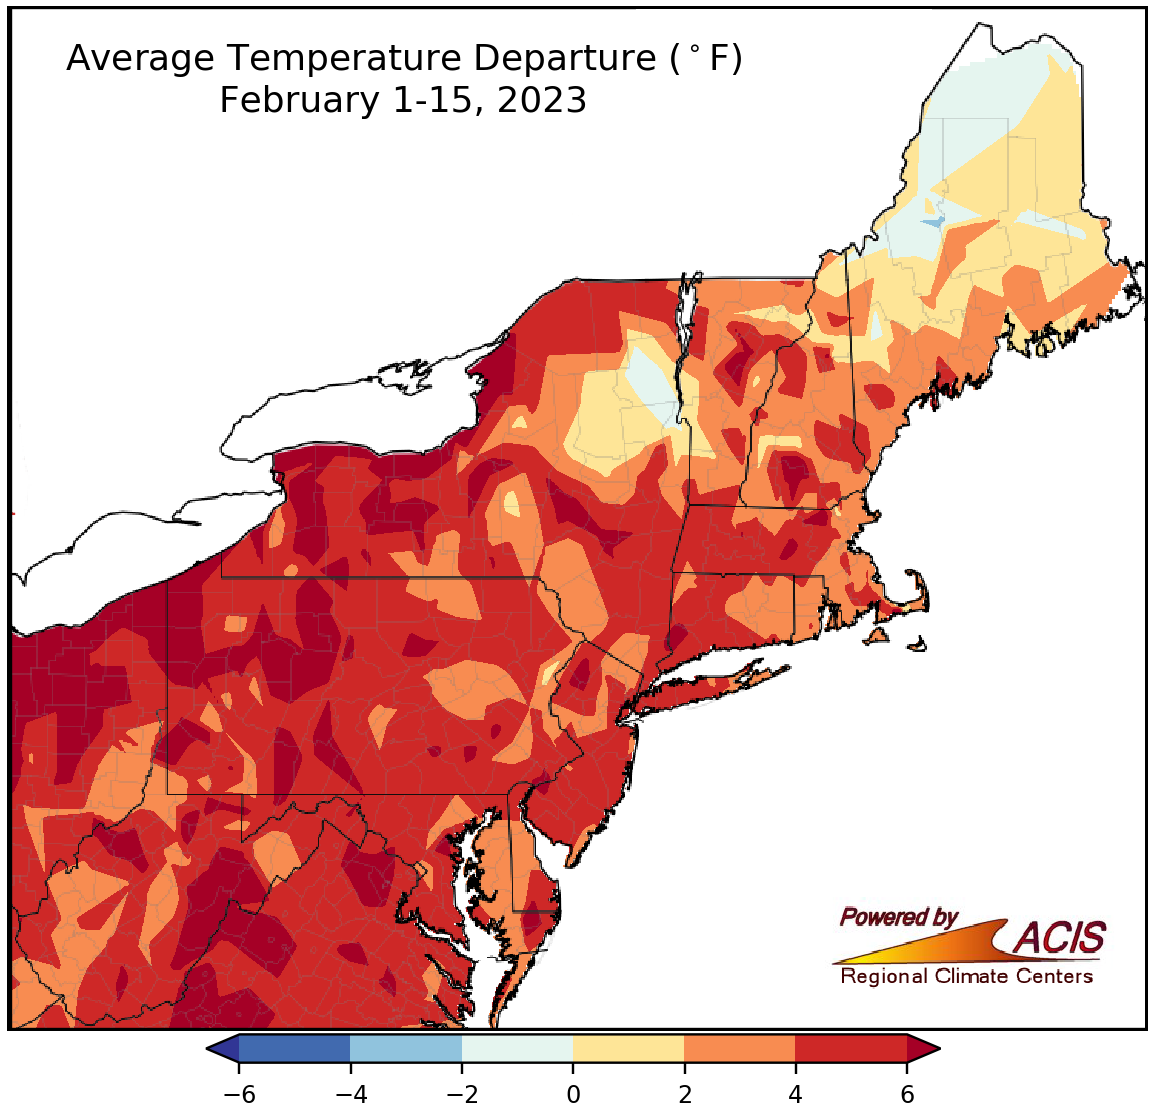
February 1-15 average temperatures ranged from near normal to more than 6°F above normal for most of the Northeast.
The mid-February temperature map above also shows a lot of reds; although, in this case it indicates above-normal temperatures. Most of the Northeast was warmer than normal, with the warmest locations, shaded dark red in the map, being more than 6°F above normal. At the 35 major climate sites, February 1-15 average temperatures ranged from 0.6°F above normal in Caribou, ME, to 7.4°F above normal in Syracuse, NY, with the period ranking among the 20 warmest on record for 33 of the sites.
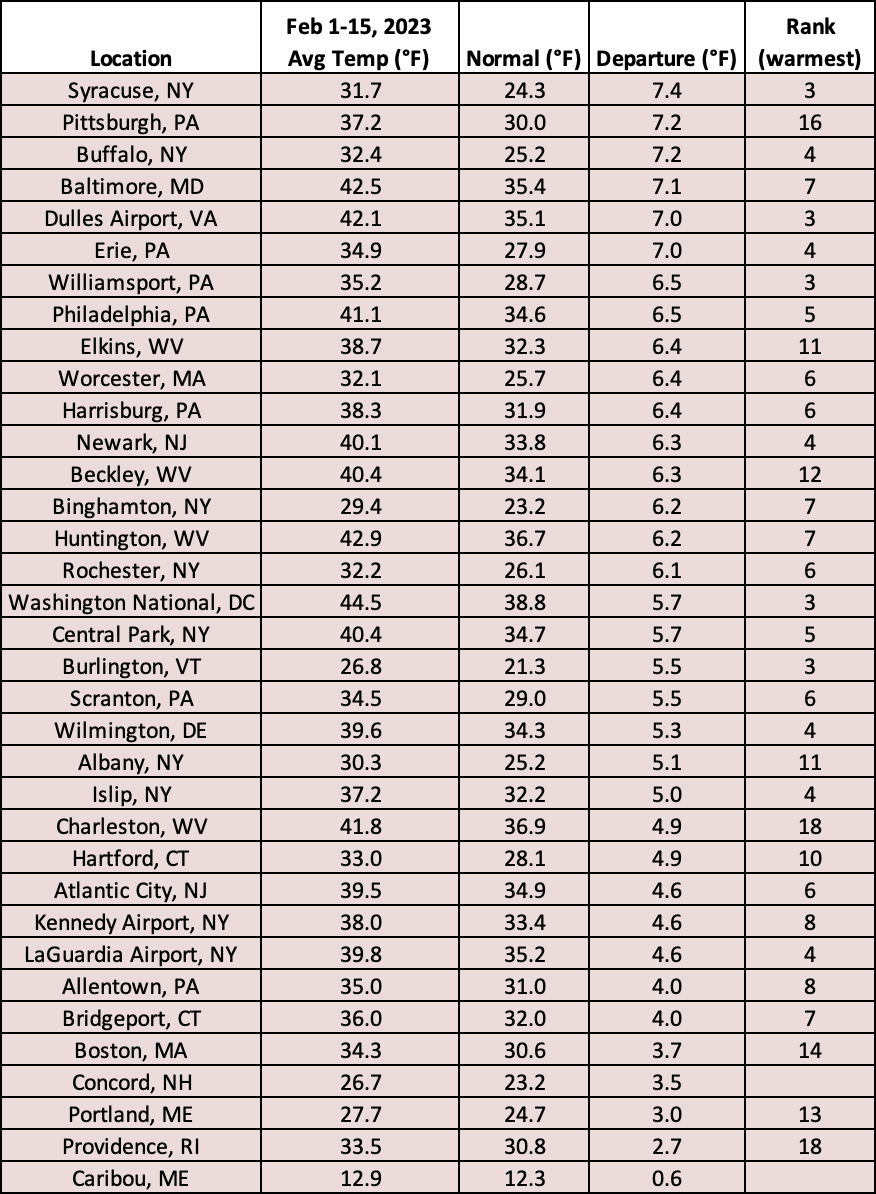
This February 1-15 period was among the 20 warmest on record for 33 major sites.
Despite the warm, dry, mostly snowless start to February, a change could be on the way for parts of the Northeast. The March temperature outlook from NOAA’s Climate Prediction Center shows a tilt toward below-normal temperatures for parts of northern New England and northern New York; however, there’s an increased likelihood of above-normal temperatures for parts of Maryland and Delaware. The March precipitation outlook indicates interior parts of the region including portions of West Virginia, Pennsylvania, and New York could be wetter than normal.
Parts of New England and New York could be cooler than normal in March, while parts of the Mid-Atlantic could be warmer than normal.
There’s a tilt toward above-normal precipitation for interior parts of the region during March.