December & 2019 - Wet and Warm for Most
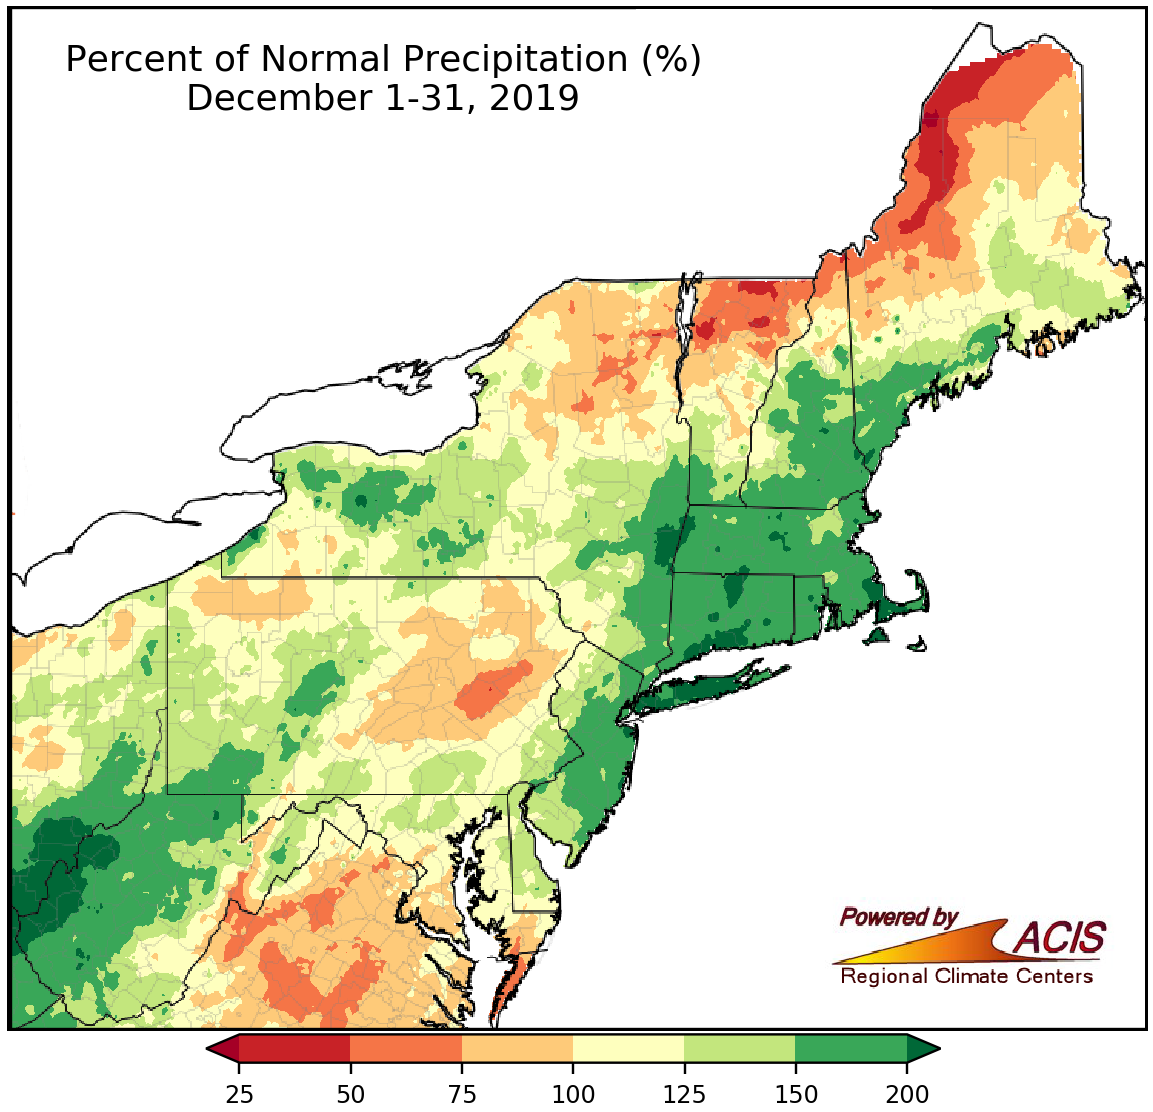
December precipitation ranged from less than 25% of normal to more than 200% of normal.
There was quite a wide range of precipitation amounts during December, from less than 25% of normal in northern Vermont and western Maine to more than 200% of normal in parts of southern New England, eastern New York, and western West Virginia. However, a majority of the region wrapped up the month with a precipitation surplus. In fact, Kennedy Airport, NY, had its wettest December on record with 237% of normal precipitation. Another 21 major climate sites ranked this December among their 20 wettest on record.
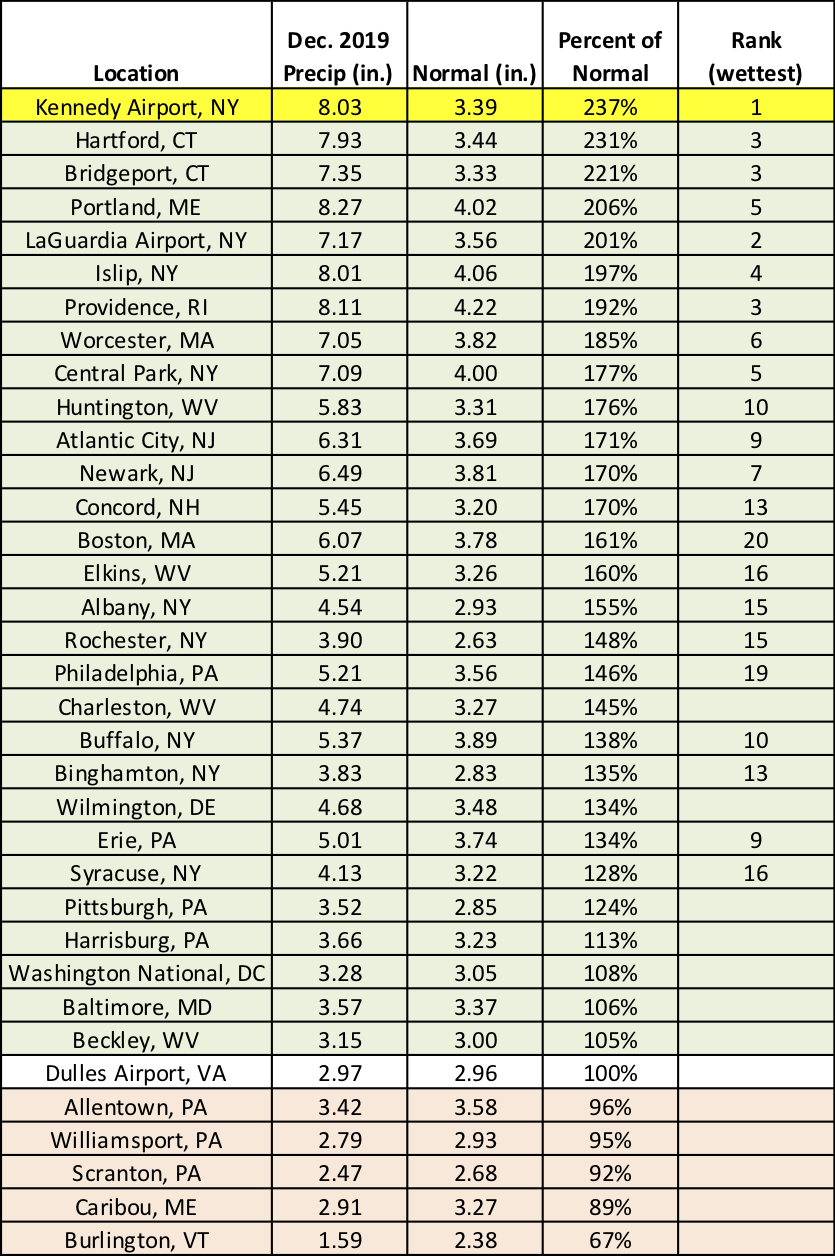
This December was the wettest on record for Kennedy Airport, NY, and among the 20 wettest on record for another 21 major climate sites.
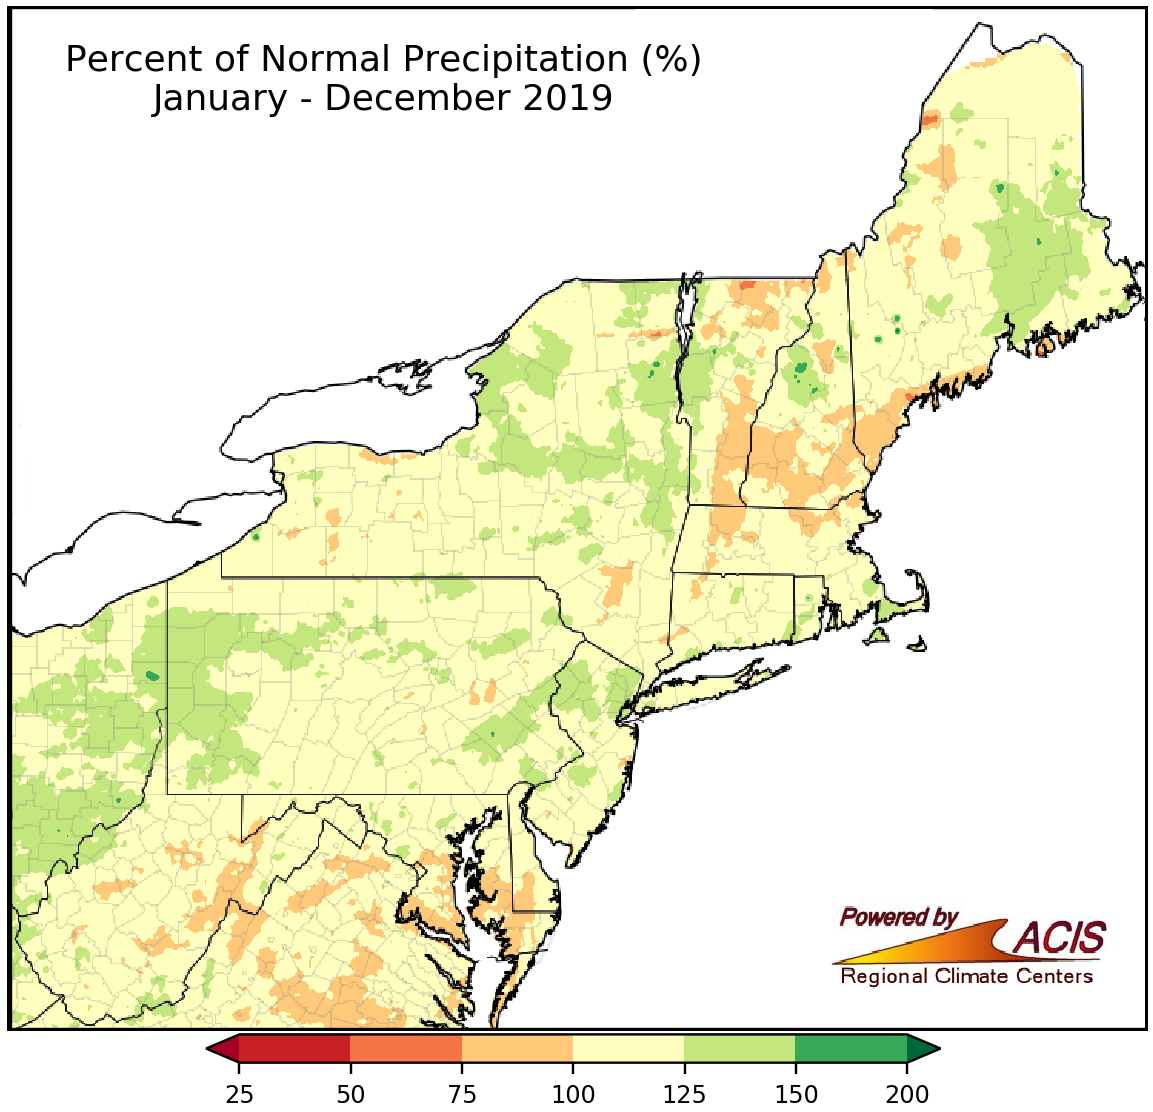
Annual precipitation for 2019 ranged from 75% of normal to 150% of normal.
2019 featured several precipitation extremes, including a soggy spring and a parched September. When it was over, much of the Northeast saw between 100% and 150% of normal precipitation in 2019. However, a few areas received between 75% and 100% of normal precipitation. Thirty-one of the 35 major climate sites were wetter than normal, with 21 of them ranking 2019 among their 20 wettest years on record.
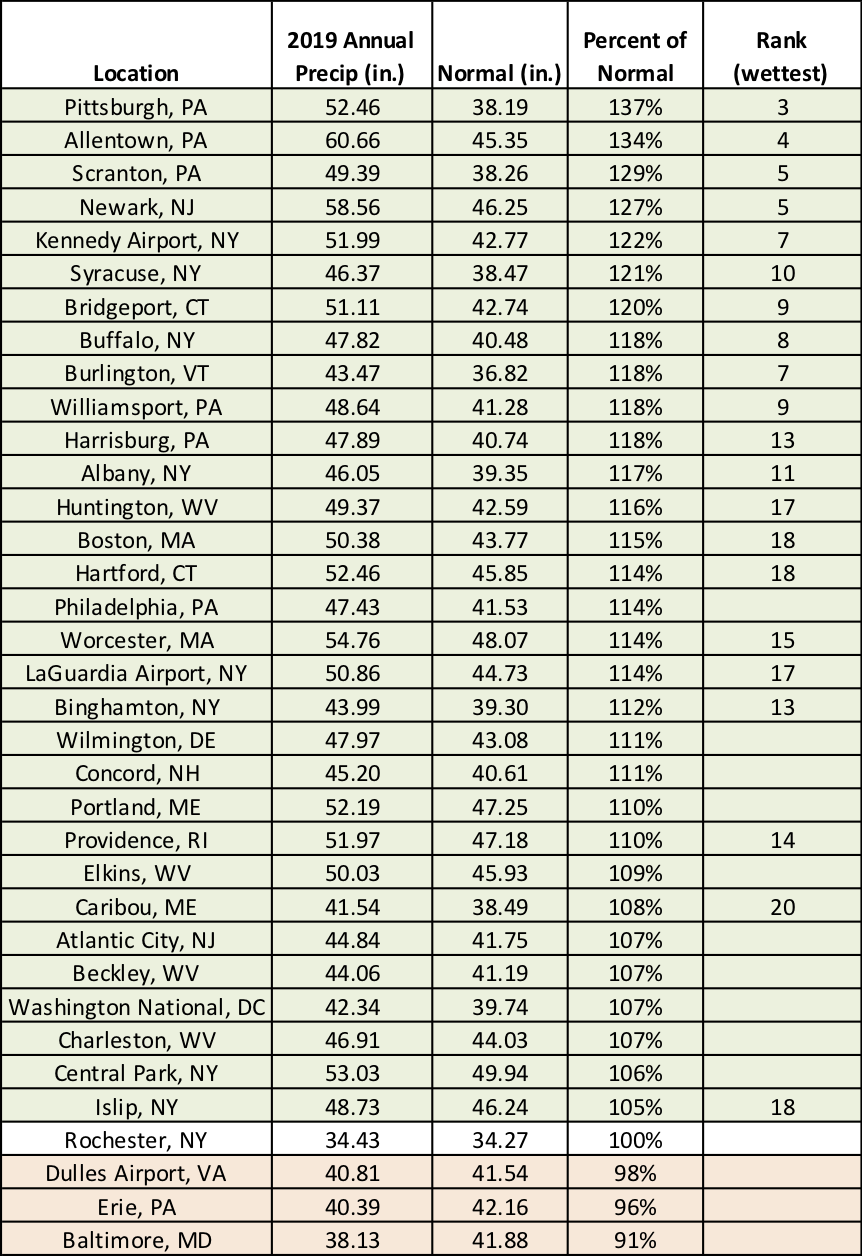
2019 was among the 20 wettest years on record for 21 major climate sites.
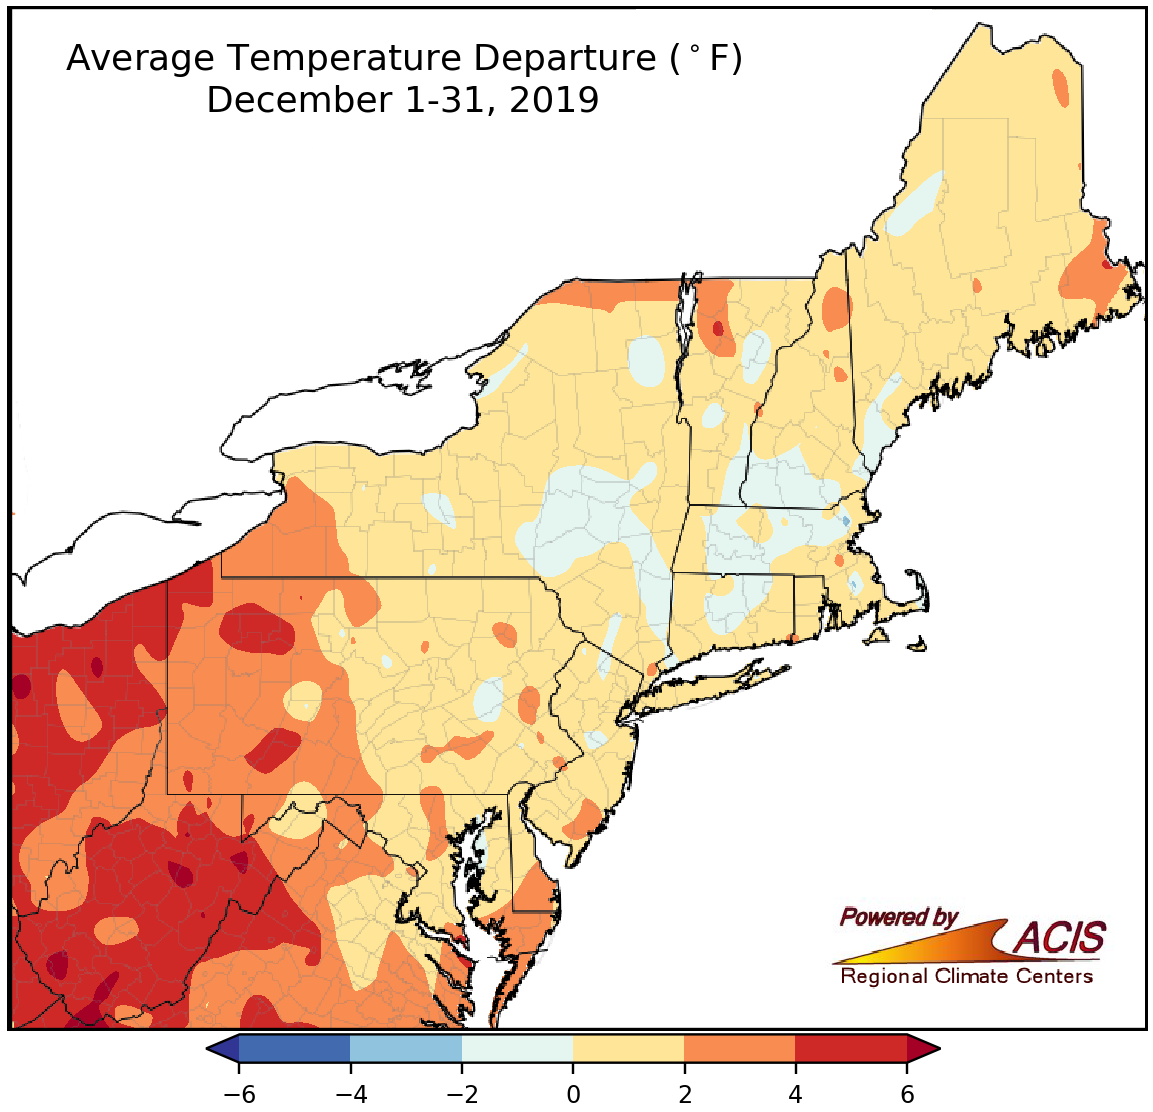
December average temperatures ranged from 2°F below normal to more than 6°F above normal in the Northeast.
Most of the Northeast had a warmer-than-normal December, with western Pennsylvania and West Virginia having the largest departures of more than 4°F above normal. The coolest areas, located in eastern New York and parts of New England, were as much as 2°F below normal. All but one of the 35 major climate sites wrapped up December on the warm side of normal, with nine of them ranking this December among their 20 warmest on record.
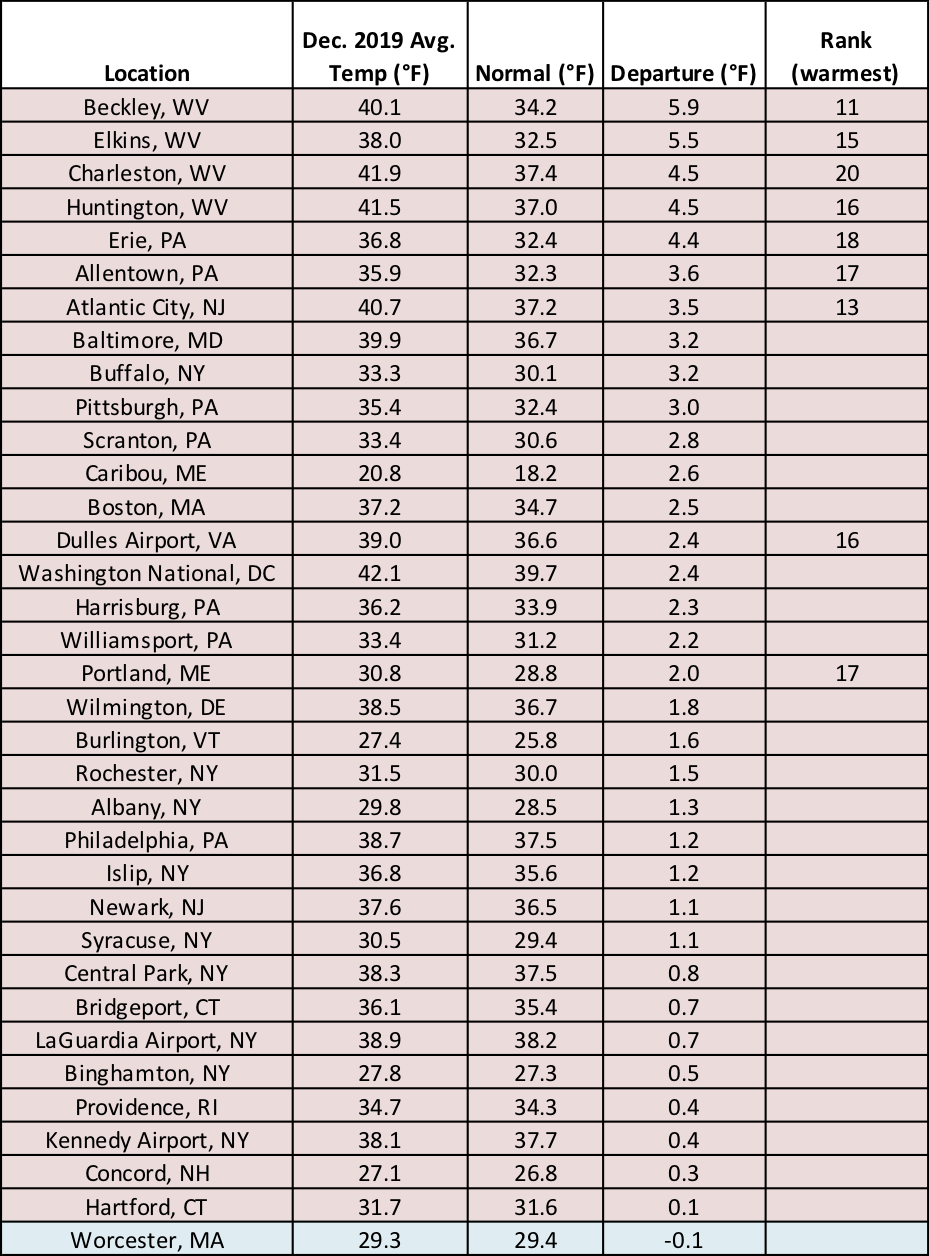
Average temperatures in December were up to 5.9°F above normal at the major climate sites.
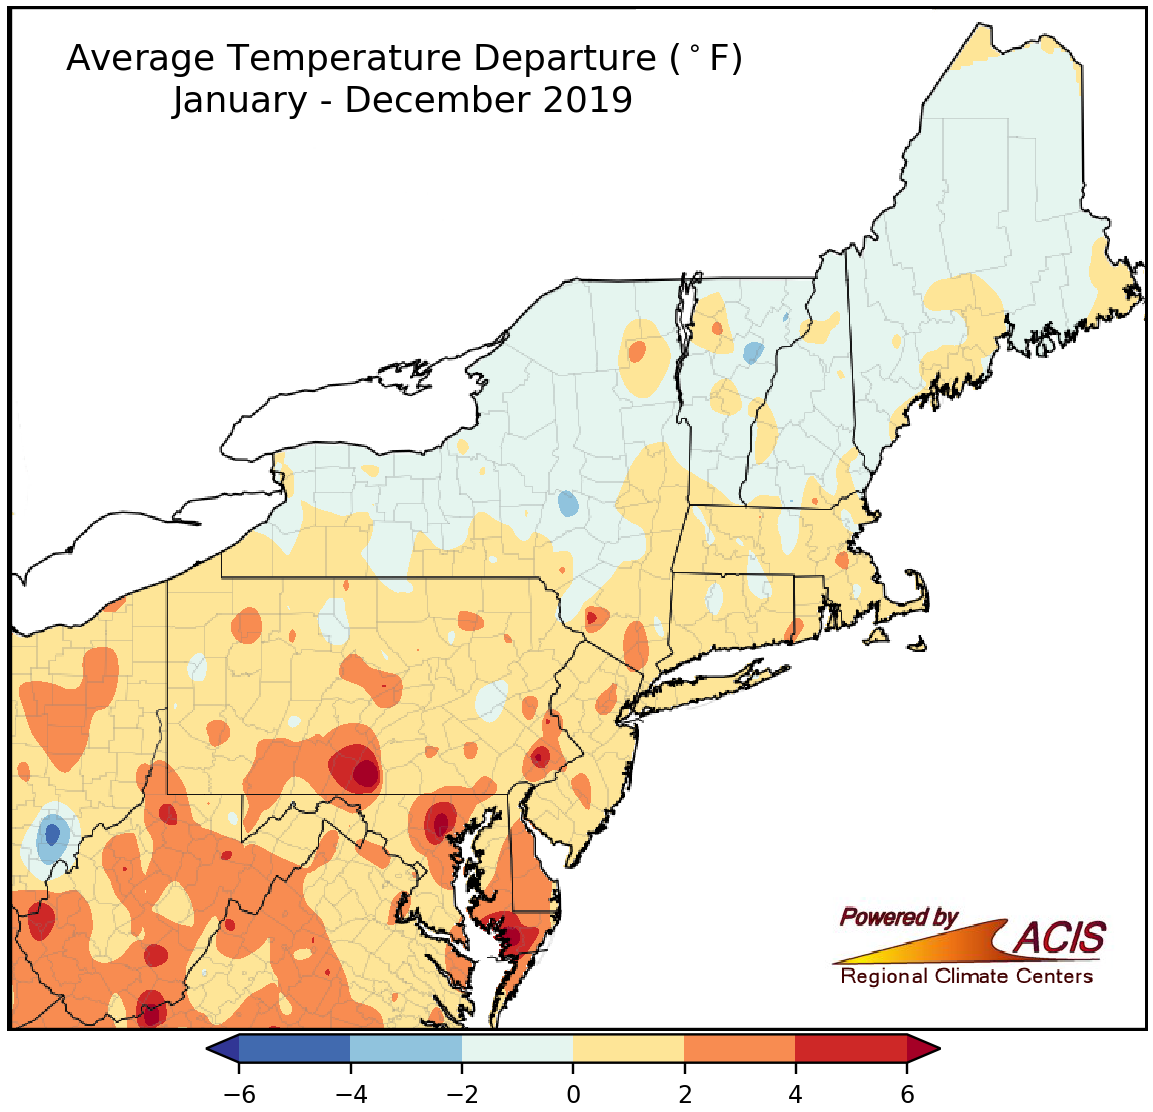
2019 average temperatures ranged from 2°F below normal to 4°F above normal for most of the Northeast.
There were a few months in 2019 that featured record-setting heat. For instance, July lived up to its title of the hottest month on record and there was a sizzling start to October. With that, 2019 averaged out to be warmer than normal for a large part of the Northeast, except portions of northern New England and upstate New York. Annual average temperatures generally ranged from 2°F below normal to 4°F above normal. 2019 ranked as the warmest year on record for Elkins, WV, at 3.3°F above normal and among the 20 warmest years on record for another 19 major climate sites.
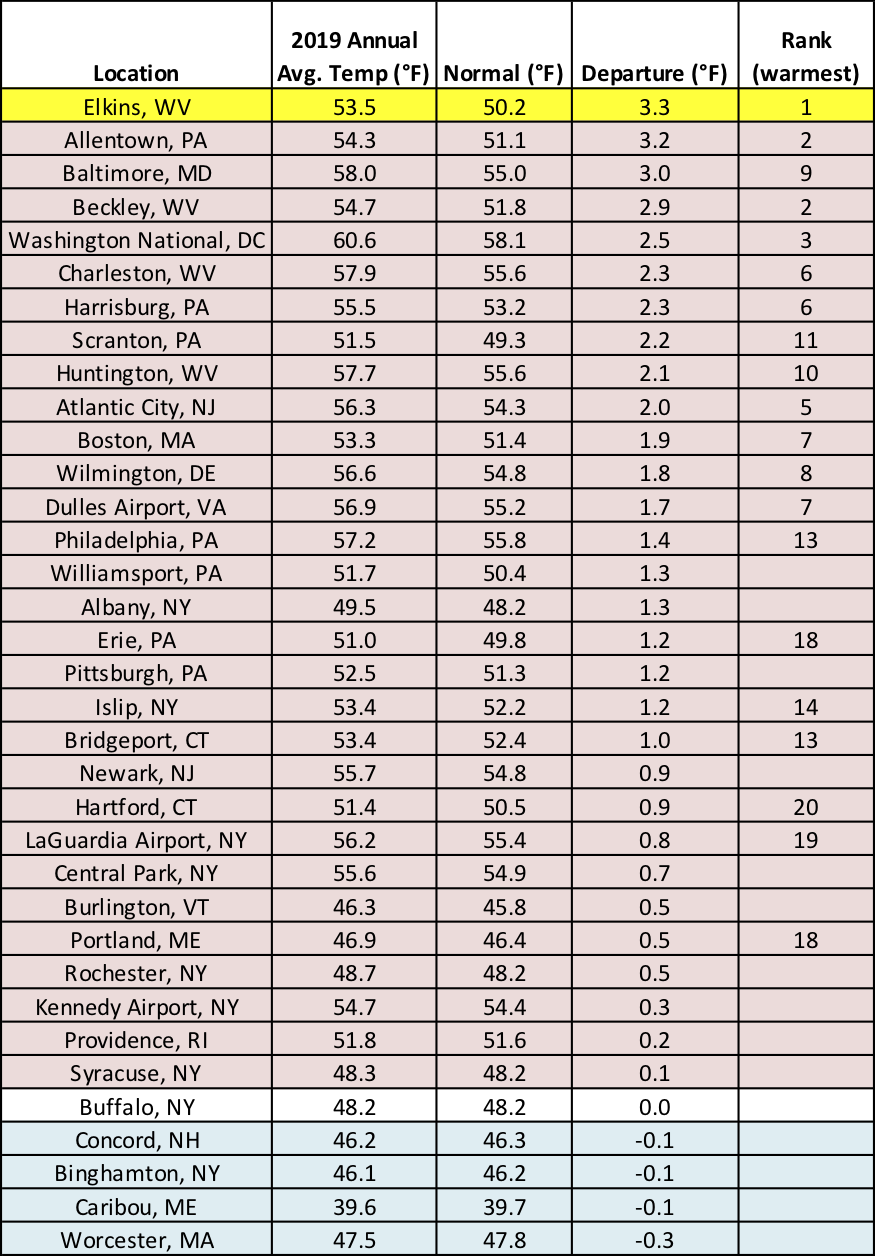
Elkins, WV, had its warmest year on record, and another 19 sites ranked 2019 among their 20 warmest years on record.
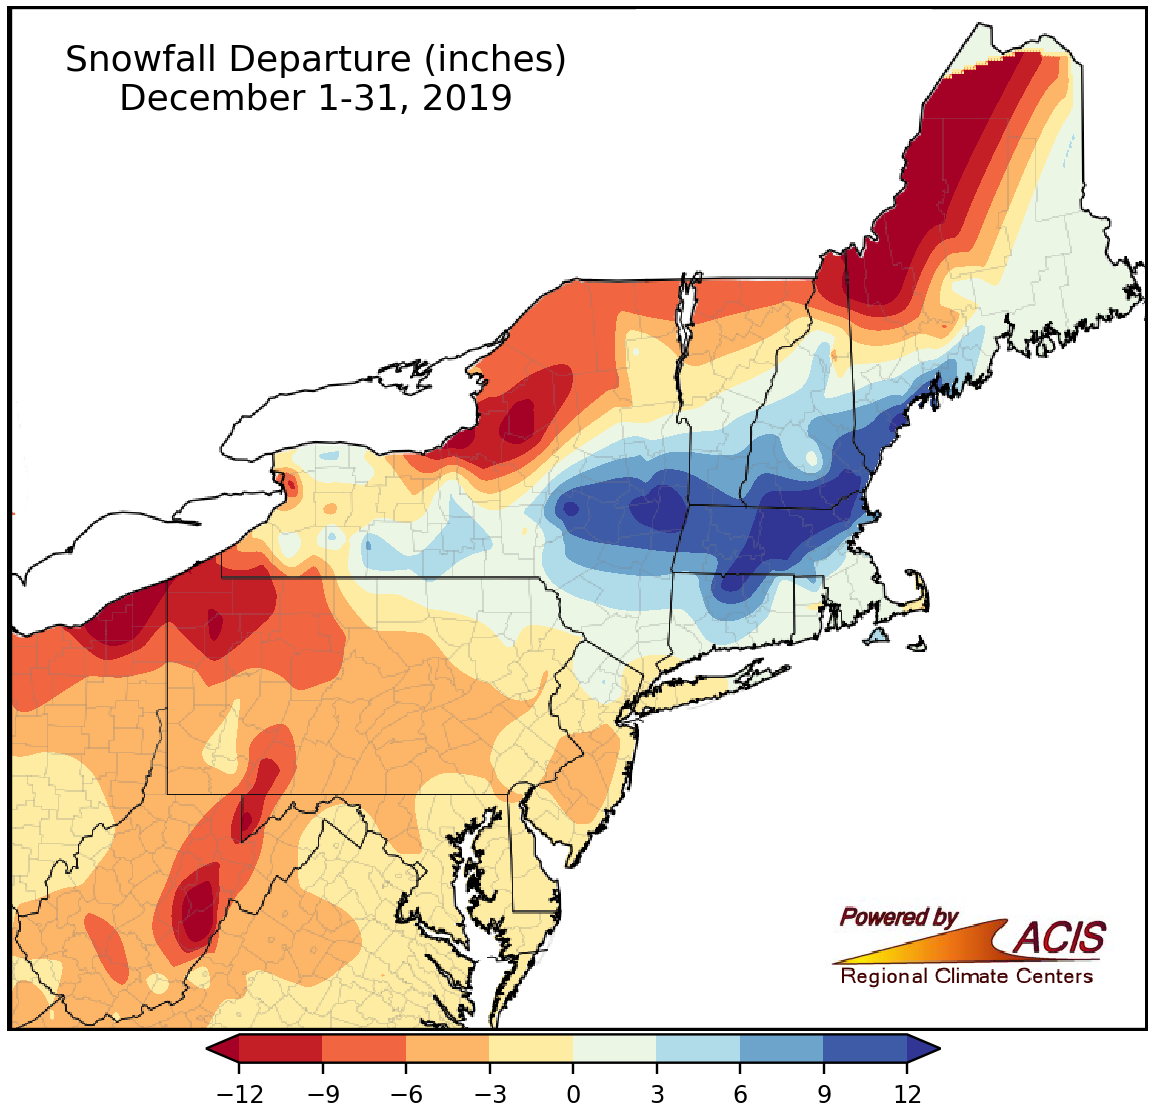
December snowfall ranged from more than 12 inches below normal to more than 12 inches above normal.
December snowfall varied, ranging from more than 12 inches below normal in eastern West Virginia, northern New York, and western Maine to more than 12 inches above normal in eastern New York, northern Connecticut, central Massachusetts, and southern New Hampshire. Twenty-five of the 35 major climate sites had a snowfall deficit in December. This December ranked among the 20 least snowy on record for three of the sites and among the 20 snowiest at five of the sites.
In addition, nine major climate sites are still waiting for their first inch of snow. While the average date for the New York City airports and Atlantic City, NJ, is early January, Harrisburg, PA, is two weeks overdue for theirs.
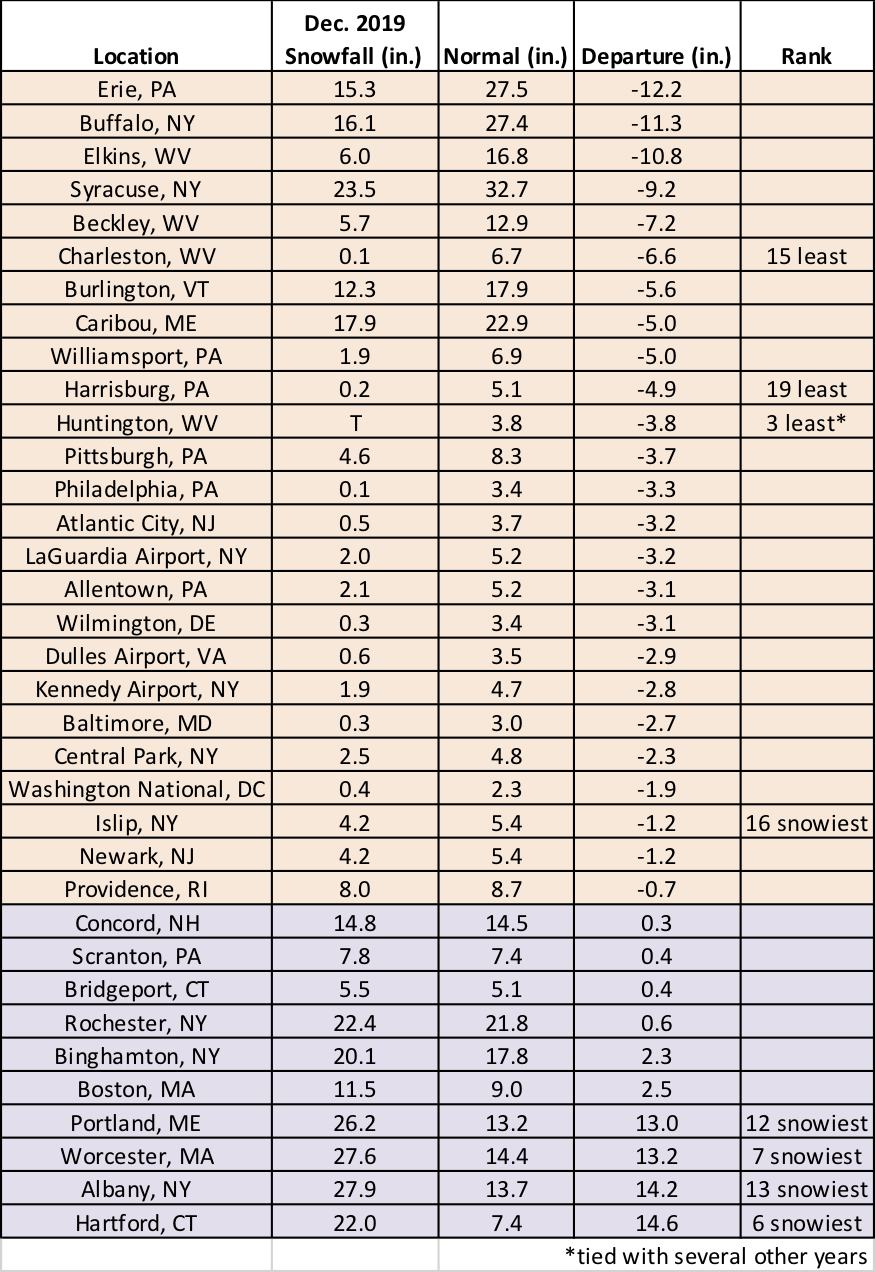
December snowfall ranged from 12.2 inches below normal in Erie, PA, to 14.6 inches above normal in Hartford, CT.