The Hottest Month Lives up to Its Title
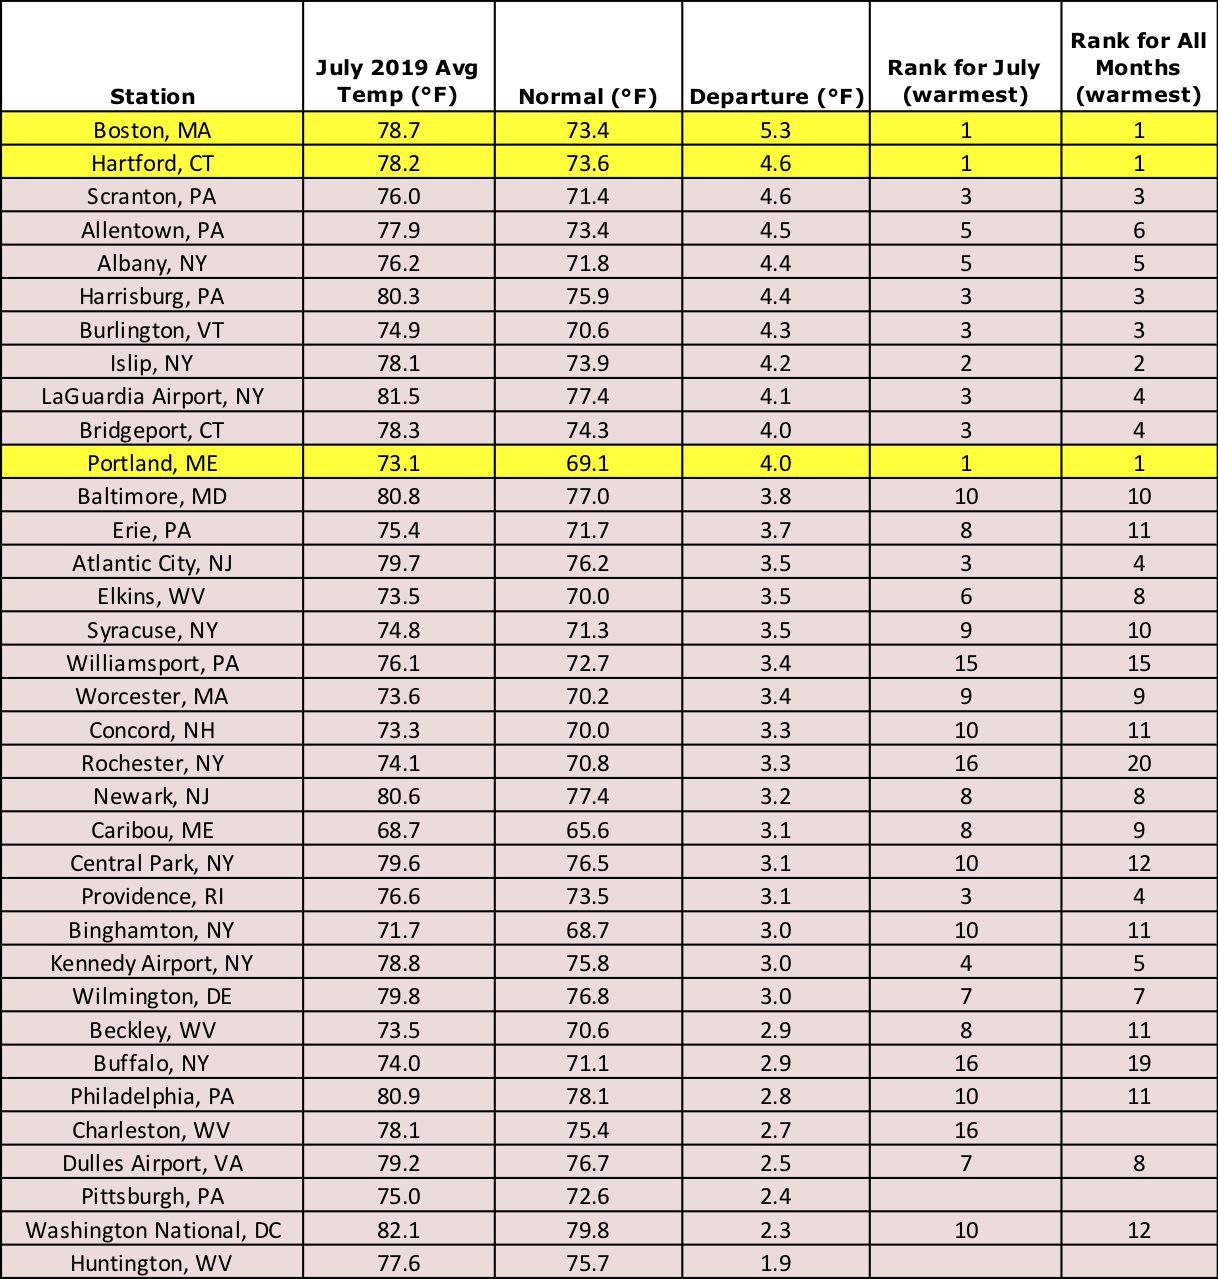
July 2019 was the all-time hottest month on record at Boston, Hartford, and Portland.
July was unusually hot across the Northeast, with average temperatures as much as 6°F above normal. In fact, this July became the all-time hottest month on record for Boston, MA; Hartford, CT; and Portland, ME. In all, 32 of the 35 major climate sites ranked July 2019 among their 20 all-time warmest months on record, with 22 of those sites ranking it among their 10 all-time warmest.
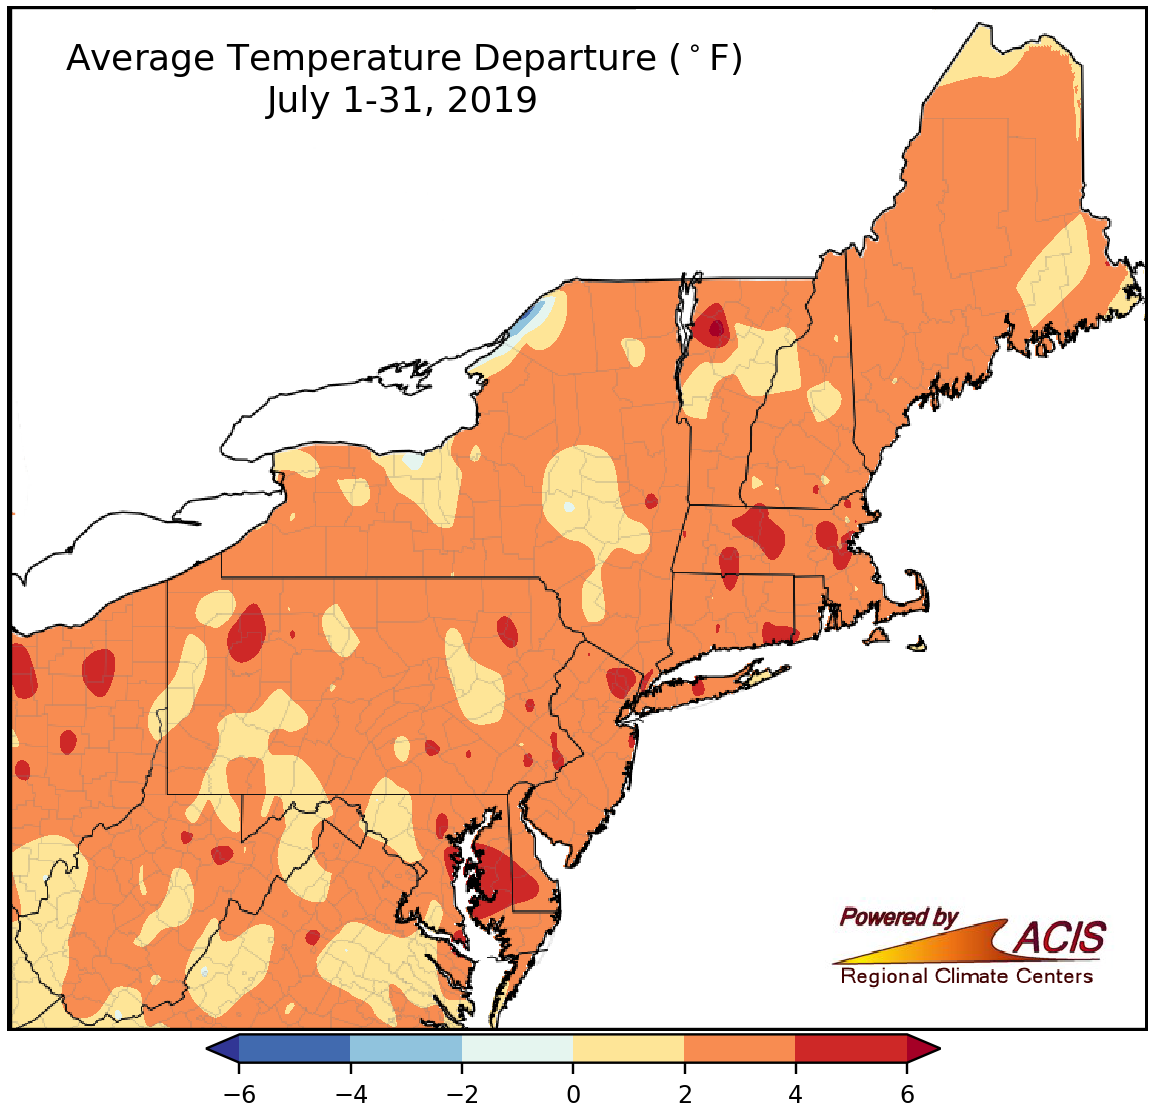
Average temperatures during July were up to 6°F above normal.
Both maximum (max) temperatures and minimum (min) temperatures were extremely warm. A majority of the major climate sites saw more days than usual in July with a high of at least 90°F. For instance, Hartford, CT, had 19 days with a high of 90°F or above, 12 more than average and the site’s most for any month on record (since 1905). In addition, Hartford and Bridgeport, CT, had their highest average max temperature for any month on record.
Min temperatures were record-setting at a few sites during the mid-July heat wave. And once the month wrapped up, the average min temperature for July was the all-time warmest for any month on record for Boston, MA, and Harrisburg, PA. Also, during July, Scranton, PA, and Boston had their greatest number of days with a min temperature of 70°F or higher for any month on record. Boston had 17 such days, 10 more than average, while Scranton had 10, which is 8 more than usual.
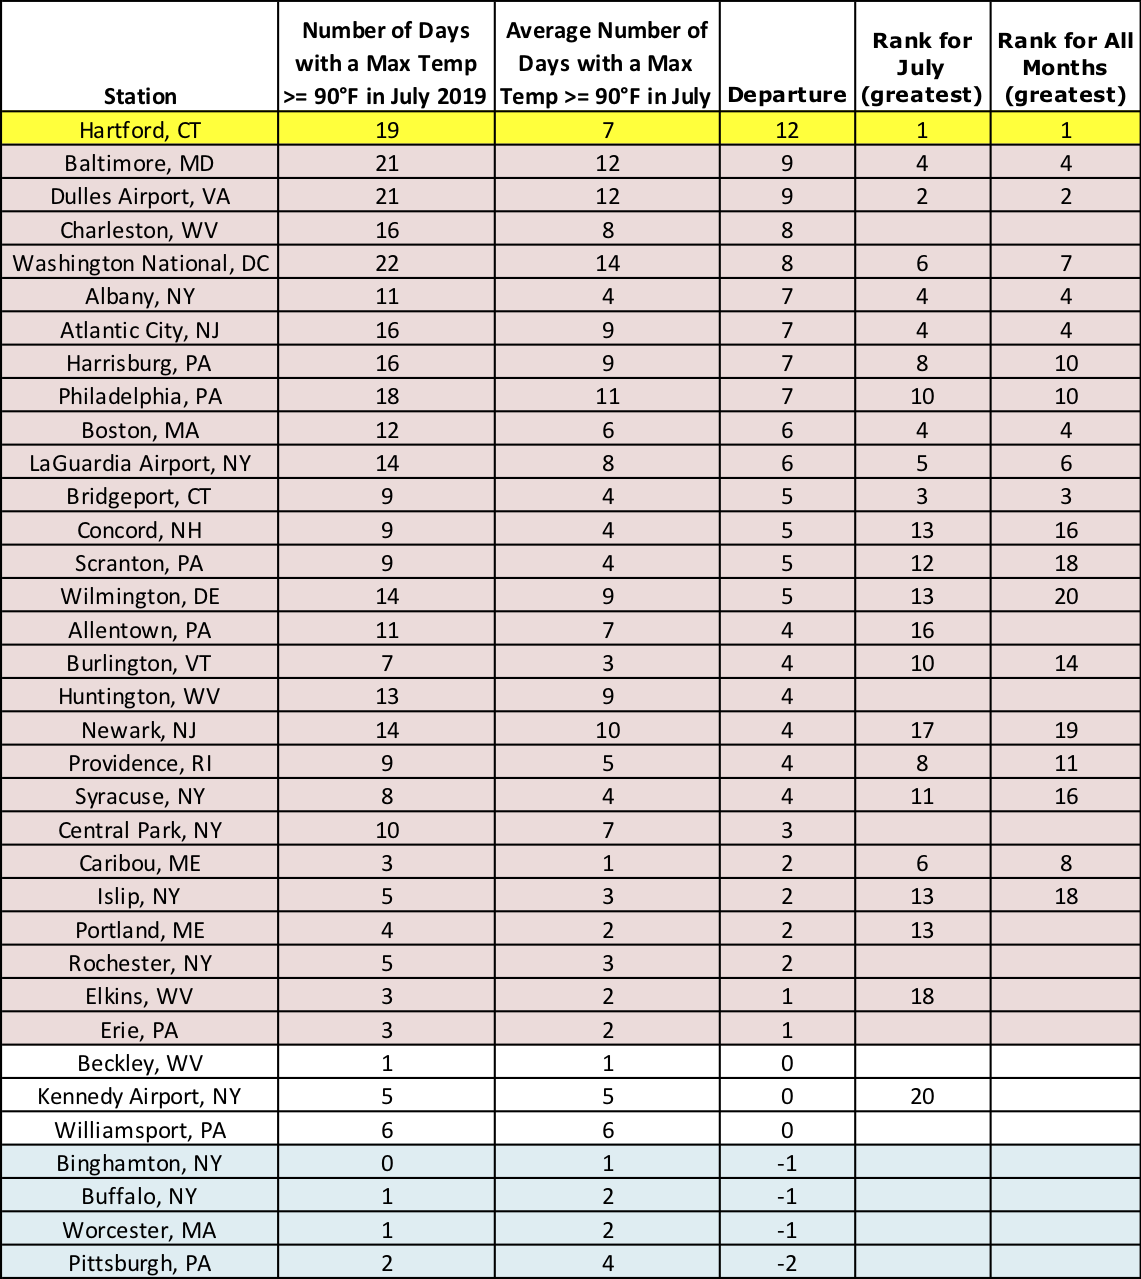
There were more 90°F days than usual during July, with Hartford, CT, seeing a record number.
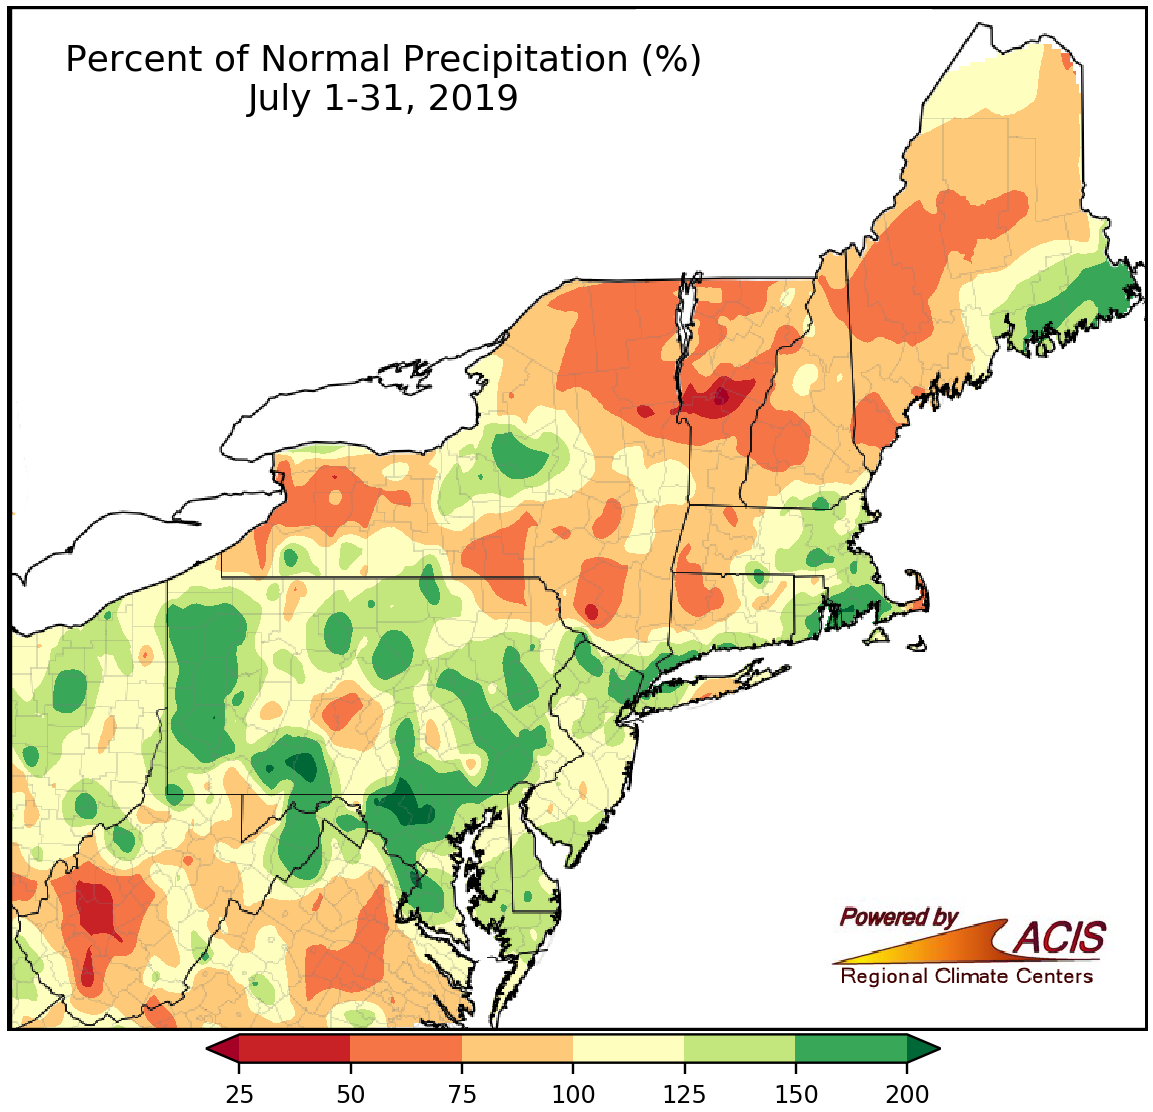
Rainfall during July ranged from 50% of normal to 200% of normal for most of the Northeast.
July rainfall ranged from less than 50% of normal in central Vermont and the southern half of West Virginia to more than 200% of normal in south-central Pennsylvania and northern Maryland. The 35 major climate sites were nearly split, with 18 wrapping up July on the wet side of normal and 17 landing on the dry side. While nine sites ranked this July among their 20 wettest on record, three ranked it among their 20 driest. There were several flash flood events during July, with a particularly notable one on July 8 in parts of Maryland, West Virginia, and Virginia.
Despite numerous days with severe thunderstorms during July, there were only five tornadoes, well below the Northeast’s (1989-2013) average of 13. This month’s tornadoes included an EF-0 on July 6 and an EF-1 on July 11, both in Mount Laurel, NJ, as well as three rare (EF-1) tornadoes on July 23 on Cape Cod, MA.
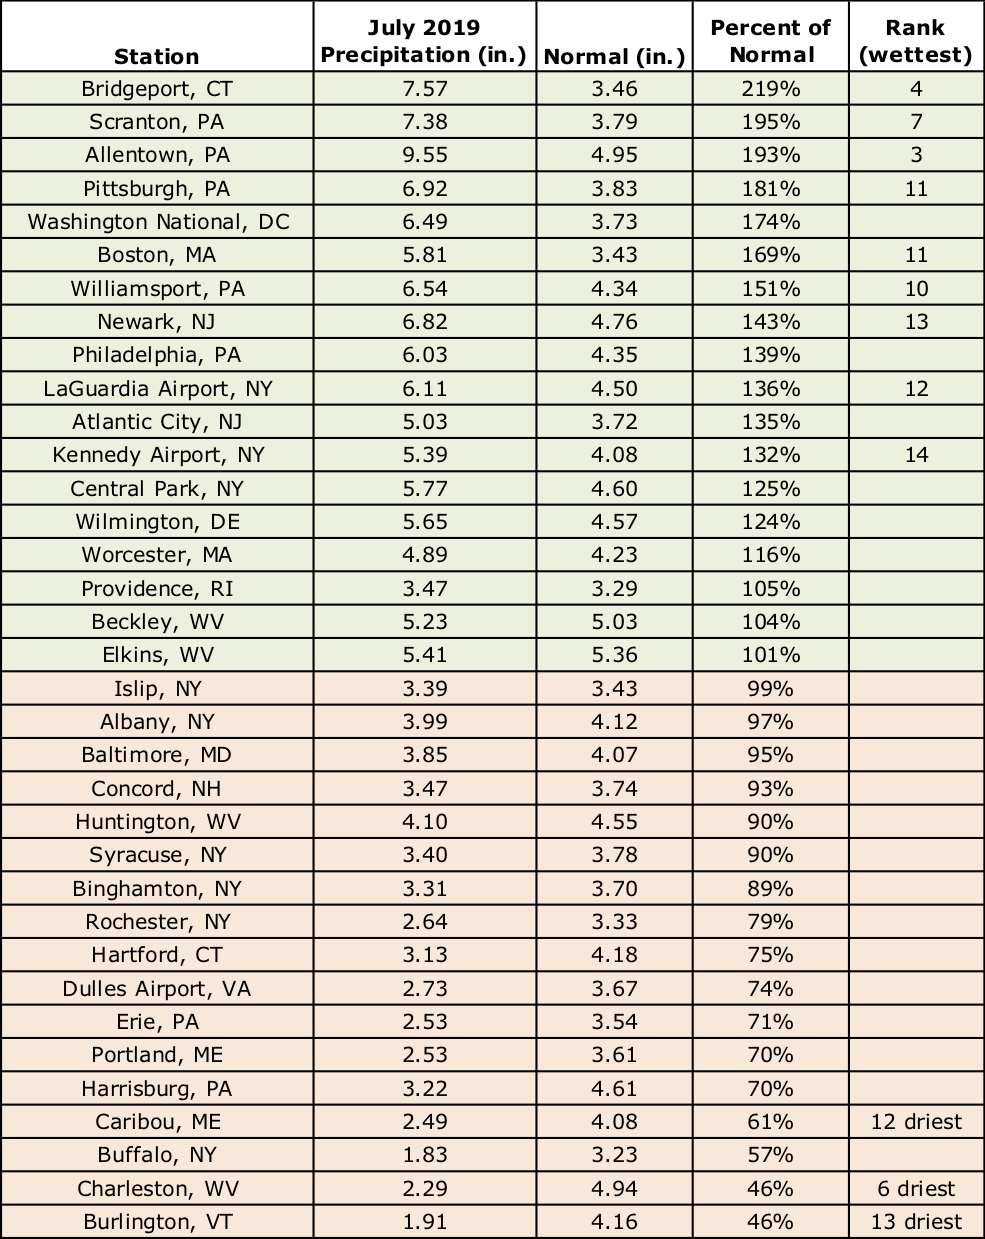
July precipitation at the major climate sites ranged from 46% of normal in Burlington, VT, and Charleston, WV, to 219% of normal in Bridgeport, CT.
What will August bring? The latest monthly precipitation outlook from NOAA’s Climate Prediction Center indicates an increased chance of below-normal precipitation for portions of western and northern West Virginia, western Pennsylvania, and western New York, with equal chances of below-, near-, or above-normal precipitation for the rest of the Northeast.
As for temperatures, the outlook calls for an increased chance of cooler-than-normal temperatures for the Northern Panhandle of West Virginia, a portion of western Pennsylvania, and far western New York. There are increased chances of warmer-than-normal temperatures for eastern Maryland, Delaware, far eastern Pennsylvania, New Jersey, eastern New York, and New England. The rest of the region falls into the equal chances category.
Parts of the region, shaded tan, could see a drier-than-normal August.
August is expected to average out to be cooler than normal in areas shaded blue and warmer than normal in areas shaded orange.