Spotty Showers
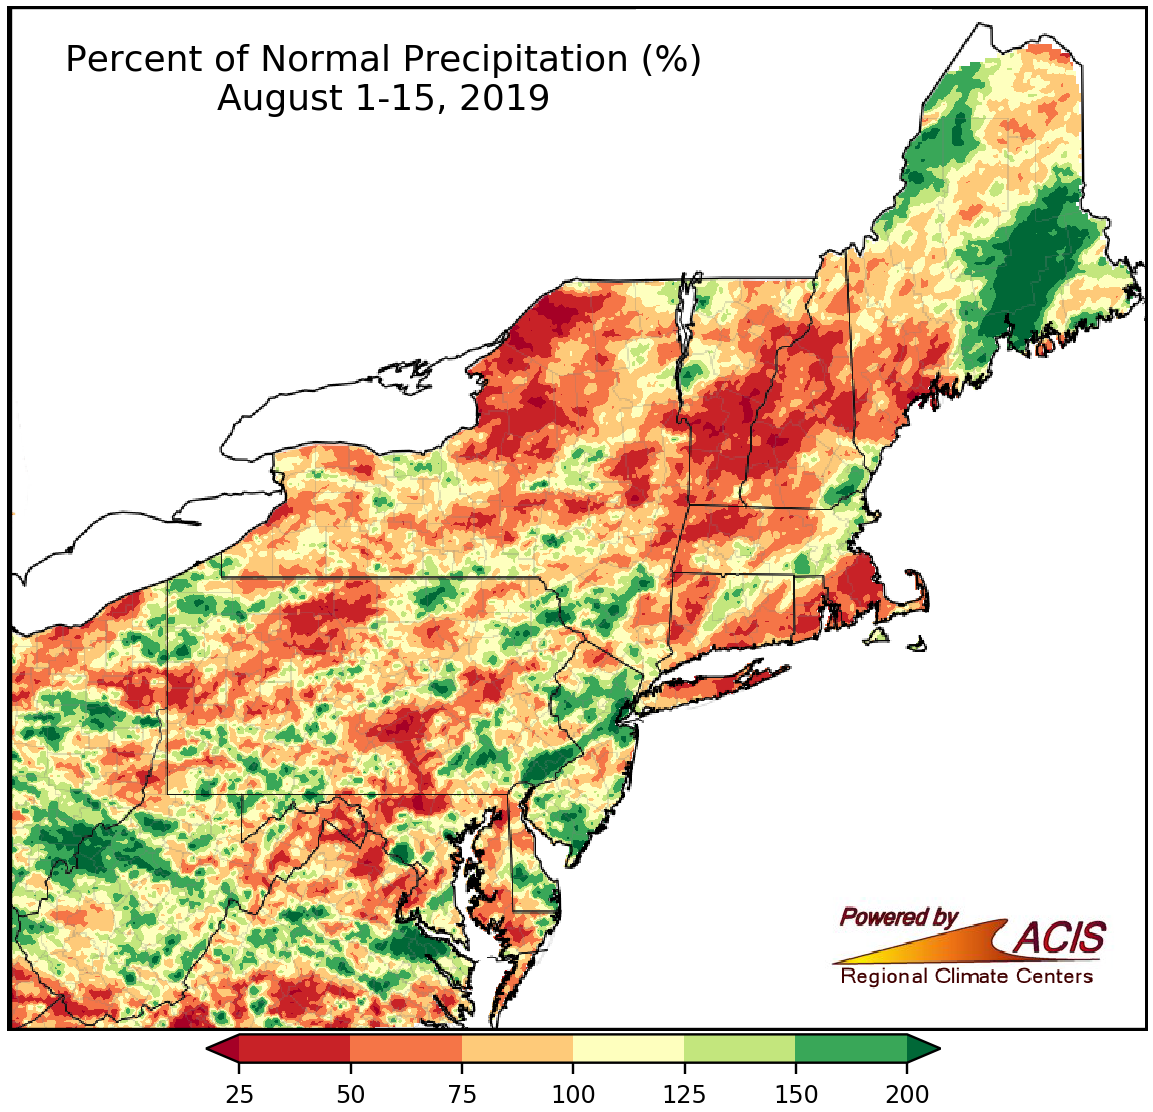
August 1-15 rainfall ranged from less than 50% of normal to more than 200% of normal.
As is usually the case with summer showers, rainfall was hit-or-miss so far this August, ranging from less than 50% of normal to more than 200% of normal. Drier-than-normal and wetter-than-normal spots were sprinkled throughout the region. Abnormally dry conditions developed in portions of western and southern West Virginia, southern Maryland, northern New York, northwestern Connecticut, southwestern Massachusetts, southern Vermont, western New Hampshire, and southern Maine. Of the 35 major climate sites, 22 experienced a drier-than-normal start to August, with three of those sites ranking this first half of August among their 20 driest. Of the 13 wetter-than-normal sites, four ranked this August 1-15 period among their 20 wettest.
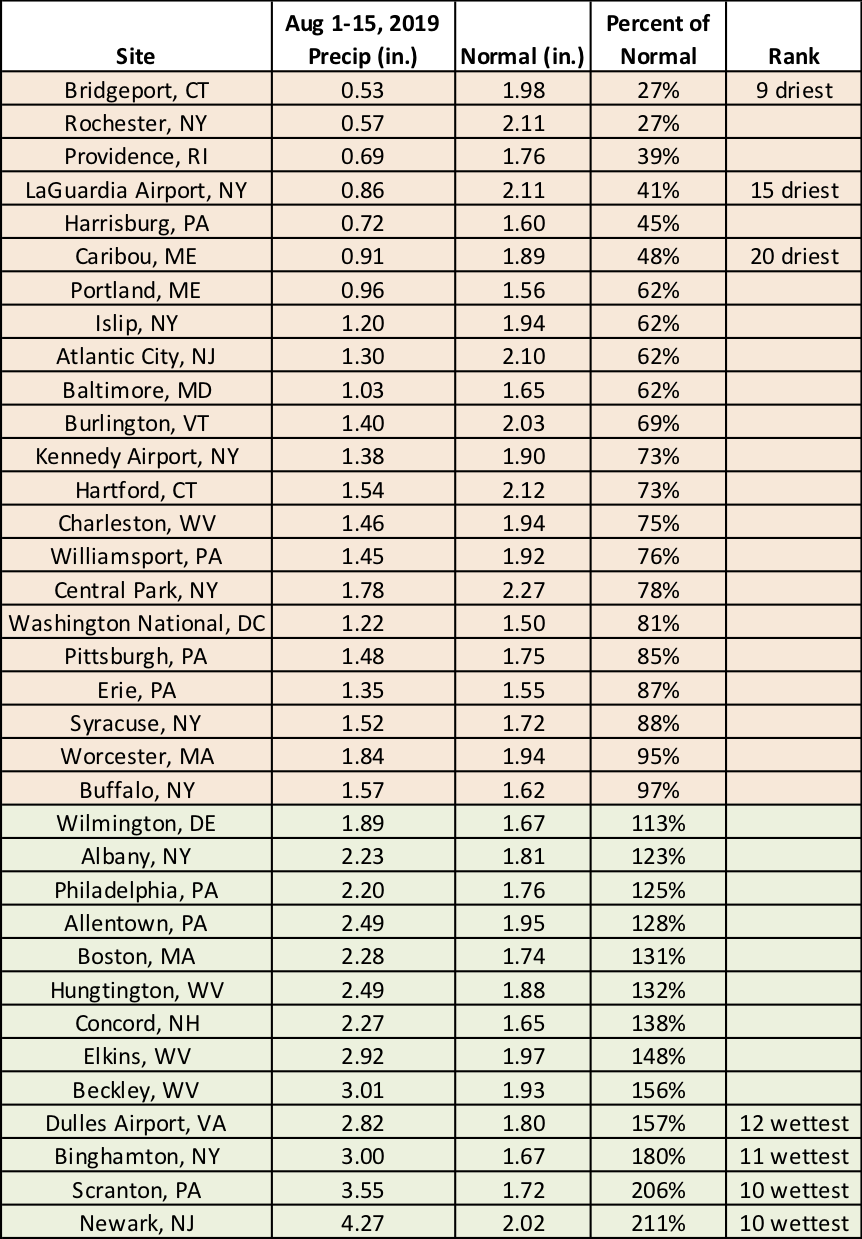
August 1-15 precipitation ranged from 27% of normal in Bridgeport, CT and Rochester, NY, to 211% of normal in Newark, NJ.
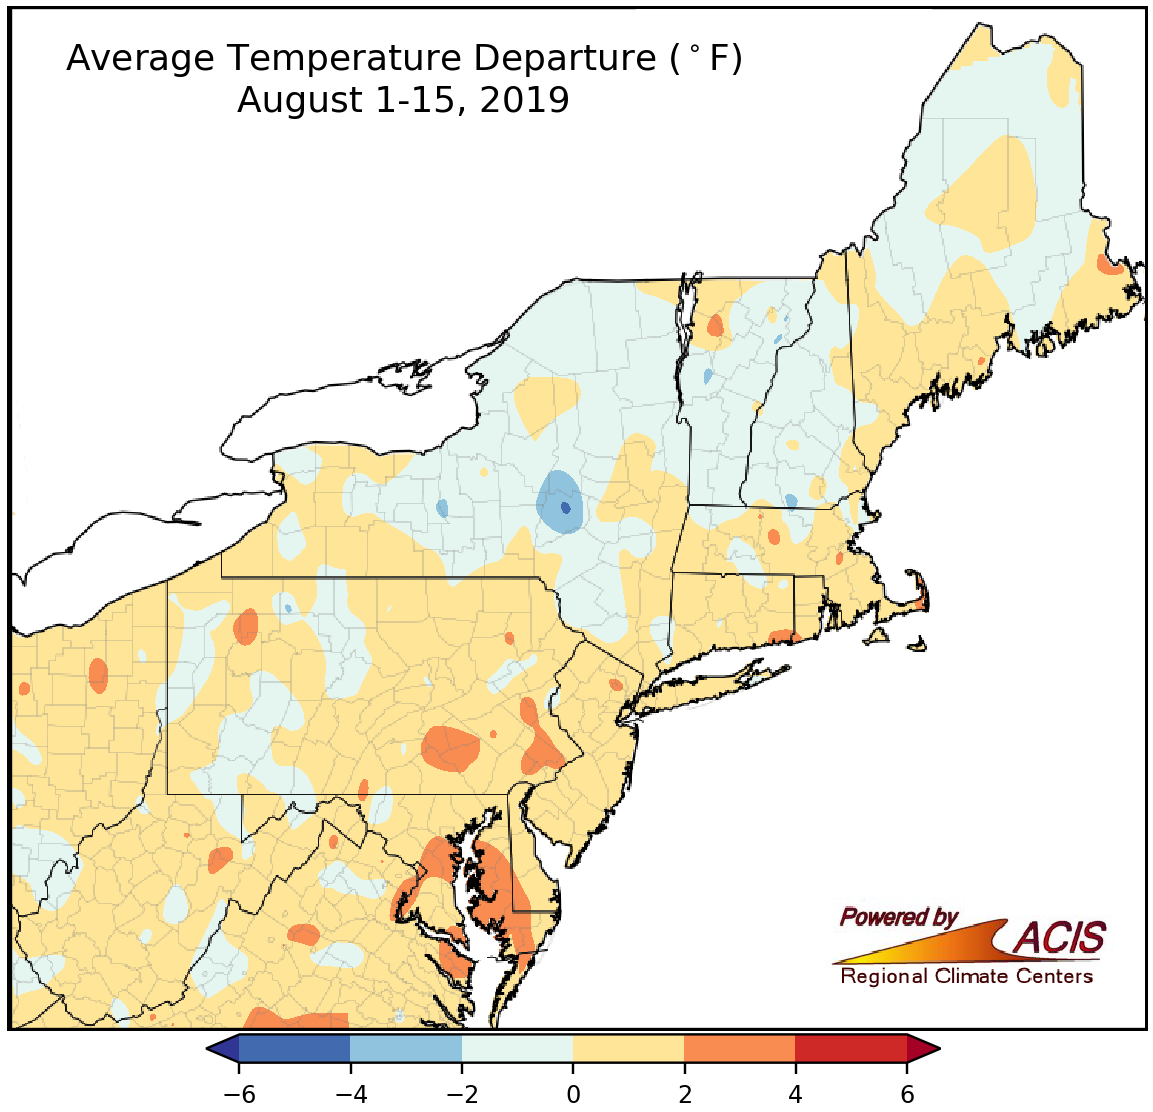
August 1-15 average temperatures generally ranged from more than 2°F below normal to 4°F above normal.
Average temperatures during the first half of August were generally within 2°F of normal, with a few warmer areas, mainly in Pennsylvania and Maryland, that were up to 4°F above normal. Thirty-three of the region’s 35 major climate sites were warmer than normal, with five ranking this August 1-15 period among their top 20 warmest.
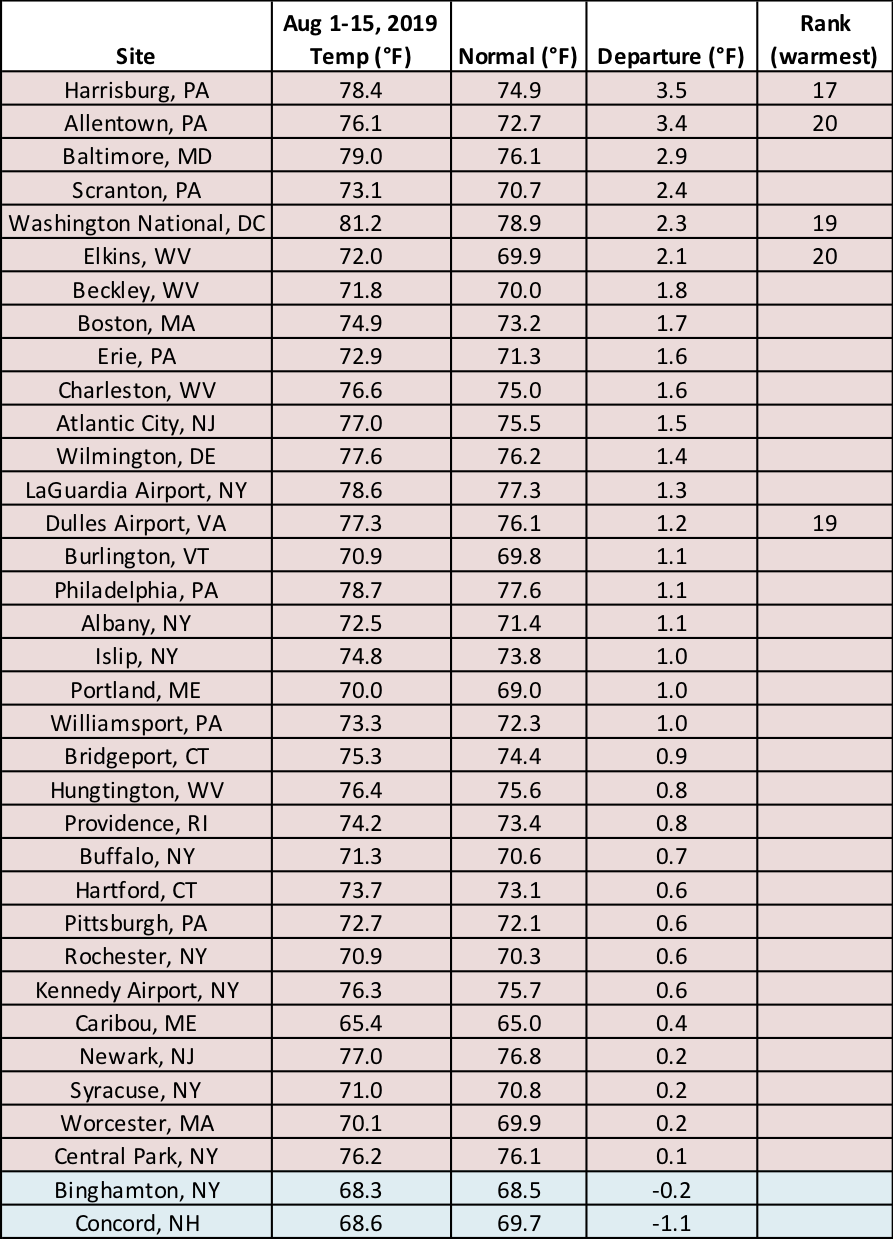
August 1-15 average temperatures ranged from 1.1°F below normal in Concord, NH, to 3.5°F above normal in Harrisburg, PA.