Precipitation Extremes in September
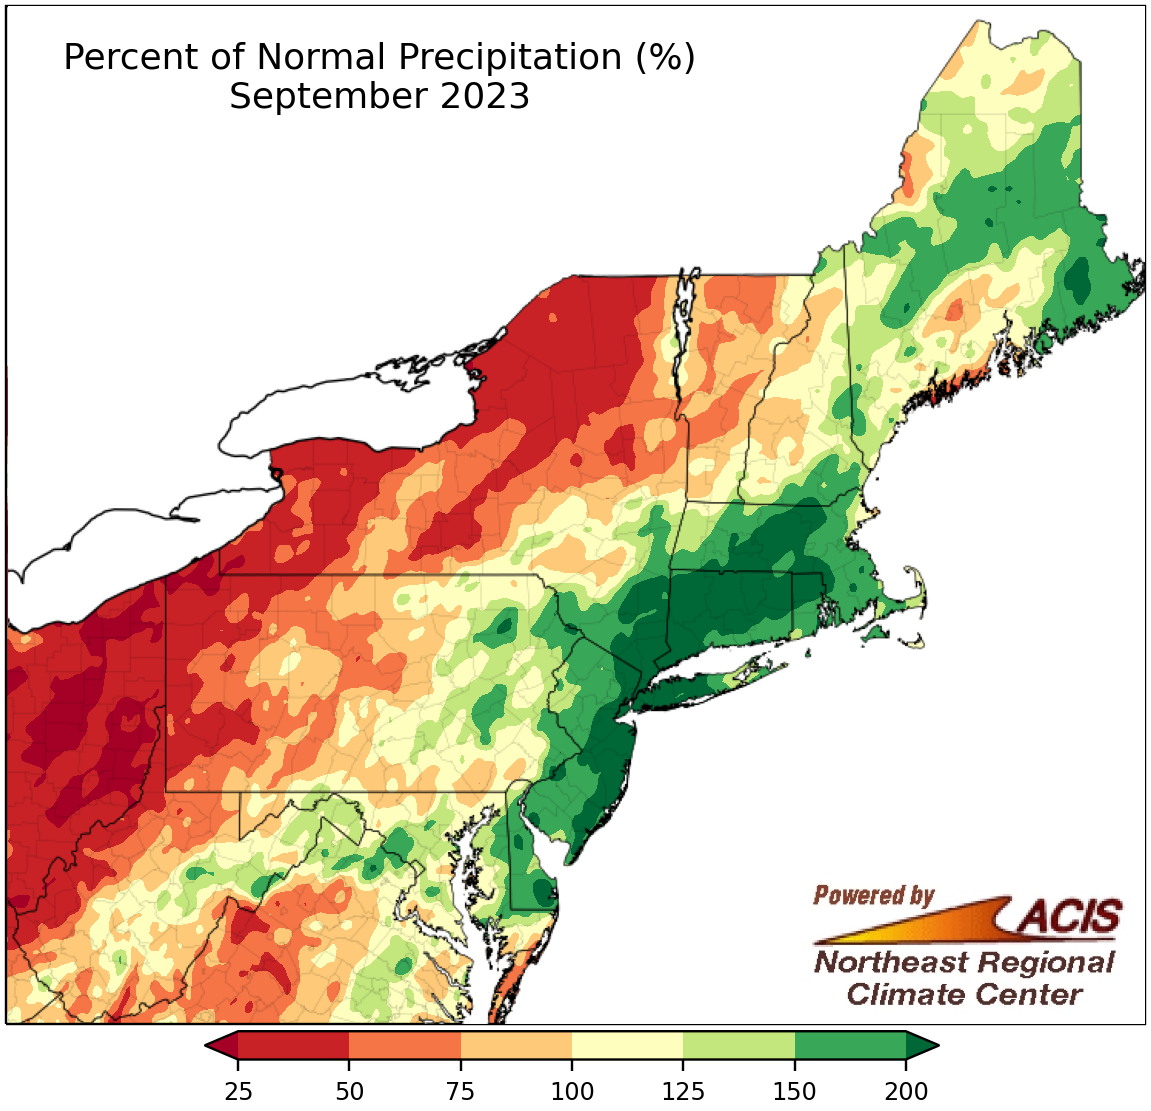
September precipitation ranged from 25% of normal to more than 200% of normal.
September was quite dry for interior areas from western West Virginia to northern New York, which saw less than 50% of normal precipitation. With increasing precipitation deficits and factors such as declining streamflow and soil moisture, abnormal dryness expanded in these areas. Conversely, September was exceptionally wet for multiple coastal sites in an area from Delaware to Massachusetts, which saw more than 200% of normal precipitation. September precipitation at the Northeast’s 35 major climate sites ranged from 43% of normal in Huntington, WV, and Rochester, NY, to 363% of normal at Kennedy Airport, NY, with 24 of the sites being were wetter than normal. This September ranked as the wettest September on record at Kennedy and LaGuardia Airports in New York and was among the 20 wettest Septembers for another 12 major climate sites. In fact, September 2023 was among the six all-time wettest months on record for Kennedy and LaGuardia Airports, as well as Central Park, NY, and Hartford, CT, all of which saw over 12 inches of rain. Much of that rainfall came during a late-month deluge that caused significant flash flooding, particularly in the New York City metro area. September 29 became the all-time wettest day on record at Kennedy Airport, which saw 8.05 inches of rain, and ranked as Central Park’s ninth all-time wettest day with 5.48 inches of precipitation. The day also ranked among the 10 wettest September days for a few other sites.
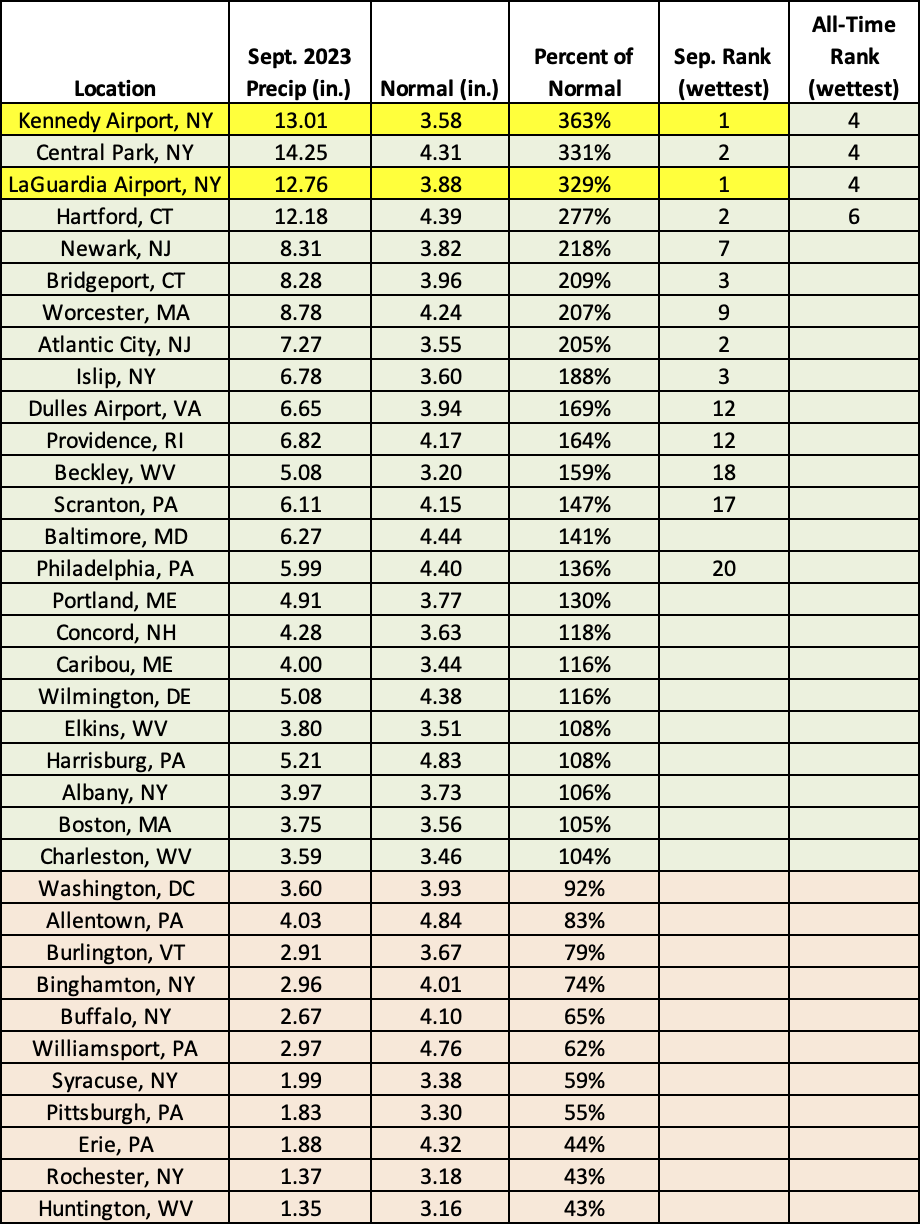
This September was the wettest September on record at Kennedy and LaGuardia Airports in New York and among the 20 wettest Septembers for another 12 major climate sites.
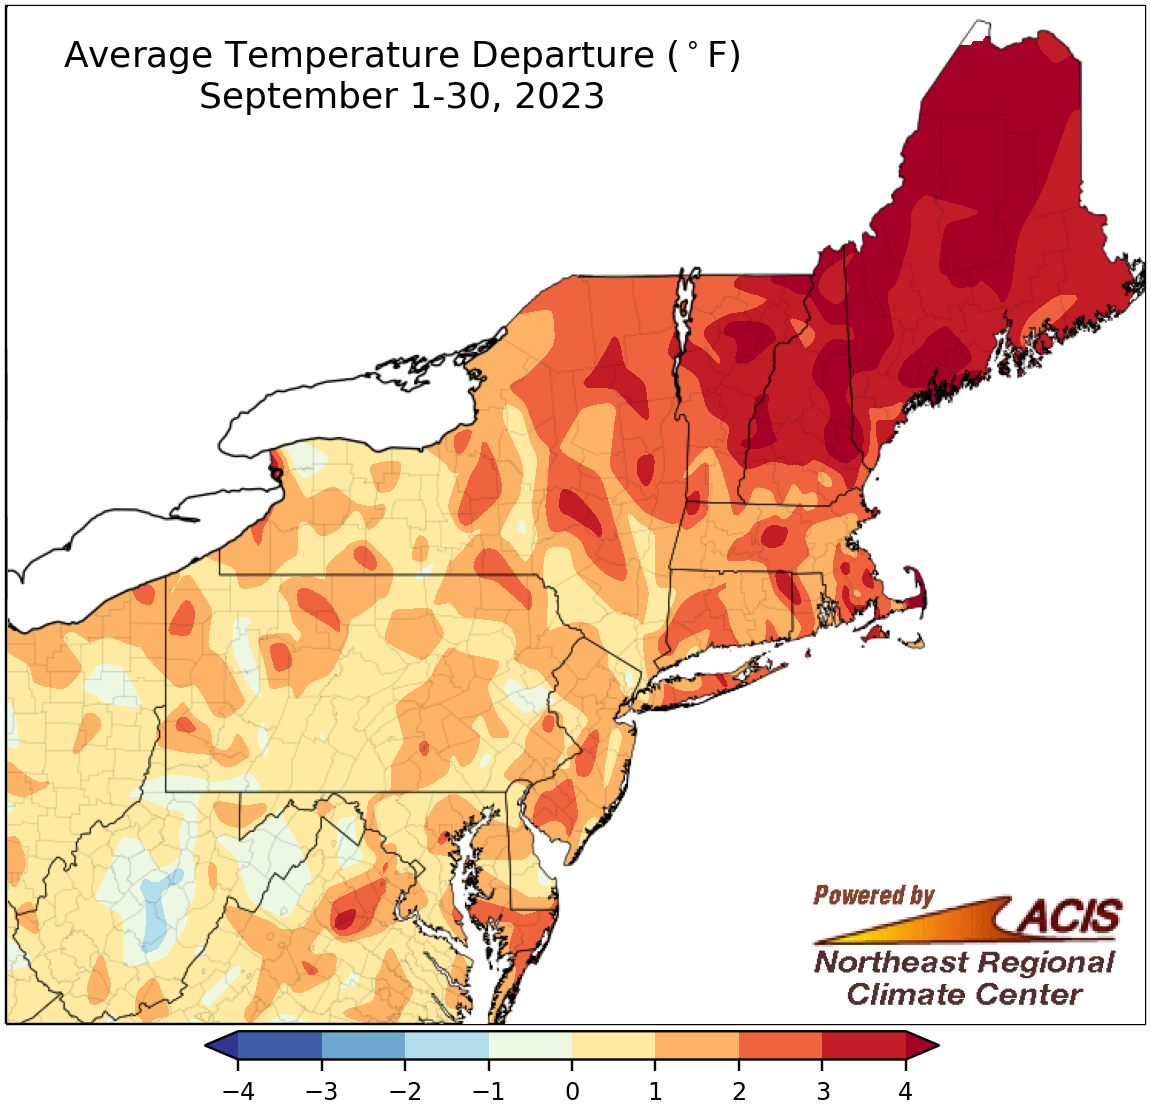
September temperatures ranged from 2°F below normal to more than 4°F above normal.
Much of the Northeast saw near to above-normal temperatures during September, with the largest departures above normal of over 4°F in parts of northern New England. However, a few locations, particularly parts of West Virginia, were cooler than normal by as much as 2°F. September temperatures at the 35 major climate sites ranged from 0.5°F below normal in Allentown, PA, the lone cooler-than-normal site, to 4.3°F above normal in Caribou, ME. This September ranked among the 20 warmest on record for 19 major climate sites. Much of September’s warmth was driven by unusually mild conditions during the first 10 days of the month when high and low temperatures ranked among the 10 warmest on record for September at multiple sites, with a few places experiencing record warmth.
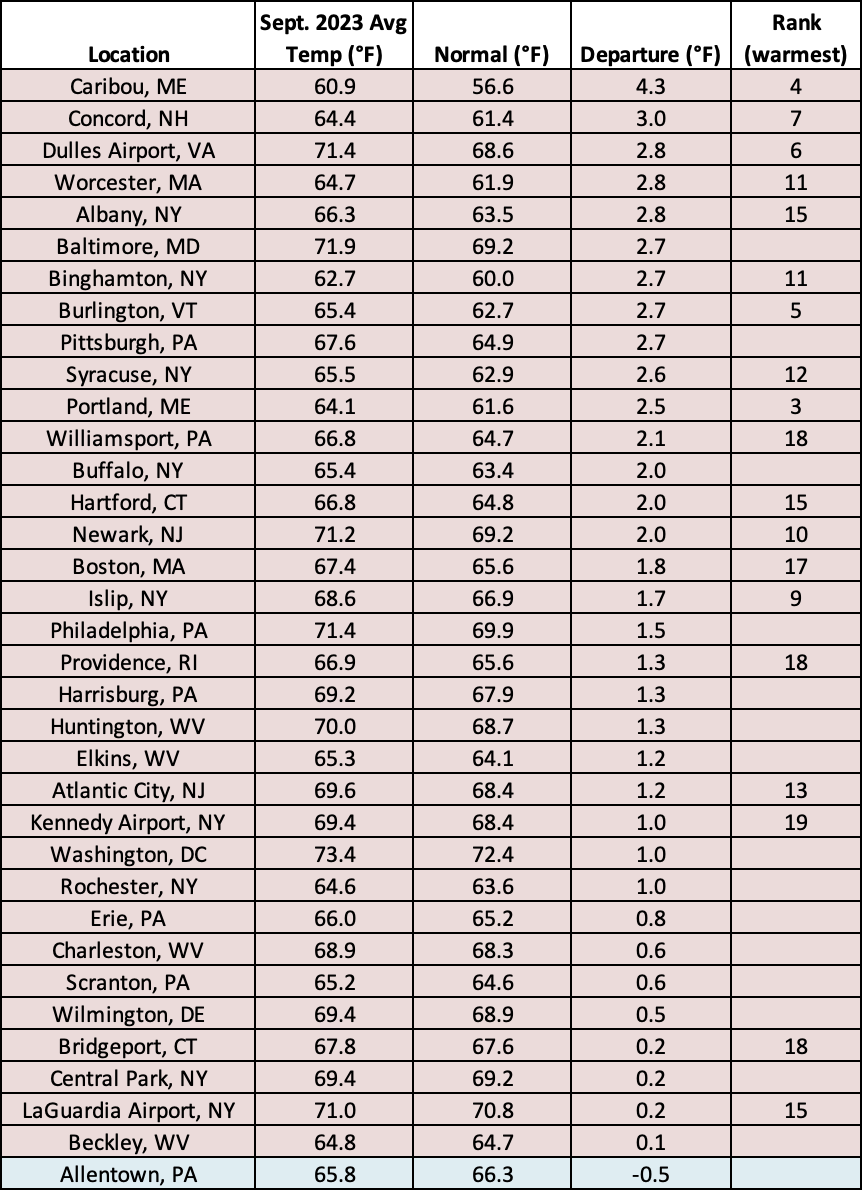
This September ranked among the 20 warmest on record for 19 major climate sites.
The warmth from September is expected to carry over into October, according to NOAA’s Climate Prediction Center which favors above-normal temperatures for the entire Northeast. Below-normal precipitation is also favored for the entire region for October, which should allow soggy areas a chance to dry out but could be concerning for interior areas that are already unusually dry.
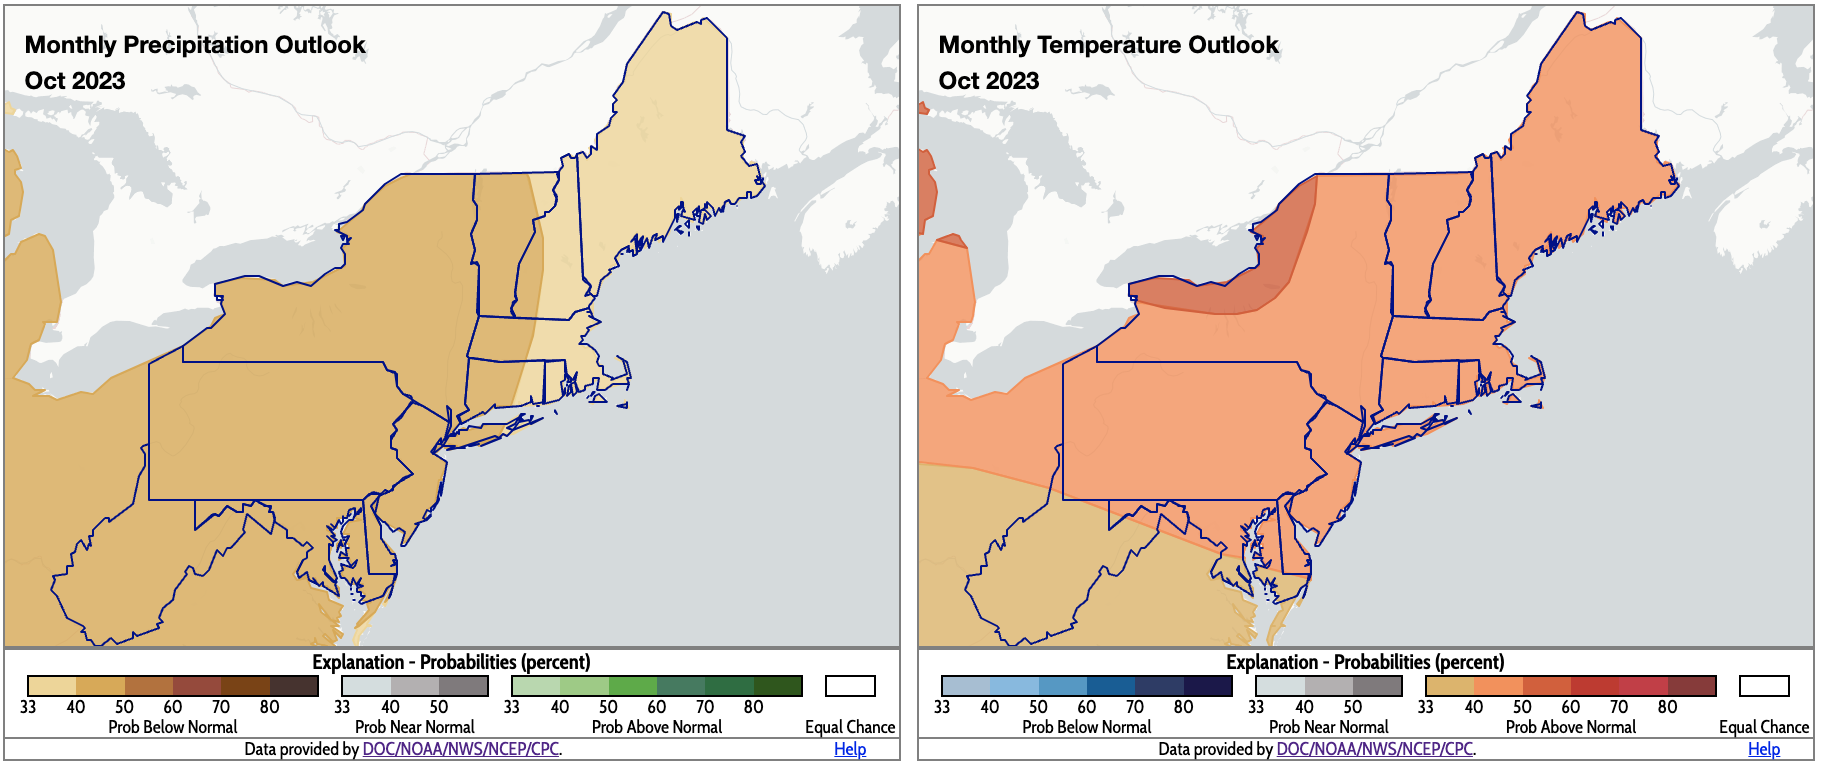
October could be drier and warmer than normal for the entire Northeast. Click to enlarge.