Mid-June - Parched or Soaked
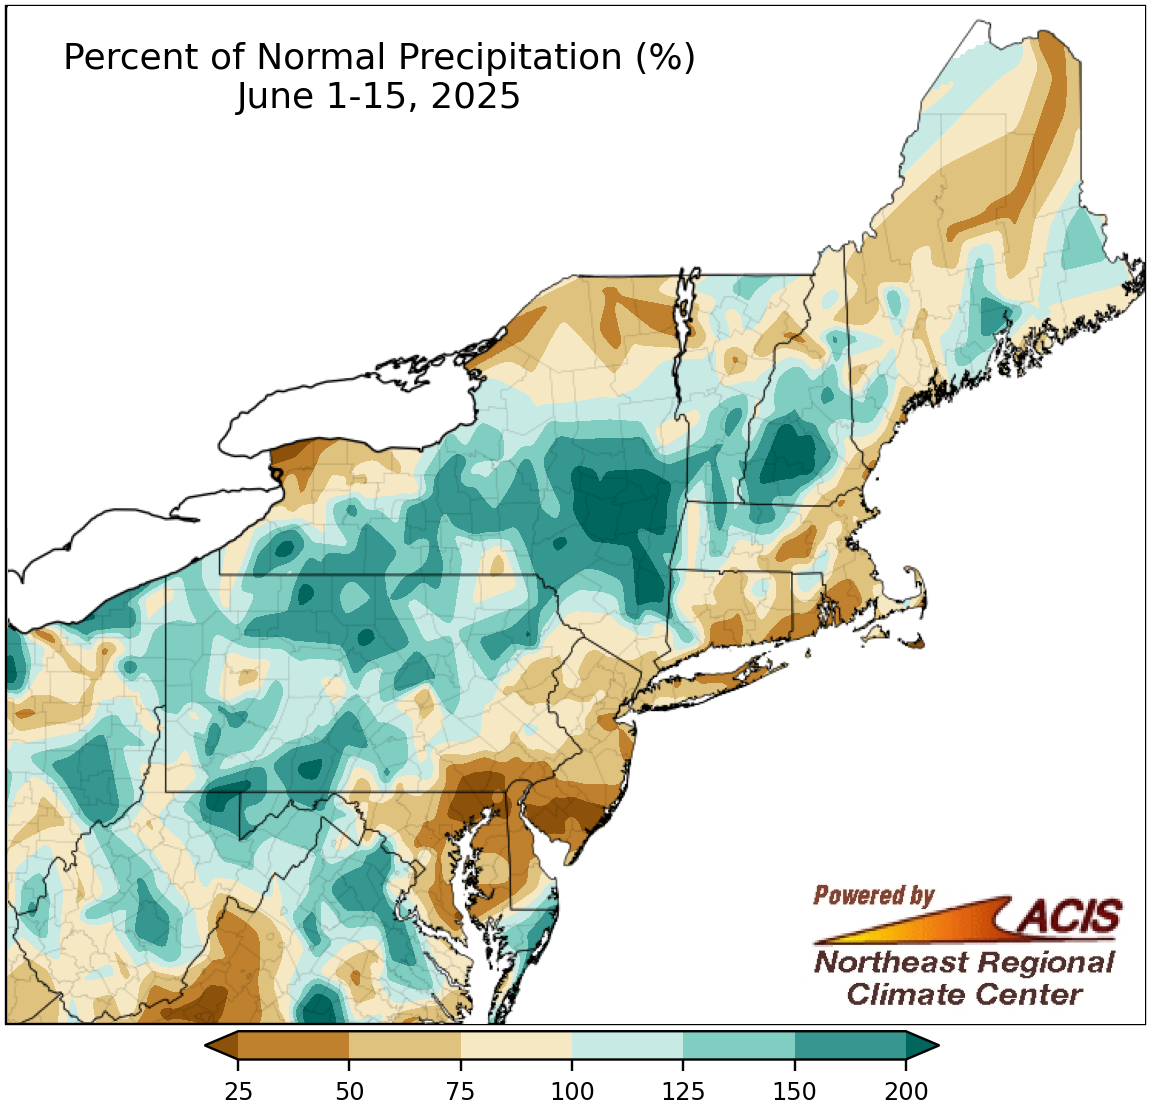
June 1-15 precipitation ranged from less than 25% of normal to over 200% of normal.
Precipitation for the June 1-15 period ranged from less than 25% of normal in places like central Maryland, southeastern Pennsylvania, and southern New Jersey to more than 200% of normal in places like eastern New York and southwestern New Hampshire. During the first half of June, precipitation at the 35 major sites ranged from 15% of normal in Worcester, MA, and Atlantic City, NJ, to 214% of normal at Dulles Airport, VA, with 23 of the sites falling on the dry side of normal. This June 1-15 period ranked among the 20 driest for four major sites but among the 20 wettest for four others.
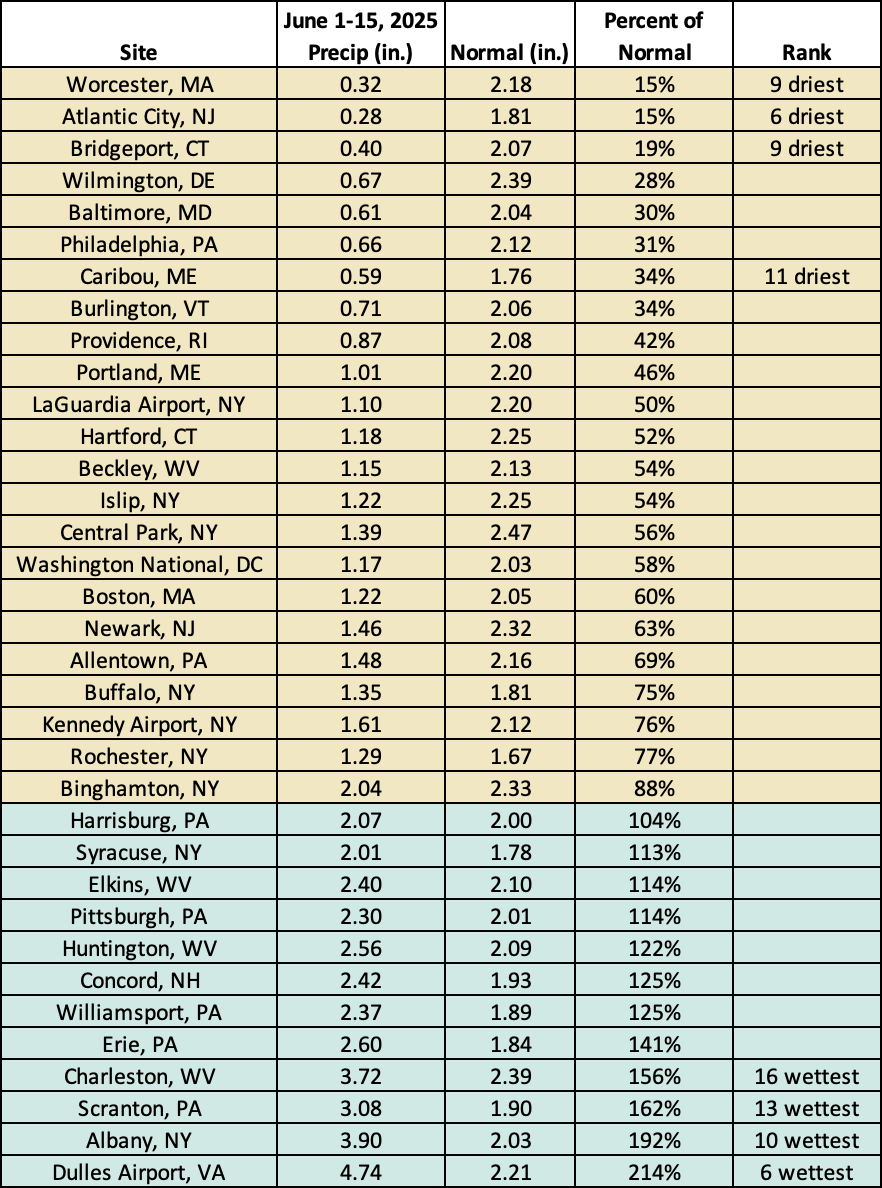
This June 1-15 period ranked among the 20 driest for four major sites but among the 20 wettest for four others.
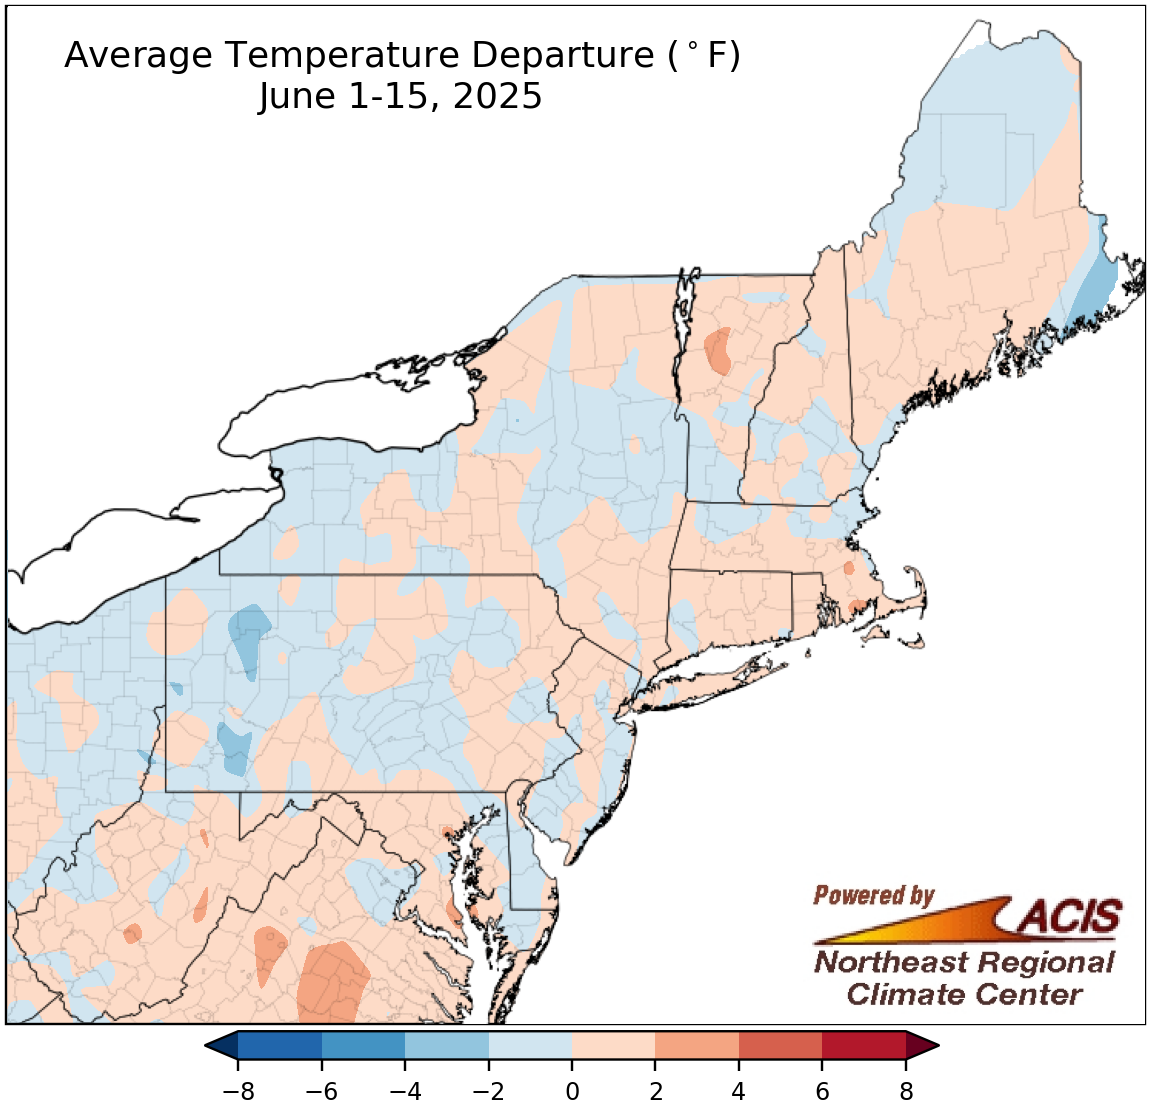
June 1-15 average temperatures were within 2°F of normal for most of the Northeast.
Average temperatures during the first half of June ranged from 2°F below normal to 2°F above normal for a majority of the Northeast. For the region’s 35 major sites, June 1-15 average temperatures ranged from 1.6°F below normal in Allentown, PA, to 2.1°F above normal in Elkins, WV. Eighteen major sites were warmer than normal, with Elkins having its 14th warmest first half of June and Islip, NY, having its 19th warmest.
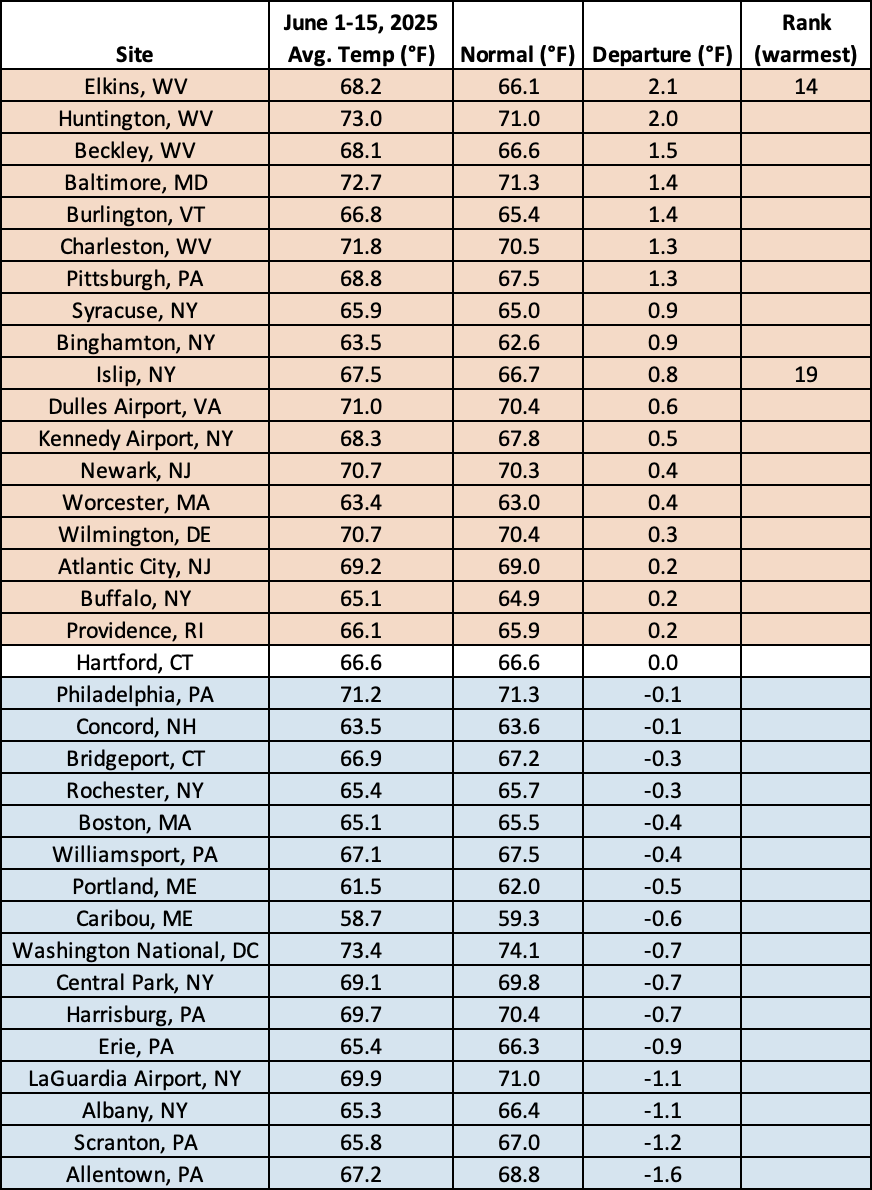
This June 1-15 period ranked among the 20 warmest for two major climate sites.