Excessive Rainfall During the First Half of July
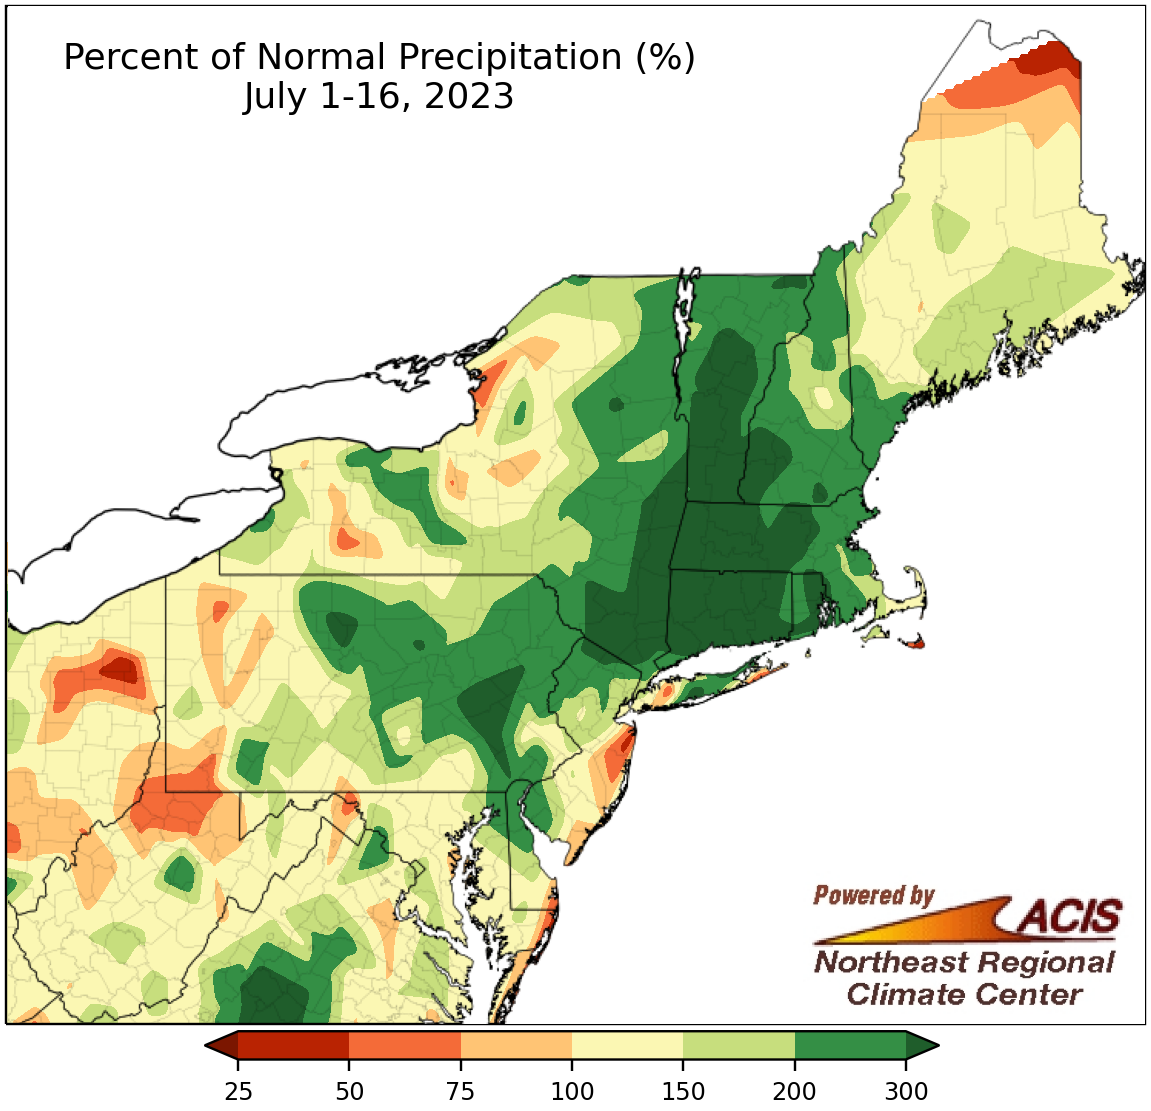
July 1-16 rainfall ranged from near normal to more than 300% of normal for much of the Northeast. Note that map scale is different than usual.
The first roughly two weeks of July were soggy for much of the Northeast, with an area stretching from northern Delaware and Pennsylvania through northern New Jersey and eastern and northern New York into much of New England seeing more than 200% of normal rainfall. In fact, multiple parts of interior New England, southeastern New York, and southeastern Pennsylvania saw more than 300% of normal precipitation. With half the month left to go, this July is already among the 20 wettest July on record for nine major climate sites including Providence, RI, with its third wettest July as of July 16.
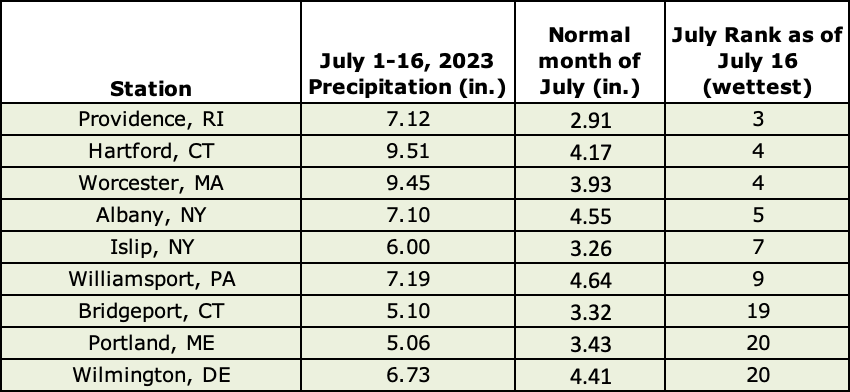
This July will be among the 20 wettest Julys on record at nine major climate sites, with another two weeks left in the month.
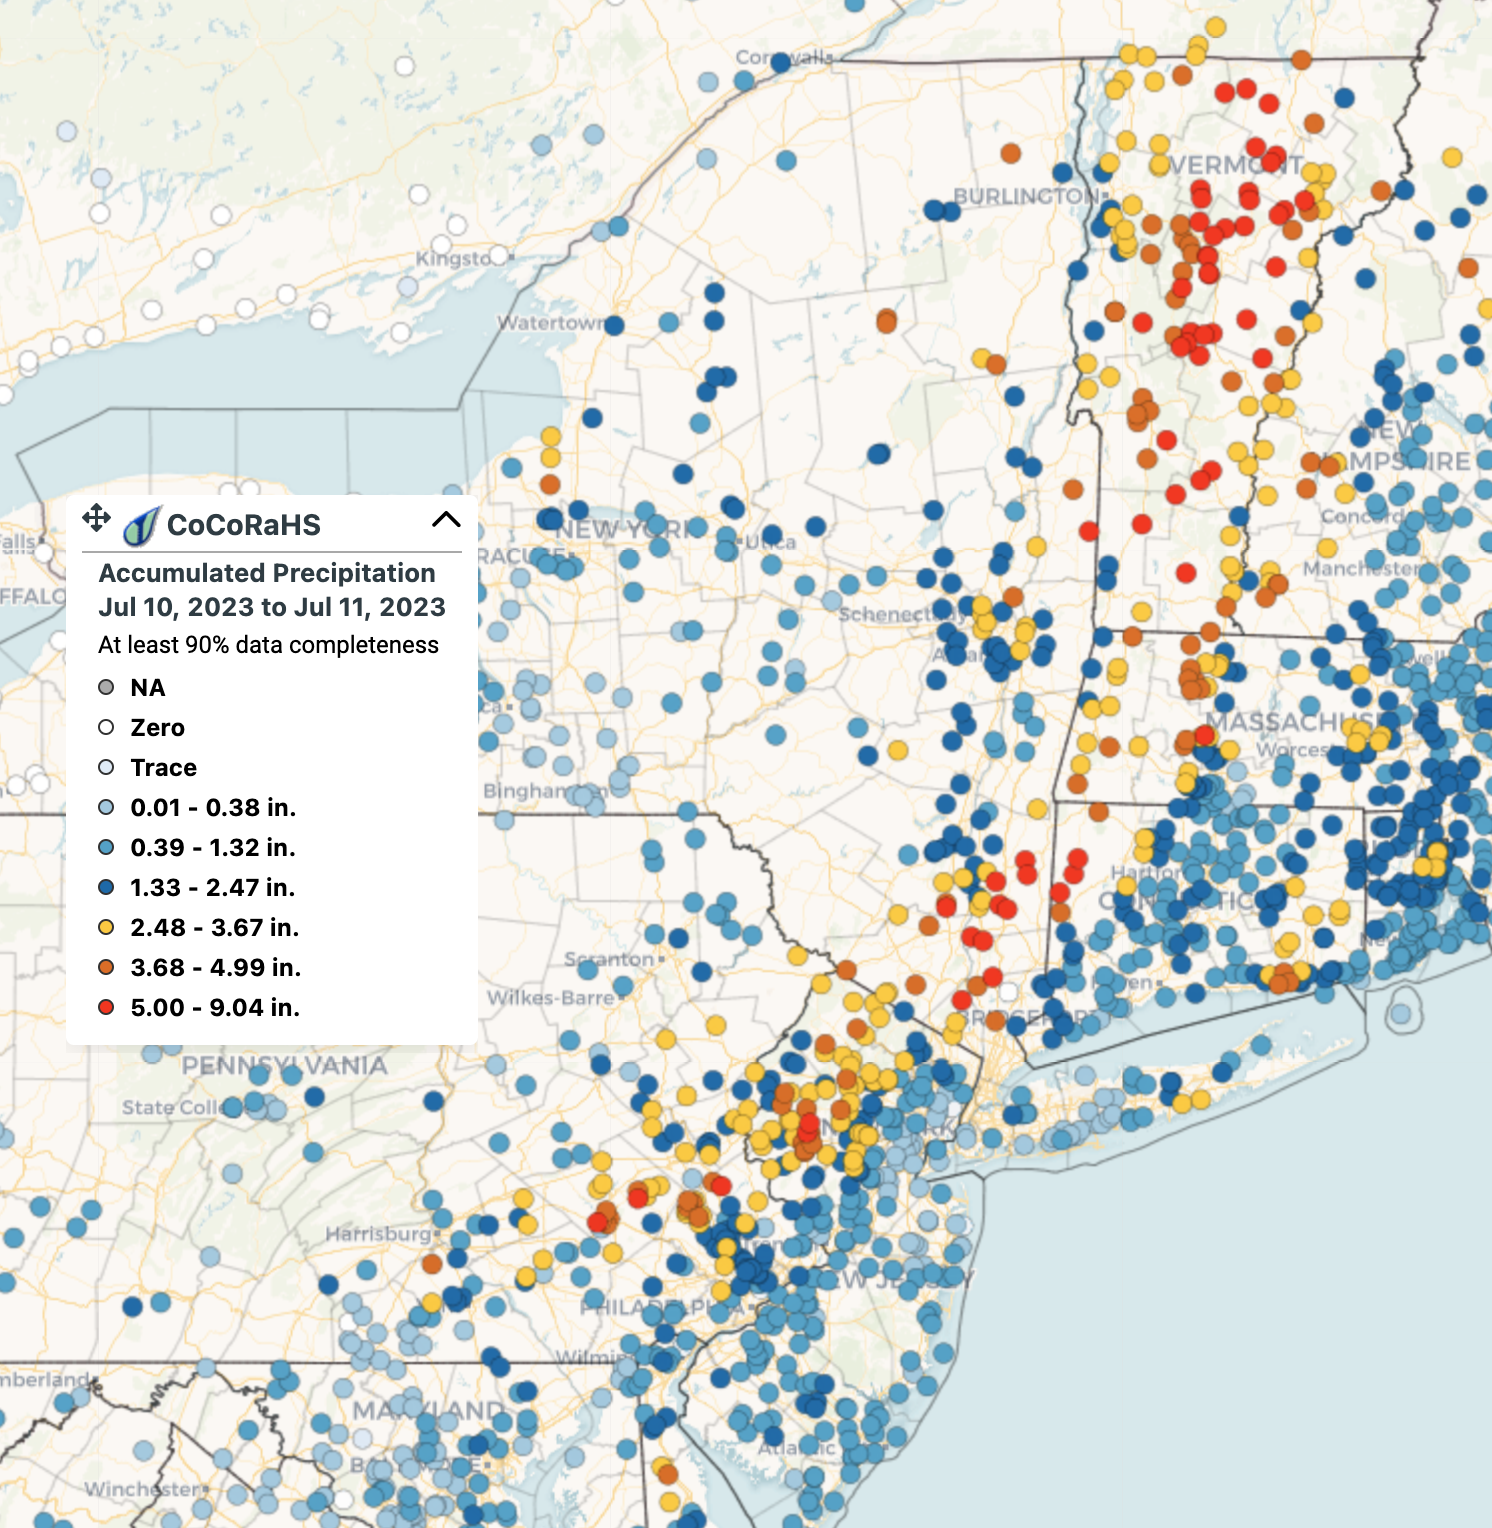
July 10 to 11 rainfall totals from CoCoRaHS. Red dots indicate at least 5 inches of rain. Credit: CoCoRaHS.
For some areas, a large portion of that rain came during an extreme rainfall event from July 9 to 11. Two areas in particular, the state of Vermont and New York’s Hudson Valley, saw some of the heaviest rain, between 5 and 9 inches. A CoCoRaHS site near Middlesex, VT, saw 8.03 inches of rain in two days, qualifying as a 500-year storm event. This means an event of this magnitude would have a 0.2% chance of occurring in a given year. Preliminary data indicates that Middlesex’s two-day rainfall total is the greatest two-day rainfall total for July in Vermont, with several other CoCoRaHs sites rounding out the top 10.
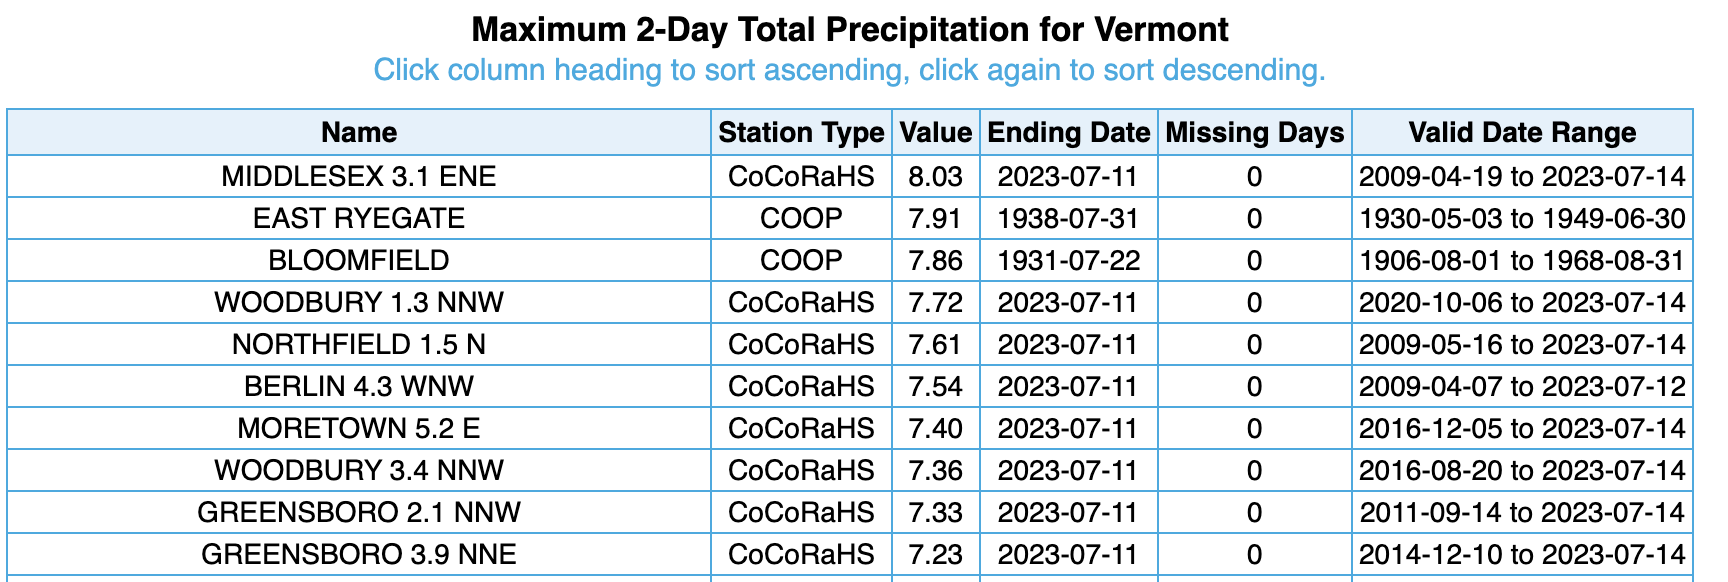
The 10 greatest two-day rainfall totals for July in Vermont. The rainfall from July 10 to 11 occupies the top spot, as well as several of the top 10 spots.
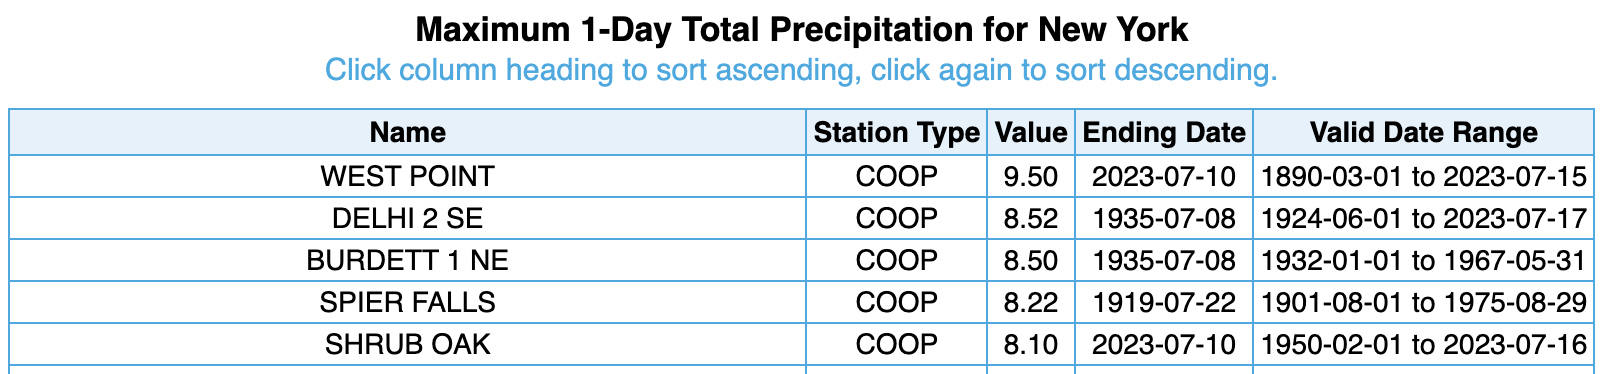
The five greatest daily rainfall totals for July in New York. Rainfall on July 10 ranked as the greatest and fifth greatest.
Meanwhile, the NWS COOP site in West Point, NY, saw 9.50 inches of rain in a day, a 200-year storm event with a 0.5% chance of occurring in a given year. That single day rainfall amount is more than the site typically sees in all of June and July combined. Preliminary data indicates that West Point’s rainfall for July 10 ranks as the greatest daily rainfall total for July in New York, with another COOP, Shrub Oak, having the fifth greatest.
Southeastern Pennsylvania also saw excessive rainfall. For instance, Reading, PA, was inundated by 4.04" of rain in three hours, exceeding a 100-year storm event with a 1% chance of occurring in a given year.
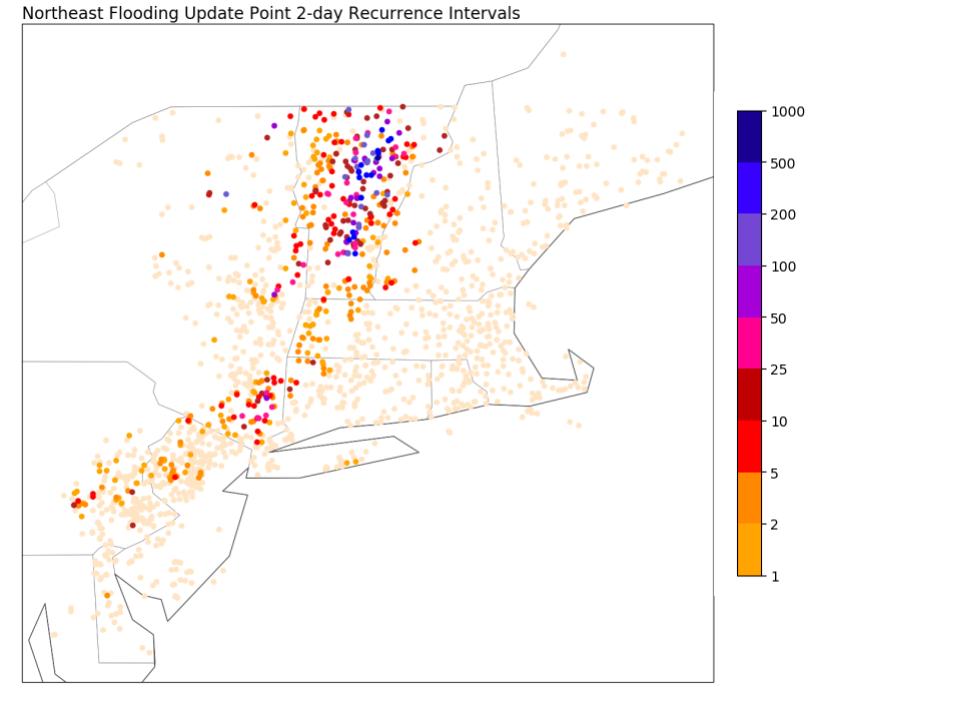
Recurrence intervals for 48-hour rainfall totals during the extreme rainfall event from July 9 to 11. Purple dots correlate to 50- and 100-year storm events, while blue dots represent 200- and 500-year storm events. Credit: Jacob Feuerstein and NRCC.
Both Vermont and southeastern New York saw devastating flooding, with a rare Flash Flood Emergency issued for a few areas, signifying a dangerous, life-threatening situation. Several waterways in Vermont reached major flood stage, with water levels at a few locations reaching their five highest on record. For instance, preliminary data shows that the Winooski River at Montpelier crested at 21.35 feet, its second highest level since records began in the early 1900s. The Lamoille River at Johnson and Otter Creek at Rutland reached similar milestones. There were significant flooding impacts in Vermont and southeastern New York. Floodwaters inundated roads and buildings, trapping people, with over 100 rescues in Vermont. Some Vermont roads remained closed as of July 17, with chunks of some roads washed away. Notable flooding and impacts also occurred in other areas that saw extreme rainfall or were downstream from those areas including eastern Pennsylvania, western Connecticut, and western Massachusetts.
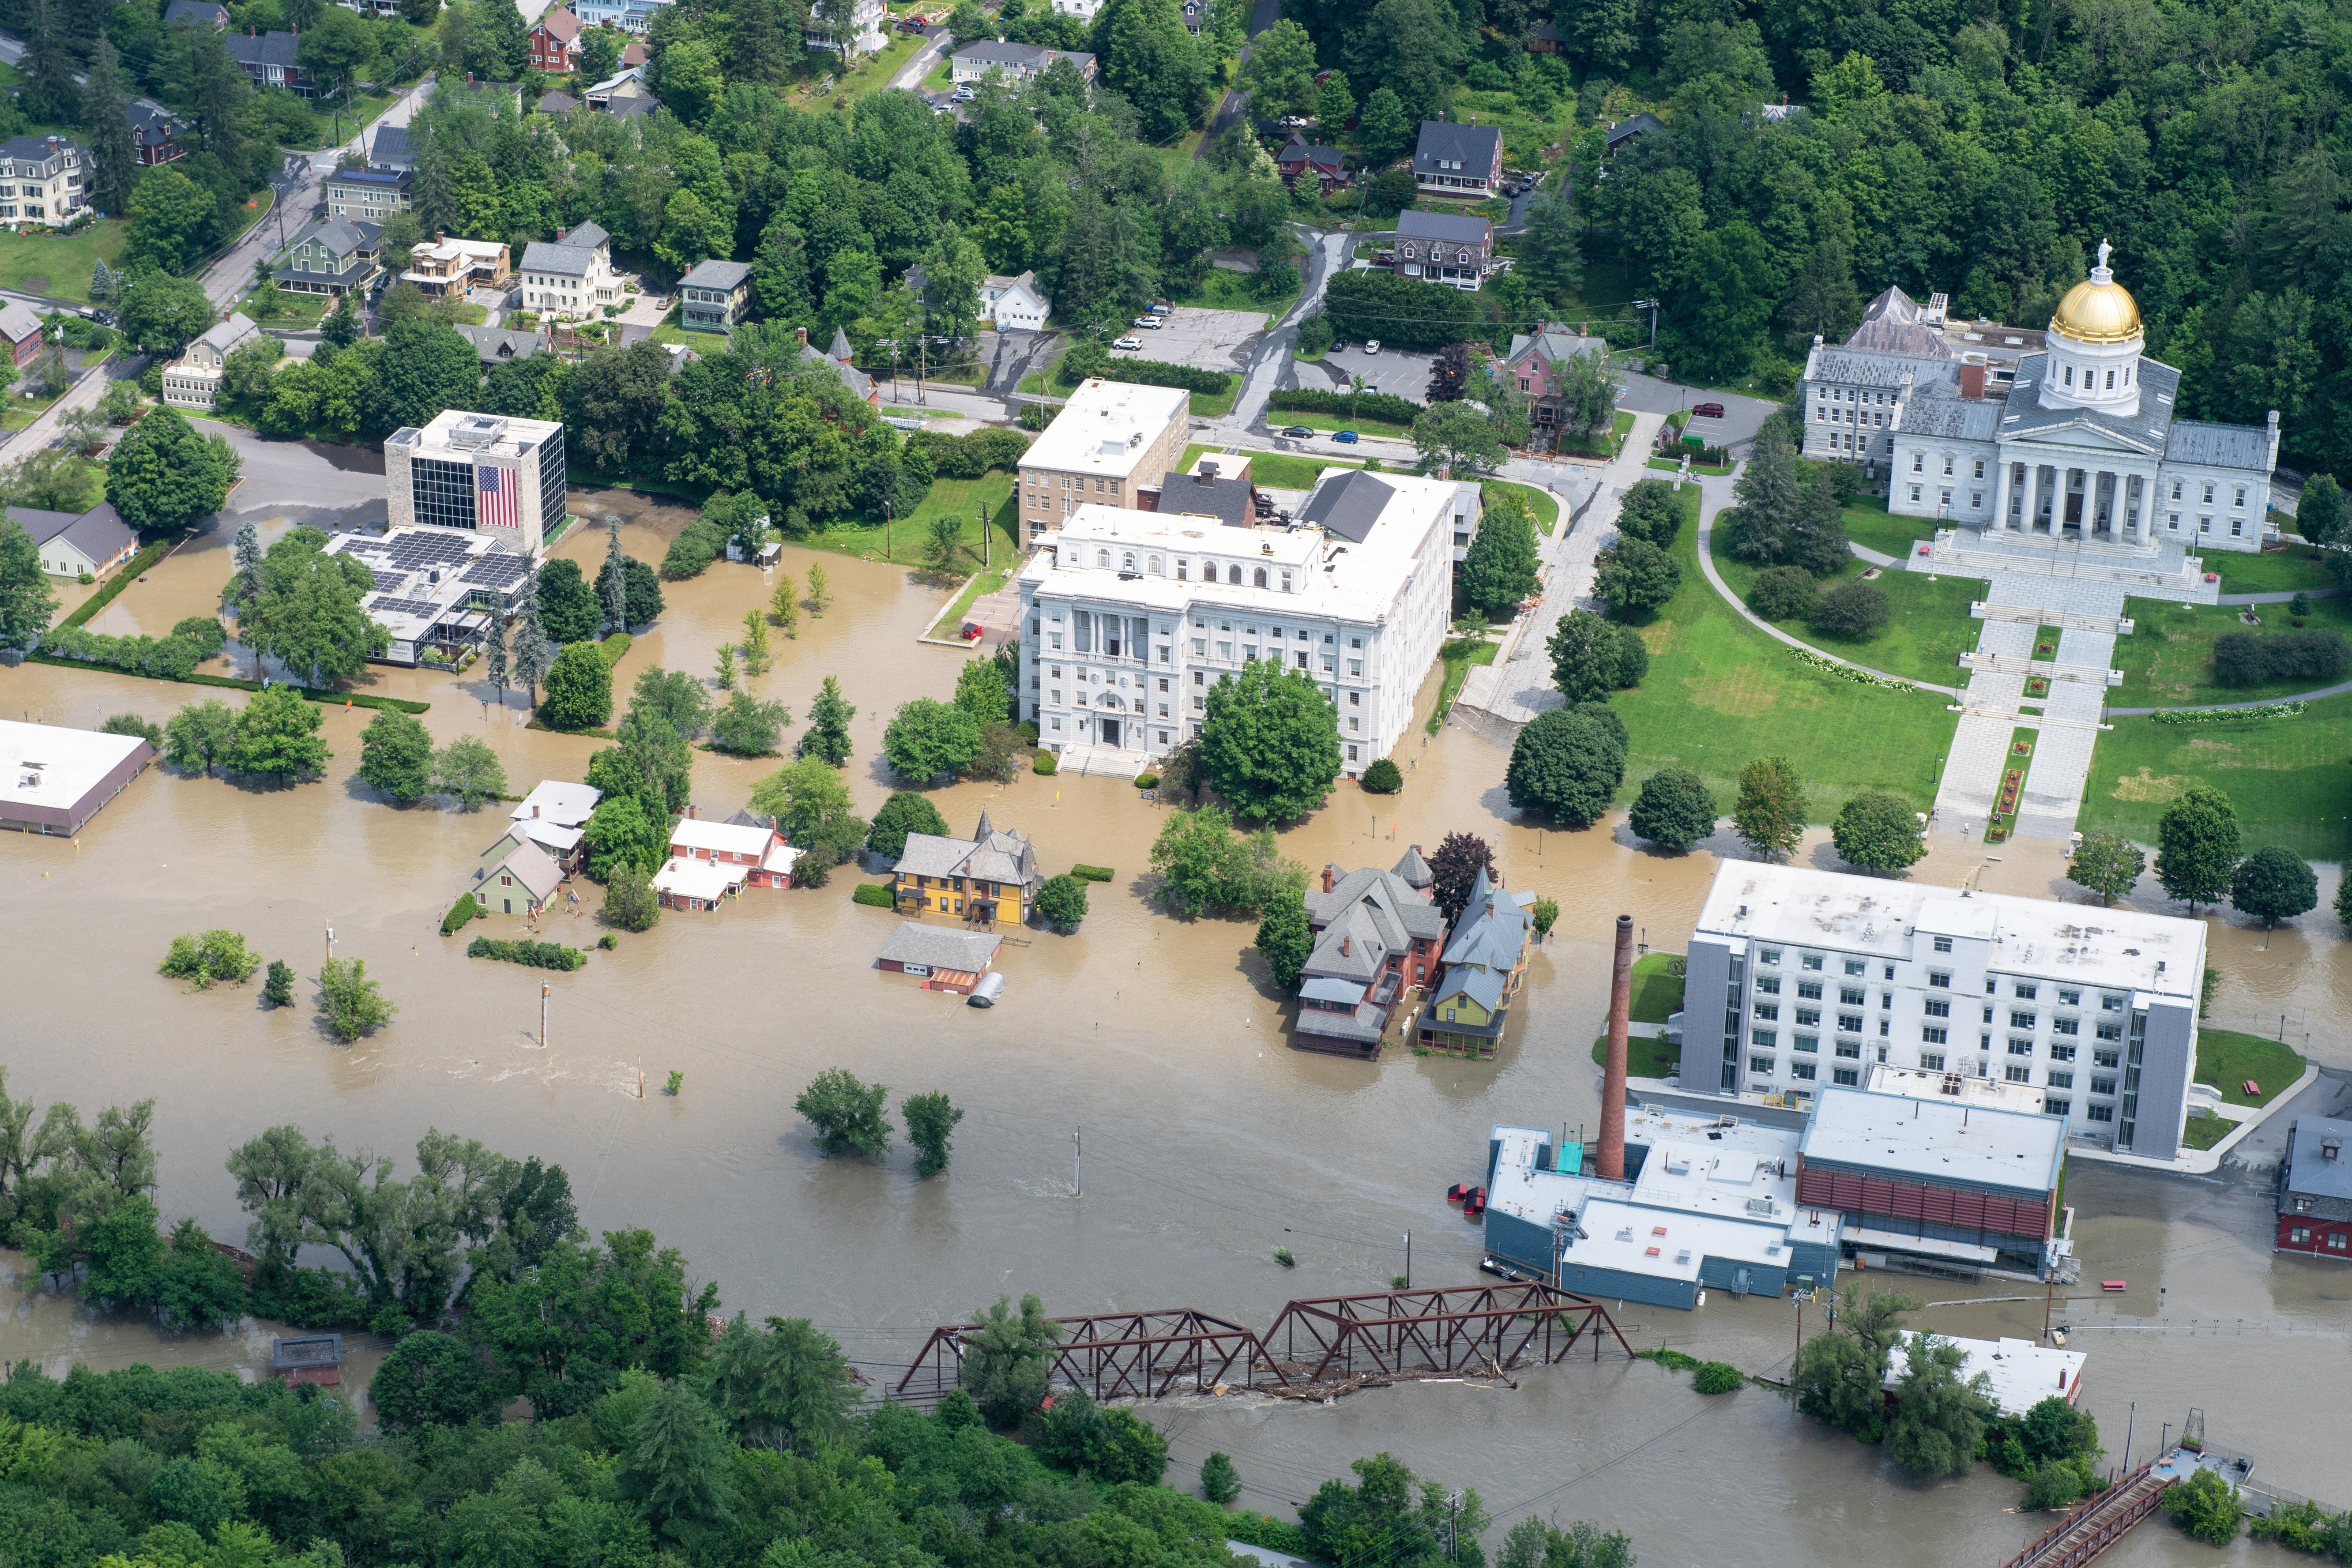
Floodwaters engulf Montpelier, VT. Credit: U.S. Department of Defense/Air Force Senior Master Sgt. Michael Davis.
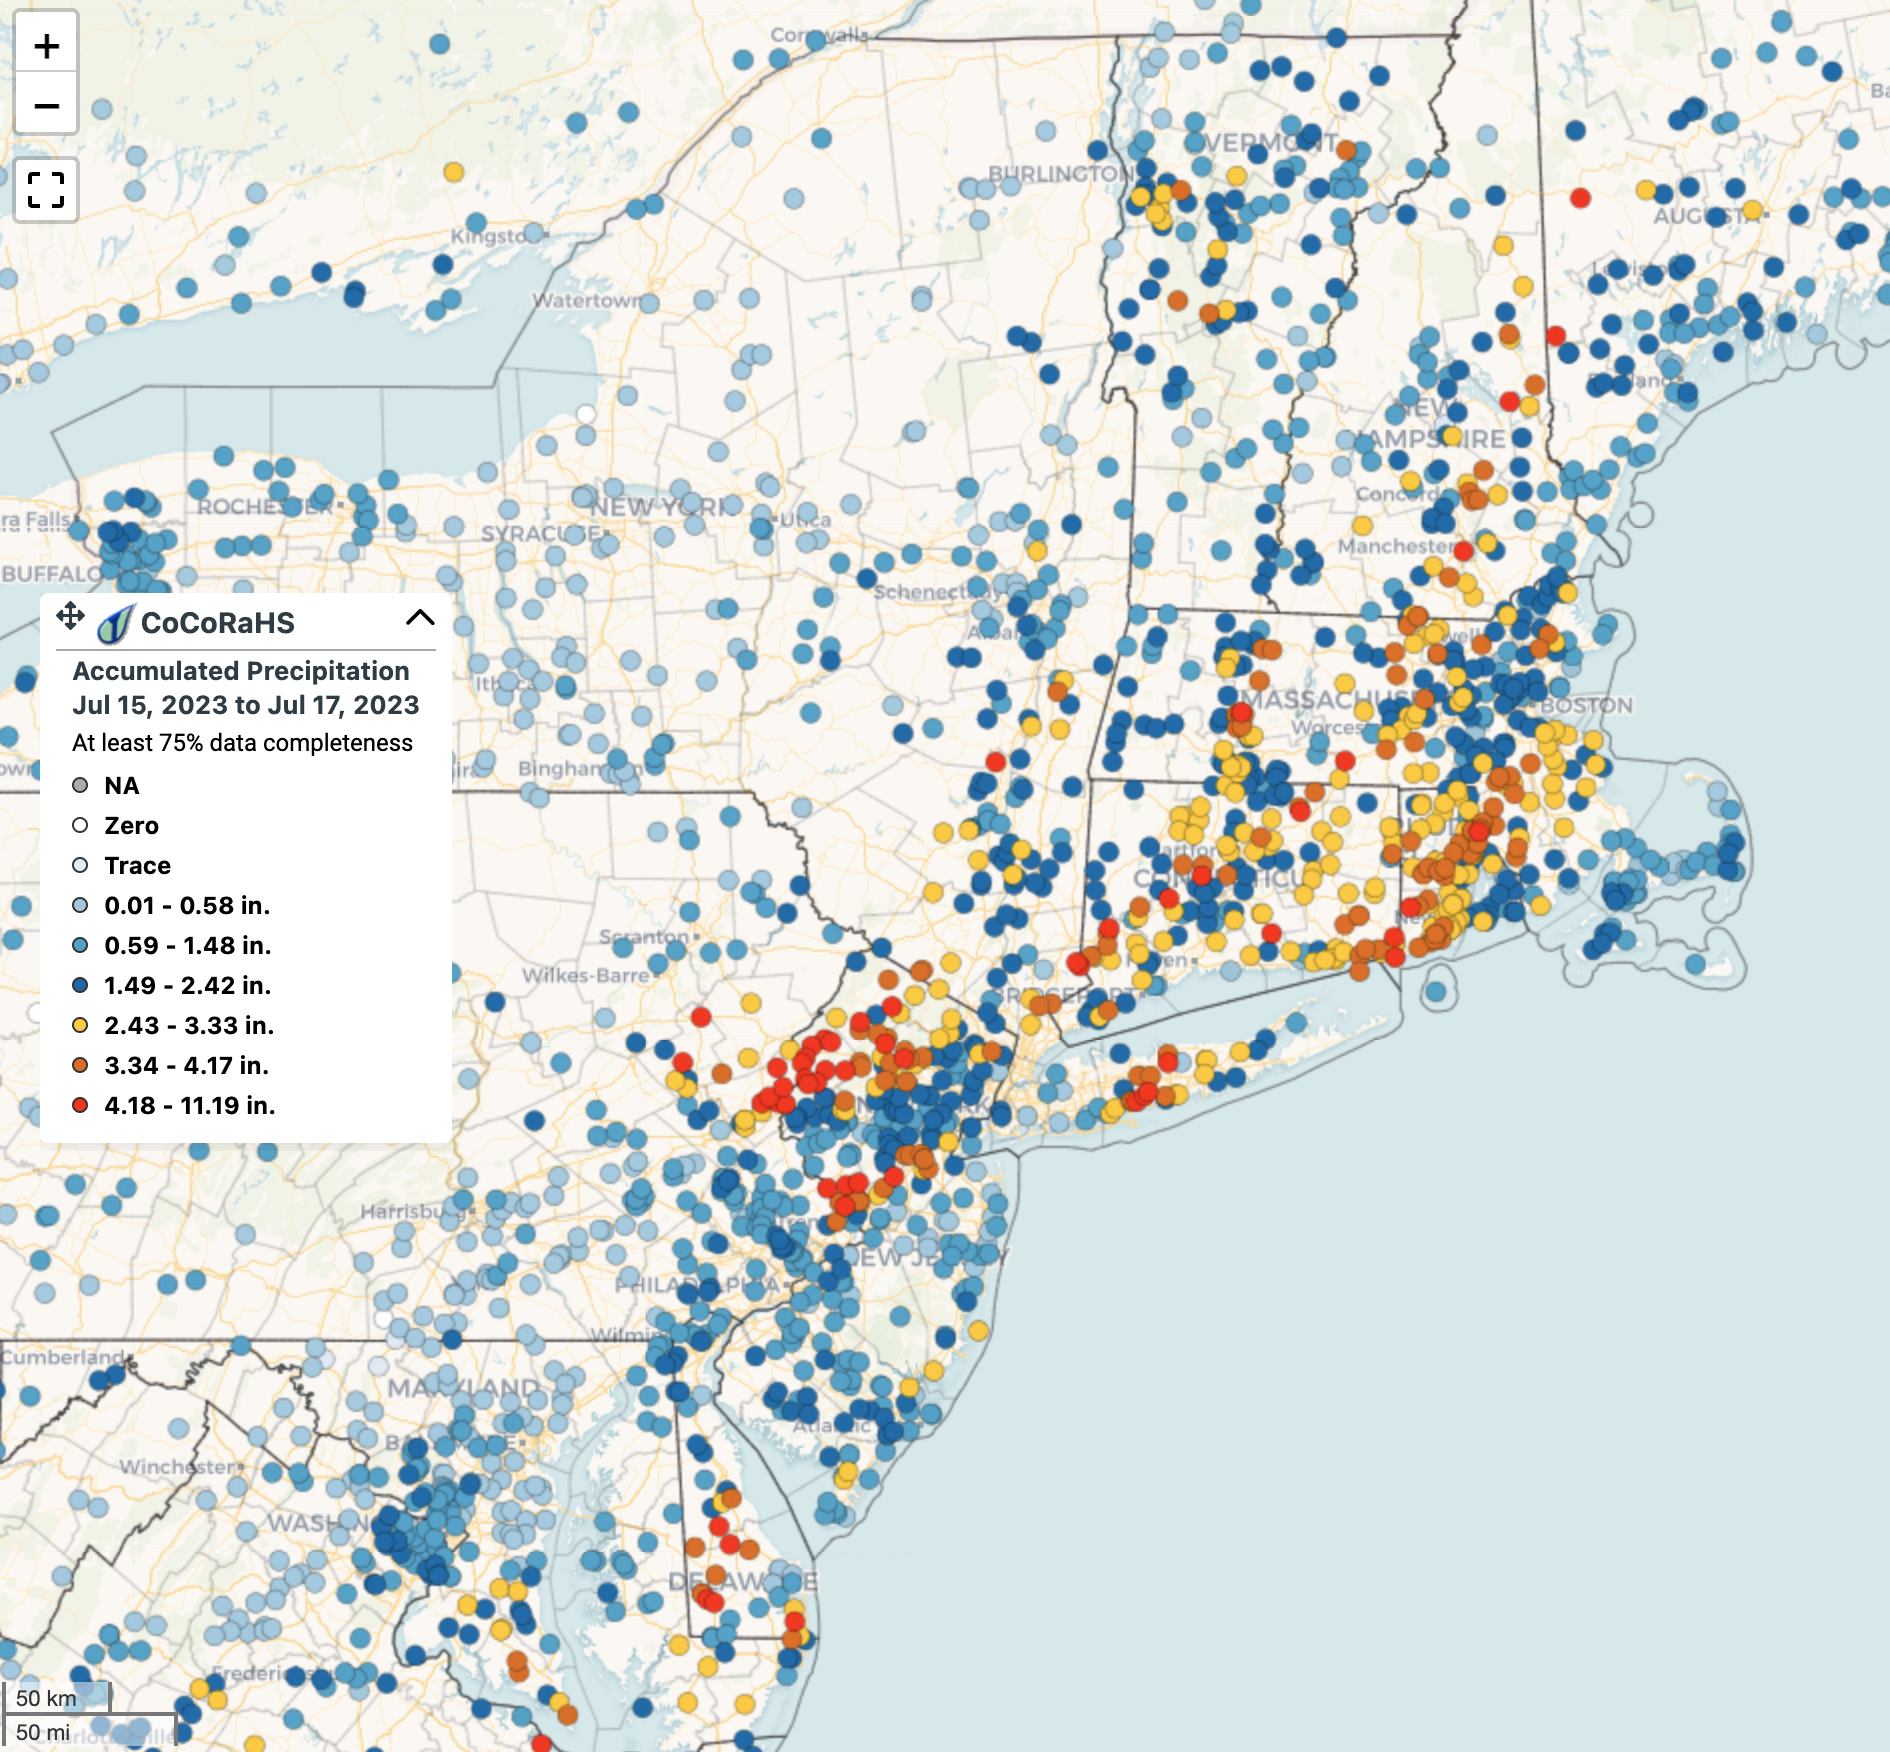
July 15 to 17 rainfall totals from CoCoRaHS. Credit: CoCoRaHS.
With wet antecedent conditions and several rounds of extreme rainfall, multiple parts of the Northeast have experienced flooding at other times during the month. For instance, another round of significant flash flooding occurred from July 15 to 17. Between 4 and 8 inches of rain fell in parts of eastern Pennsylvania, where floodwaters swept away vehicles resulting in at least five deaths. Meanwhile, 5.23 inches of rain fell in two hours on New York’s Long Island, easily surpassing a 200-year storm event, and heavy rain washed away chunks of roads in parts of New Hampshire where as much as 6.50 inches of rain fell.