September So Far - Soggy for Some, Warm for All
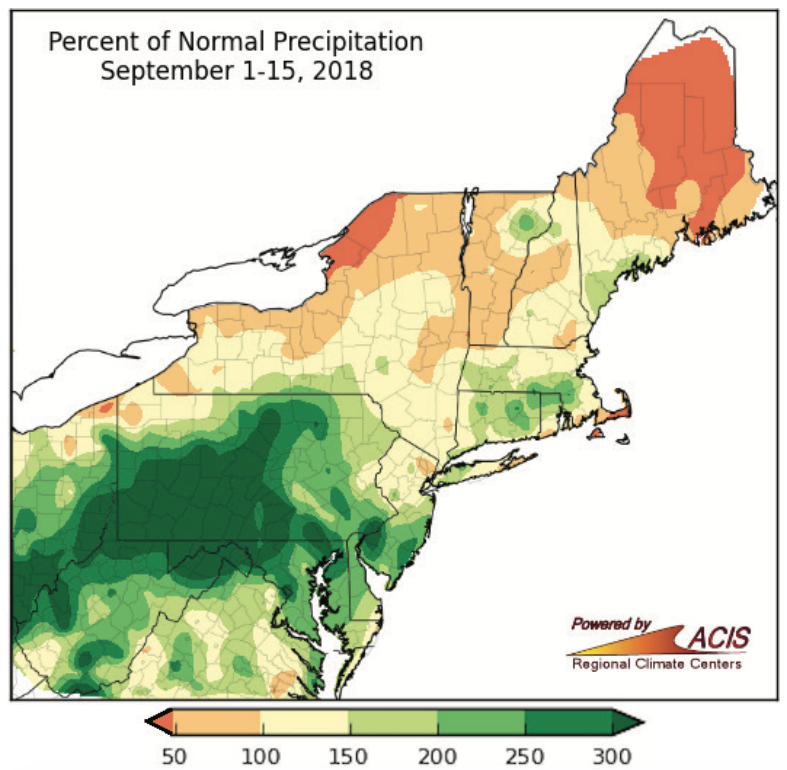
Precipitation during the first half of September was variable, with some dry areas (shaded orange) and some very wet areas (shaded dark green).
September 1-15 precipitation ranged from less than 50% of normal in parts of Maine, southeastern Massachusetts, and northern New York to more than 300% of normal in parts of Pennsylvania, West Virginia, and the Mid-Atlantic. Charleston, WV; Beckley, WV; and Pittsburgh, PA, had their wettest first half of September on record. Another 15 major climate sites ranked the period among their 20 wettest starts to September. The heavy rain triggered flooding in some of these locations, and Tropical Depression Florence could cause more flooding.
On the other hand, drought lingered across parts of northern New York and northern New England. The dry conditions affected crops in Vermont and Maine. For Caribou, ME, it was the fourth driest start to September.
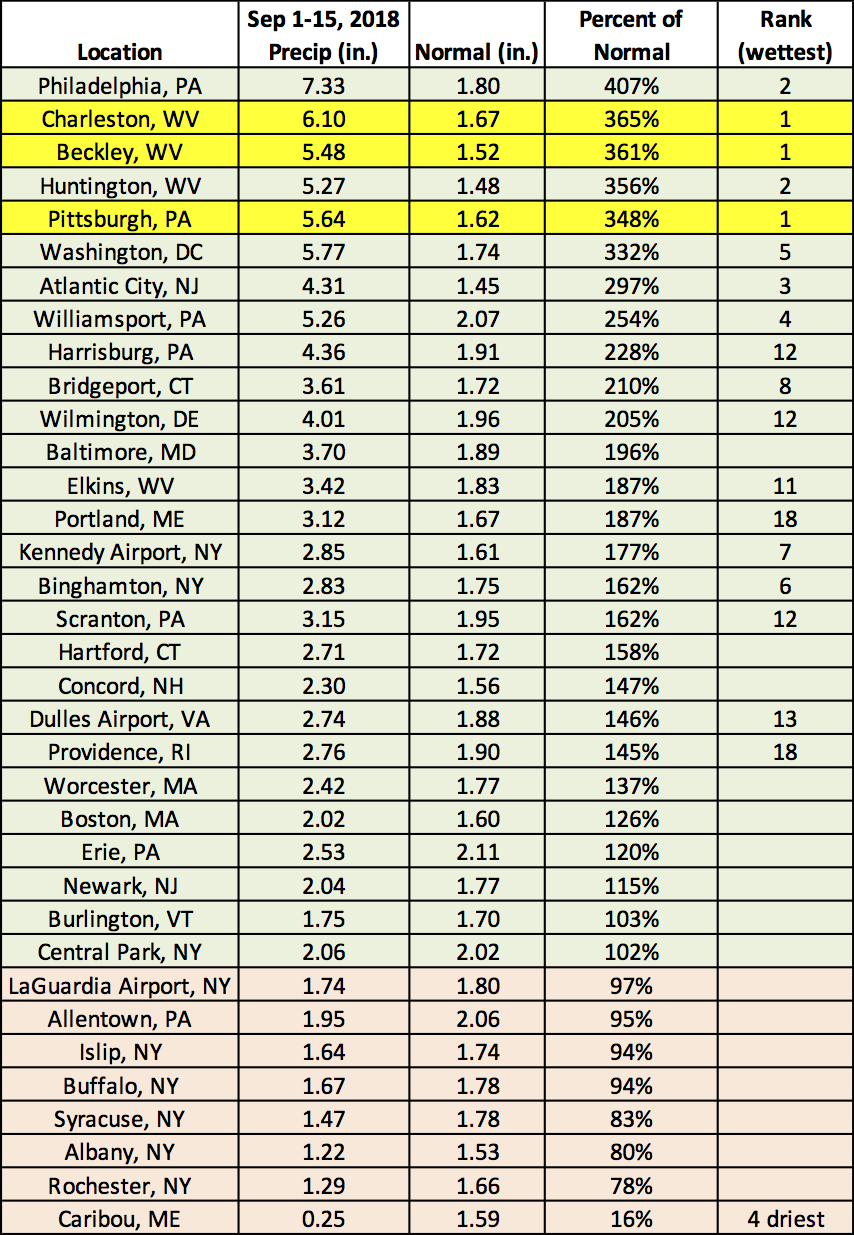
At the major climate sites, September 1-15 precipitation ranged from 16% of normal in Caribou, ME, to 407% of normal in Philadelphia, PA.
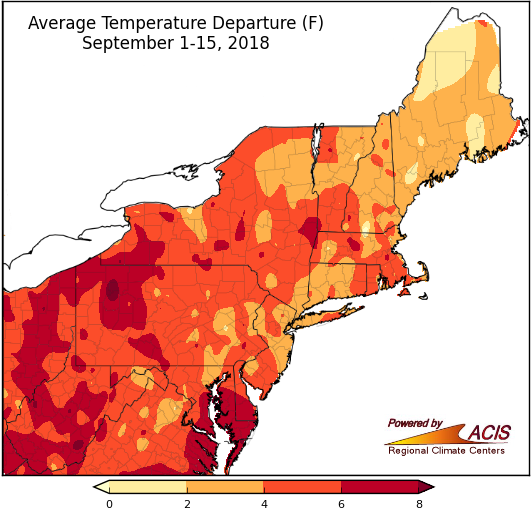
The entire Northeast experienced above-normal temperatures during the first half of September.
During the first half of September, average temperatures ranged from 2°F to 8°F above normal for almost the entire Northeast. This was due in part to a warm spell the first few days of the month, with high temperatures topping out in the 90s for many areas. In fact, Erie, PA, has already tied their greatest number of September days with a high of at least 90°F (4 days). All but one of the 35 major climate sites ranked this first half of September among their 20 warmest.

At the major climate sites, September 1-15 temperatures ranged from 2.4°F above normal at Central Park, NY, to 7.1°F above normal in Rochester, NY; Elkins, WV; and Erie, PA.