A Dry, Cool End to Summer
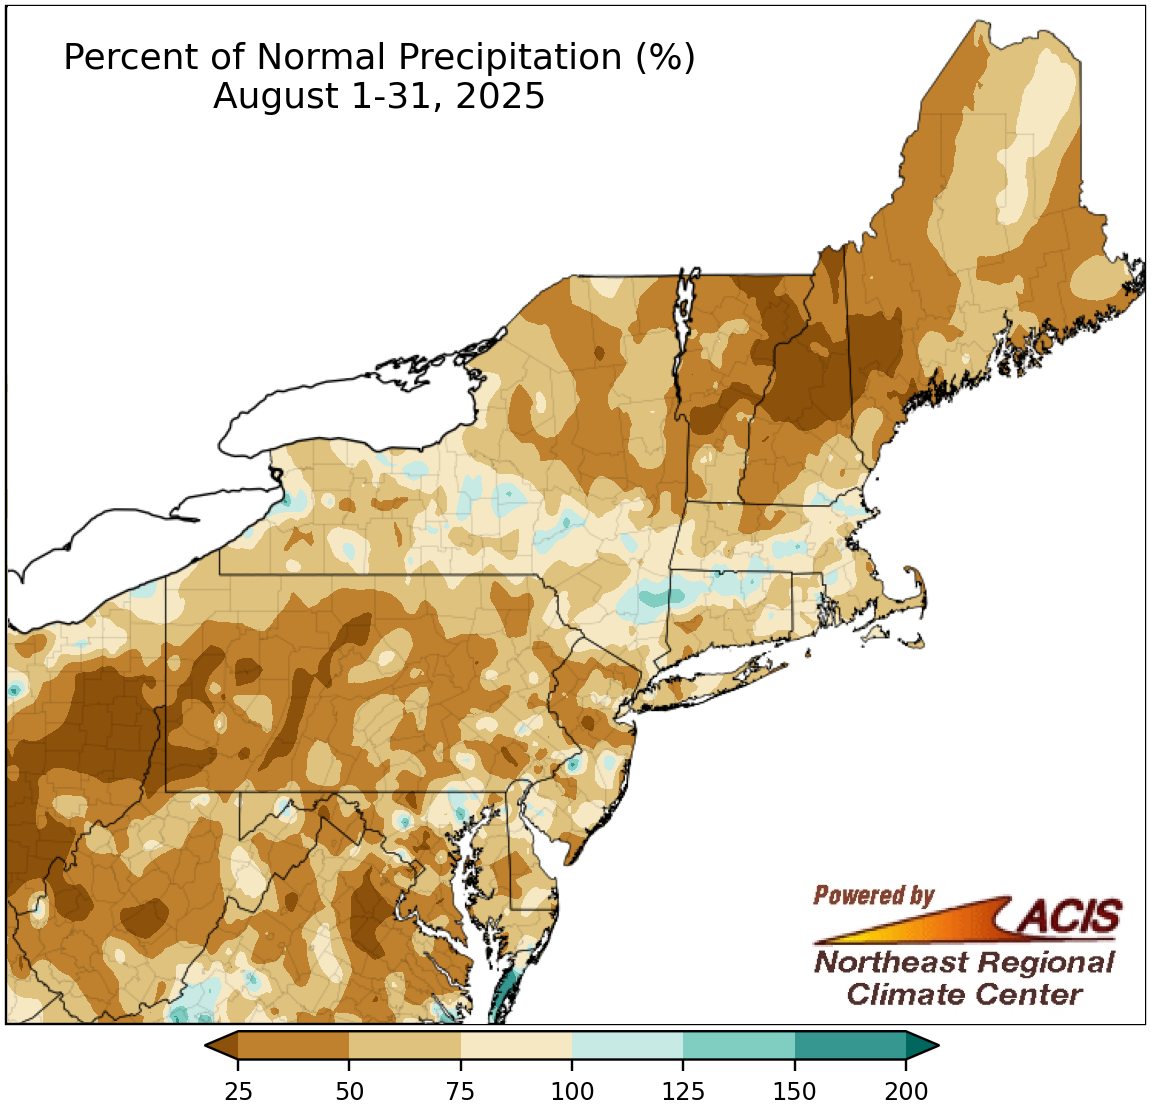
August precipitation ranged from less than 25% of normal to near normal for most of the Northeast.
August was a very dry month for much of the Northeast, with the driest locations such as southern Maine, central New Hampshire, northeastern Vermont, western Pennsylvania, and western West Virginia seeing less than 25% of normal. However, a few spots, particularly in New York and southern New England, were wetter. This August was the driest August (and eighth all-time driest month) since recordkeeping began in 1871 for Washington, D.C., and ranked among the 20 driest Augusts for another 20 major sites. August rainfall at the major sites ranged from 6% of normal in Washington, D.C., to 95% of normal in Beckley, WV. The lack of precipitation allowed drought and abnormal dryness to expand across the region, with impacts to agriculture, water resources, and fire activity.
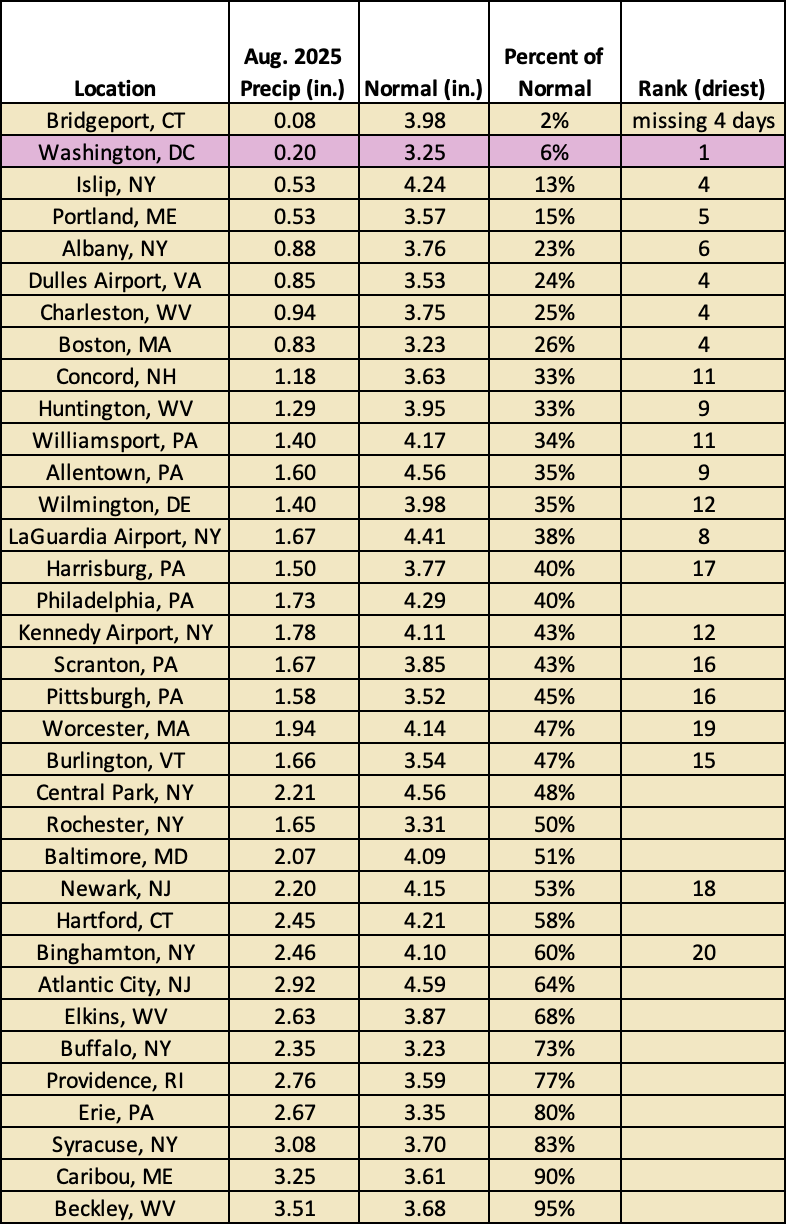
This August was record dry for Washington, D.C., and among the 20 driest for another 20 major sites.
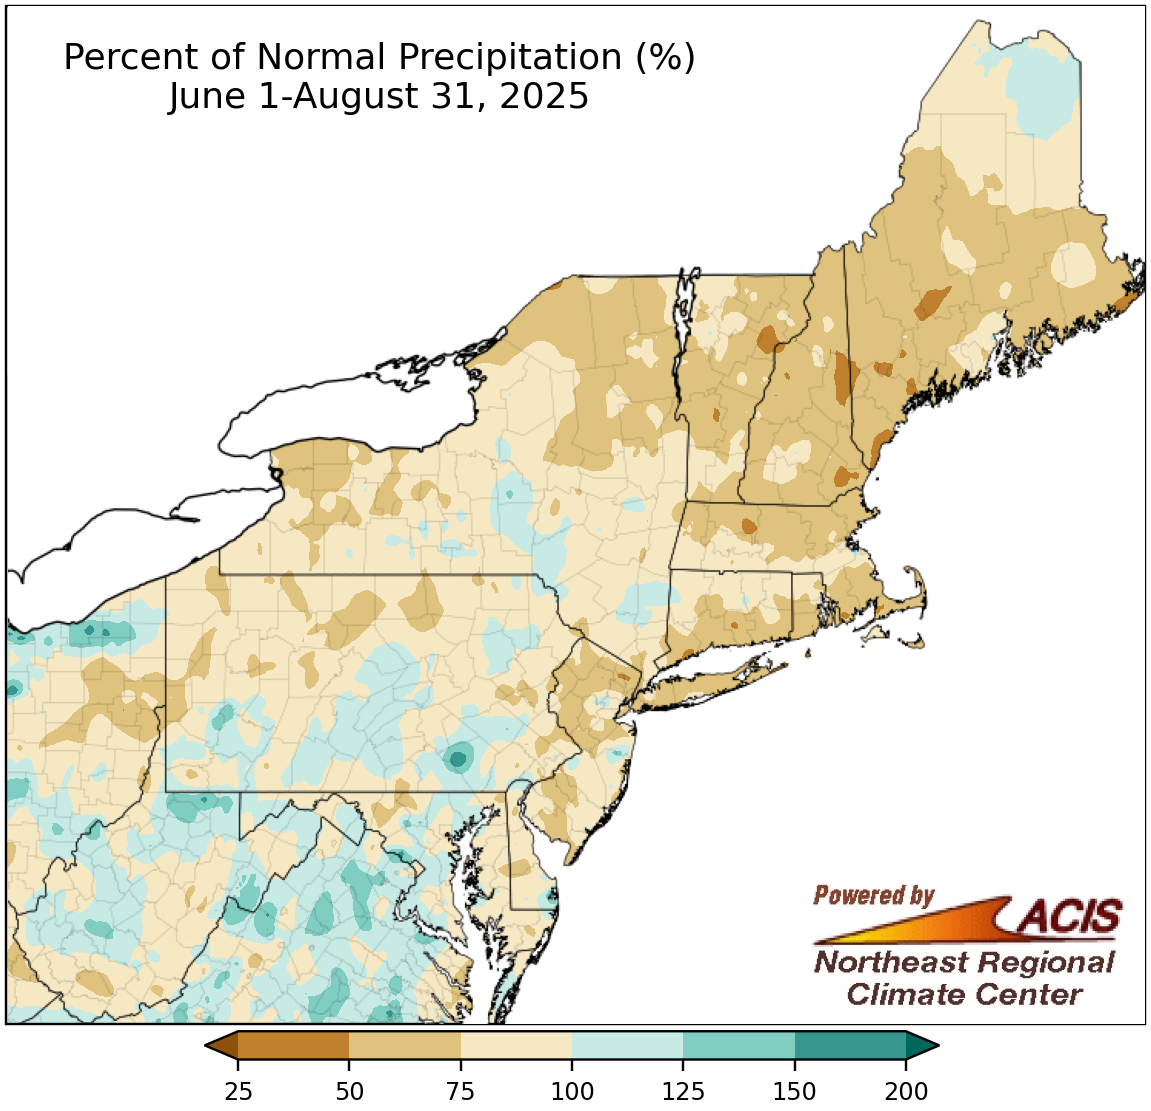
Summer precipitation ranged from 25% of normal to 150% of normal, with many areas on the dry side.
While summer rainfall ranged from 25% of normal to 150% of normal, much of the region fell on the dry side. The driest locations included parts of northern New England, while the wettest locations included parts of the Mid-Atlantic. At the Northeast’s 35 major sites, summer rainfall ranged from 47% of normal in Portland, ME, to 103% of normal in Harrisburg, PA; Atlantic City, NJ; and Charleston, WV, the only three sites to be wetter than normal. This summer ranked among the 20 driest on record for nine major sites.
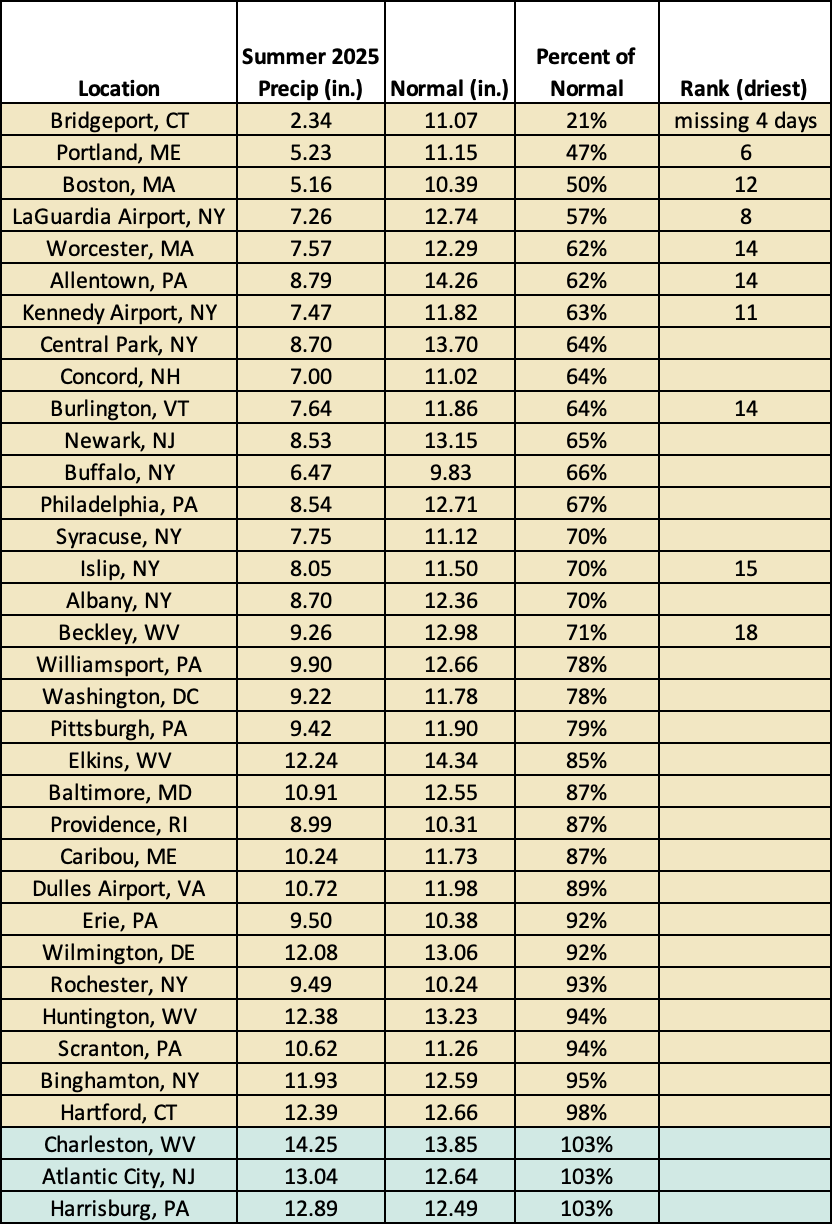
Summer 2025 ranked among the 20 driest summers for nine major sites.
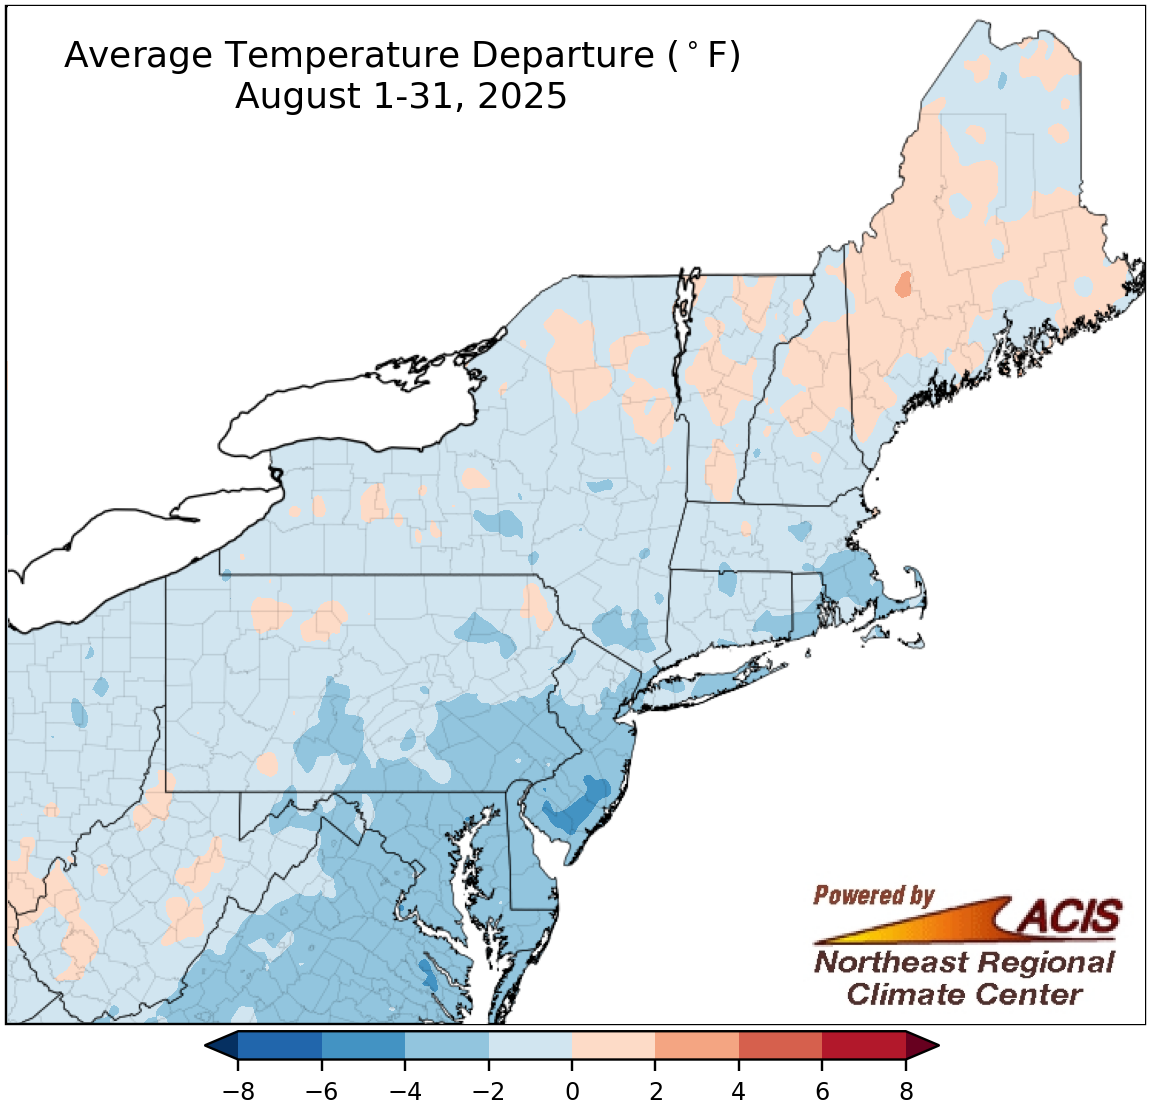
August average temperatures ranged from 6°F below normal to 2°F above normal, with most areas cooler than normal.
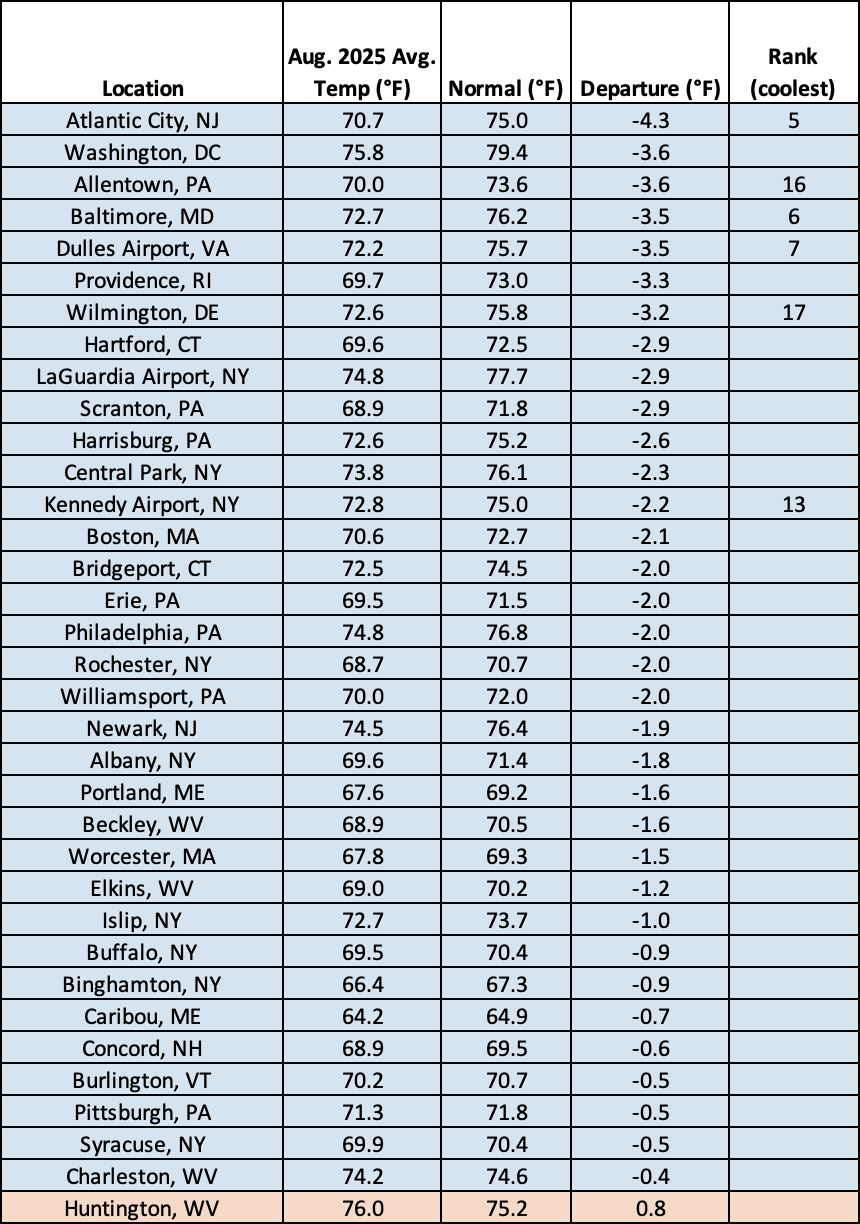
The first half of August featured record to near-record hot weather in northern areas, but the second half of the month brought some unusually early cool temperatures. In the end, August was a cooler-than-normal month for much of the Northeast, with parts of New Jersey being as much as 6°F below normal. In fact, for some spots, it was the coolest August in over a decade. However, some northern and interior locations such as much of Maine were up to 2°F warmer than normal. August average temperatures at the 35 major sites ranged from 4.3°F below normal in Atlantic City, NJ, to 0.8°F above normal in Huntington, WV, the lone warmer-than-normal site. This August ranked among the 20 coolest on record for six major sites.
This August ranked among the 20 coolest on record for six major sites.
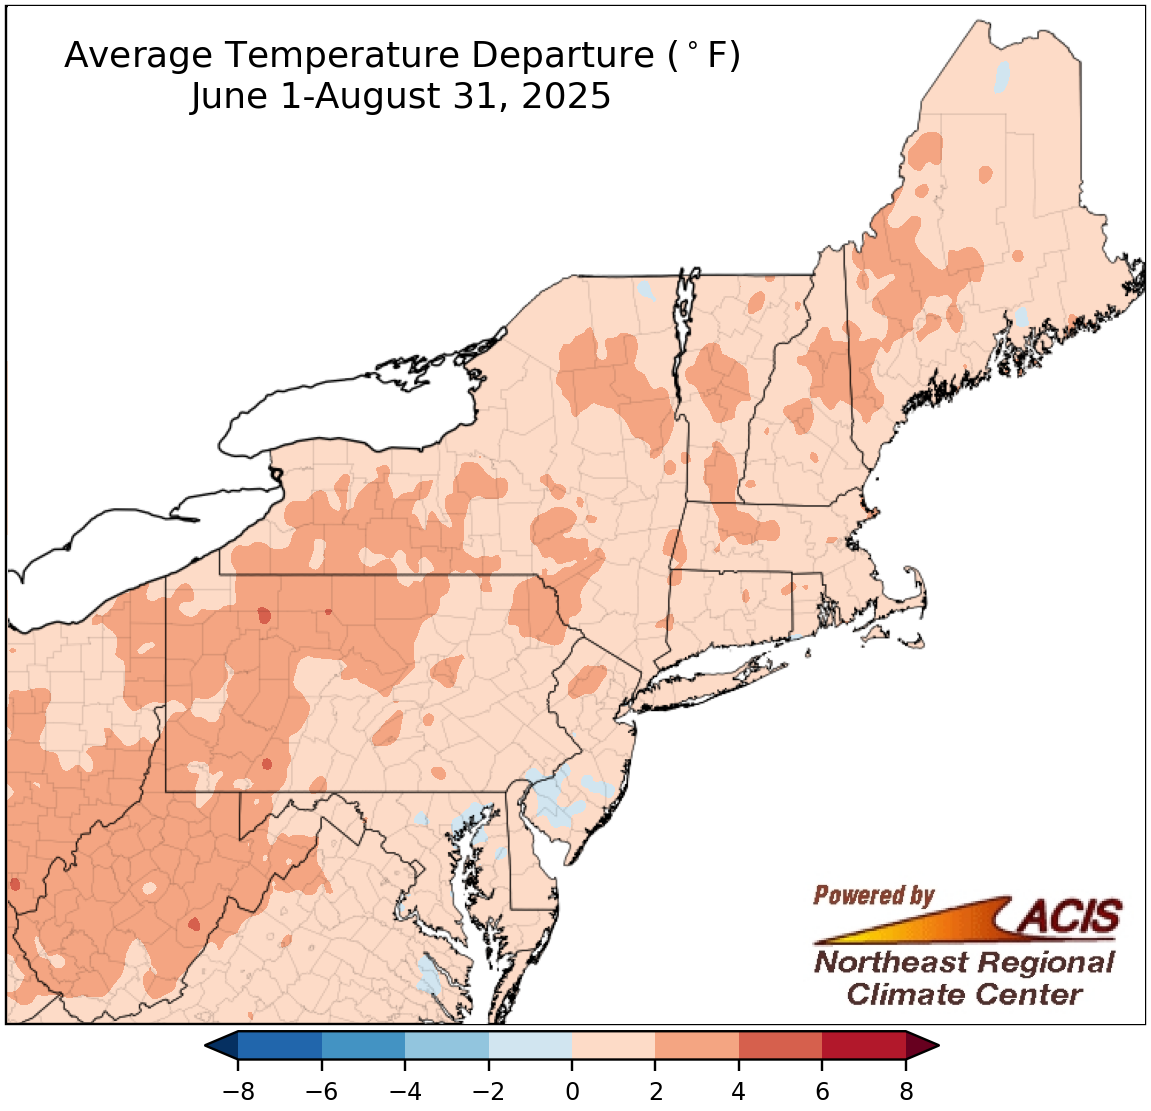
Summer average temperatures ranged from near normal to 4°F above normal for most of the Northeast.
Hot weather in June and July overshadowed the cool August conditions, making summer hotter than normal for almost the entire Northeast. Summer average temperatures ranged from 2°F below normal in spots like southern New Jersey to 4°F above normal in multiple locations including much of West Virginia. At the region’s 35 major sites, summer average temperatures ranged from 0.5°F below normal in Washington, D.C., to 3.1°F in Huntington, WV, with 29 sites being hotter than normal. This summer ranked among the 20 hottest for 21 major sites.
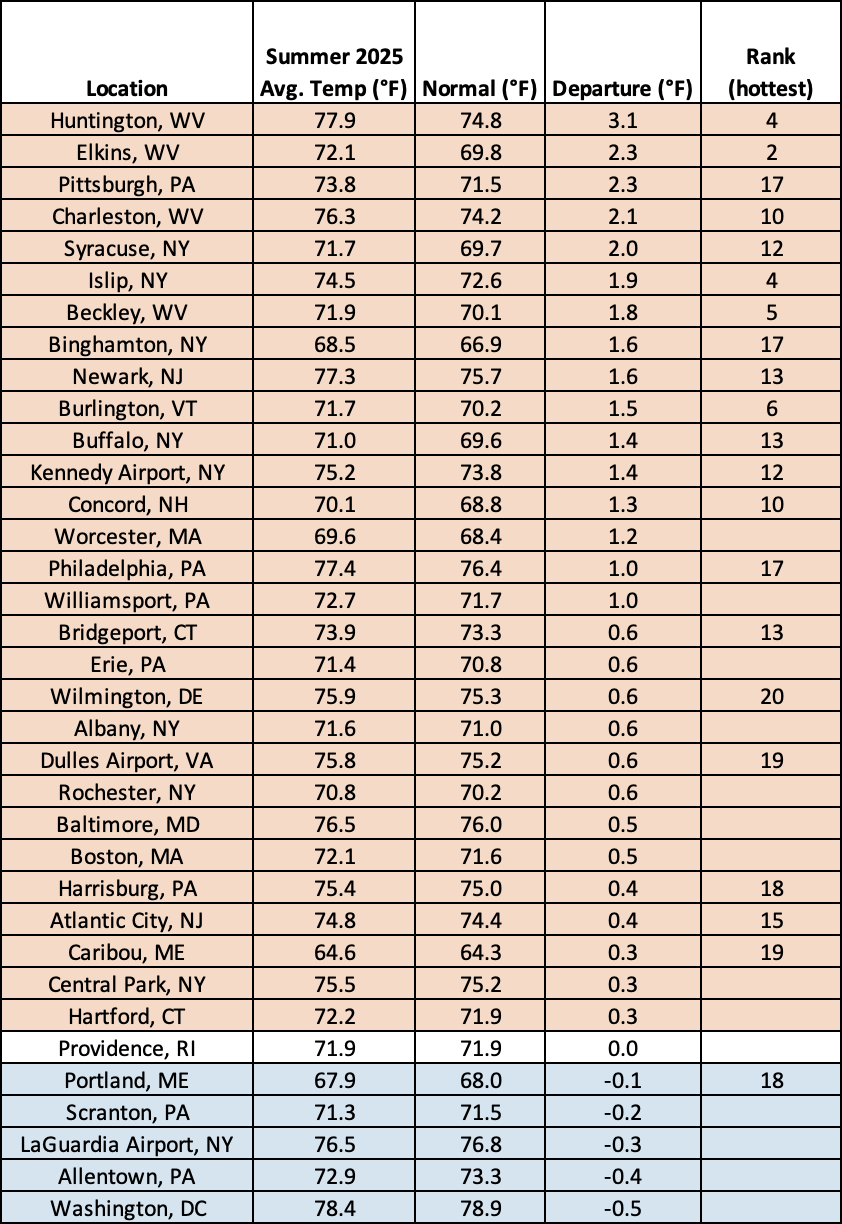
Summer 2025 ranked among the 20 hottest summers for 21 major sites.
The September precipitation outlook from NOAA’s Climate Prediction Center slightly favors above-normal precipitation for the southern end of the Delmarva Peninsula, tied in part to September being a peak month for tropical activity. Equal chances of below-, near-, and above-normal precipitation were predicted for the rest of the Northeast as there were no clear signals to sway the forecast. The entire Northeast falls into the equal chances category for September temperatures.