A Parched September
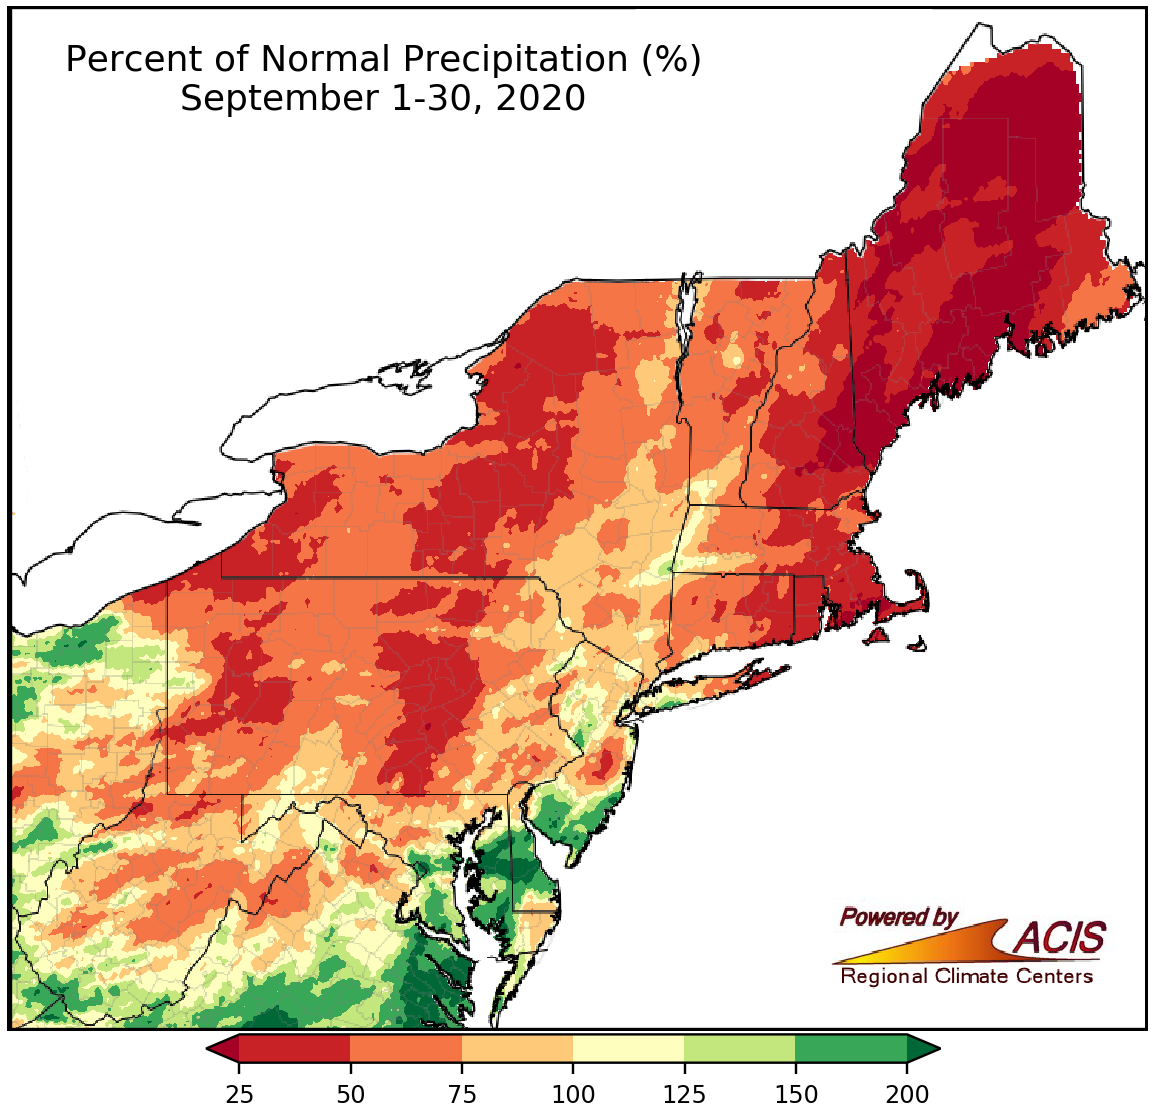
September precipitation ranged from less than 25% of normal to near normal for a majority of the Northeast.
September was drier than normal for a majority of the Northeast, with a large portion of the region seeing less than 75% of normal precipitation. The driest locations, which saw less than 25% of normal precipitation, were in Maine and New Hampshire. Twenty-six of the 35 major climate sites experienced a drier-than-normal September, with eight ranking this September among their 20 driest on record. In fact, several sites were experiencing even drier conditions until the last two days of the month when a storm system brought some precipitation. For instance, Burlington, VT, had its driest September 1-28 period on record with 0.25 inches of rain. The site then picked up 2.04 inches of rain on September 29 and 30 for a monthly total of 2.29 inches, knocking this September down to the 33rd driest on record. Below-normal precipitation during September caused drought and abnormally dry conditions to expand across the Northeast, with numerous impacts including record-low streamflow, crop losses, an increased number of wildfires, and water shortages and restrictions. You can keep up to date on drought conditions by following our weekly drought update as well as checking out our Northeast Drought Early Warning System Dashboard.
There were a few spots, particularly in Maryland, Delaware, and New Jersey that were notably wetter. However, even for the nine wetter-than-normal major climate sites, it was generally a single rainfall event that pushed their monthly totals above normal. For instance, Atlantic City, NJ, had its wettest September day on record on the 10th with 3.97 inches of rain and ended up with 5.82 inches of rain for the month, its seventh wettest September. Without that one rainfall event, the site would have seen 1.85 inches of rain in September, 59% of normal (and its 26th driest September).
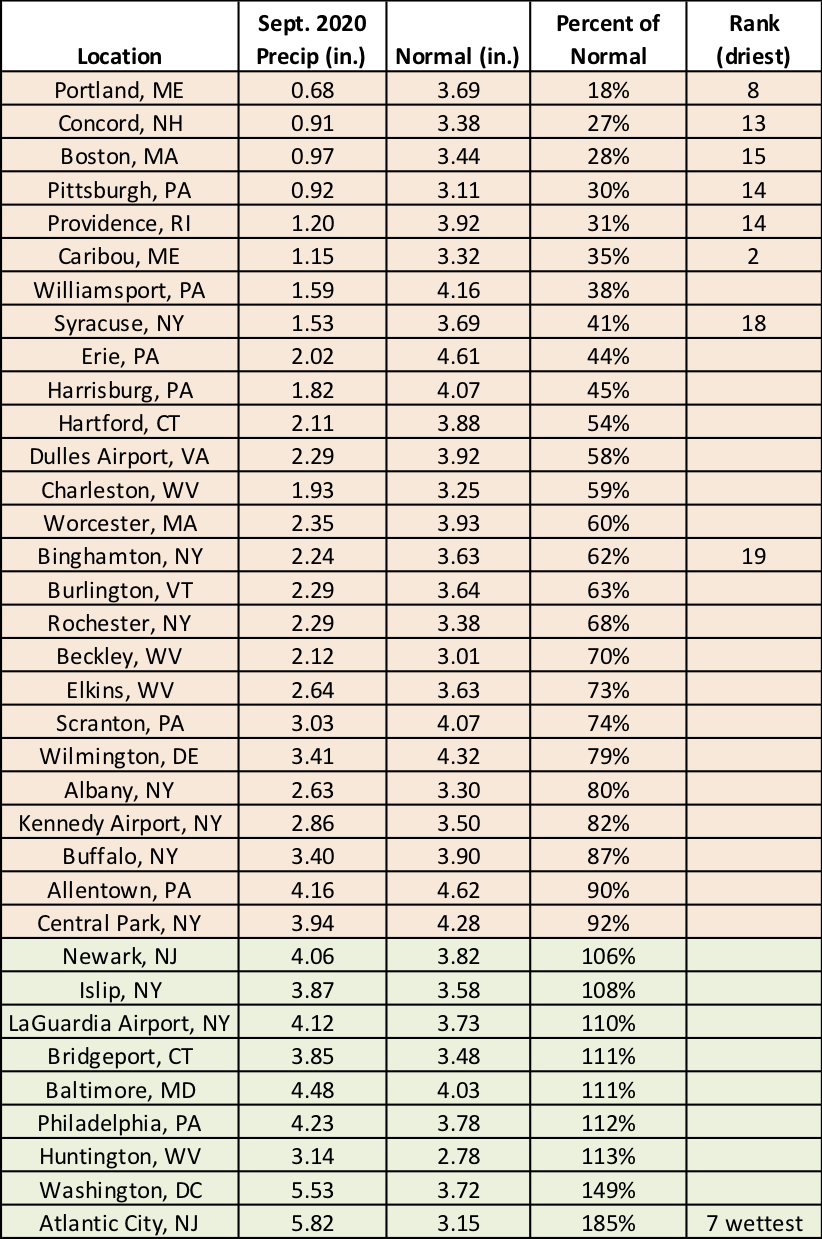
September precipitation at the major climate sites ranged from 18% of normal in Portland, ME, to 185% of normal in Atlantic City, NJ.
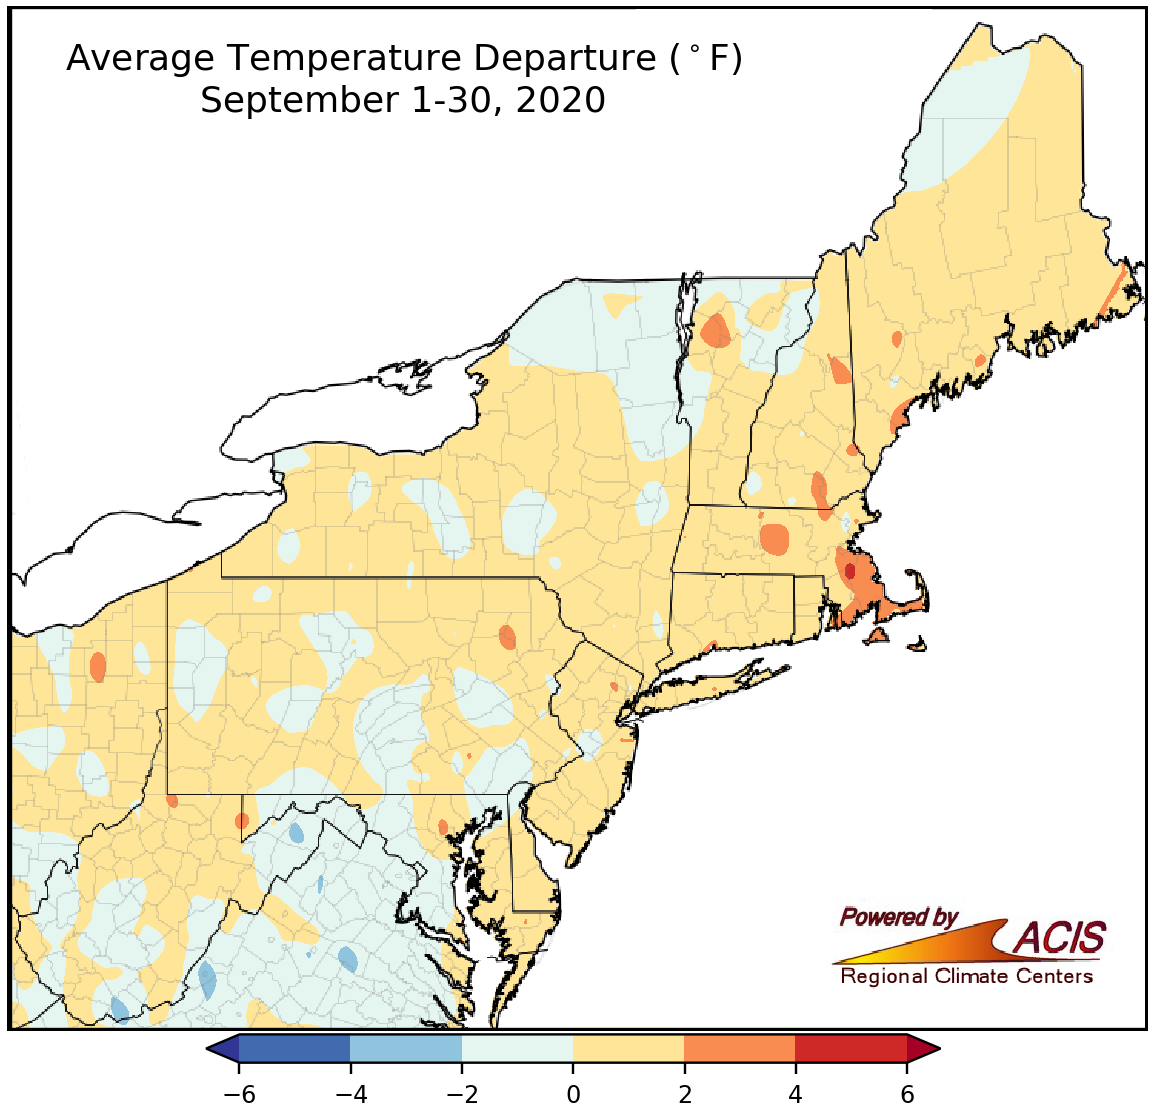
September temperatures were within 2°F of normal for most of the Northeast.
September averaged out to be within 2°F of normal for a majority of the Northeast; although, a few locations in New England were as much as 4°F warmer than normal. Overall, 30 major climate sites had a warmer-than-normal September, with five ranking this September among their 20 warmest on record.
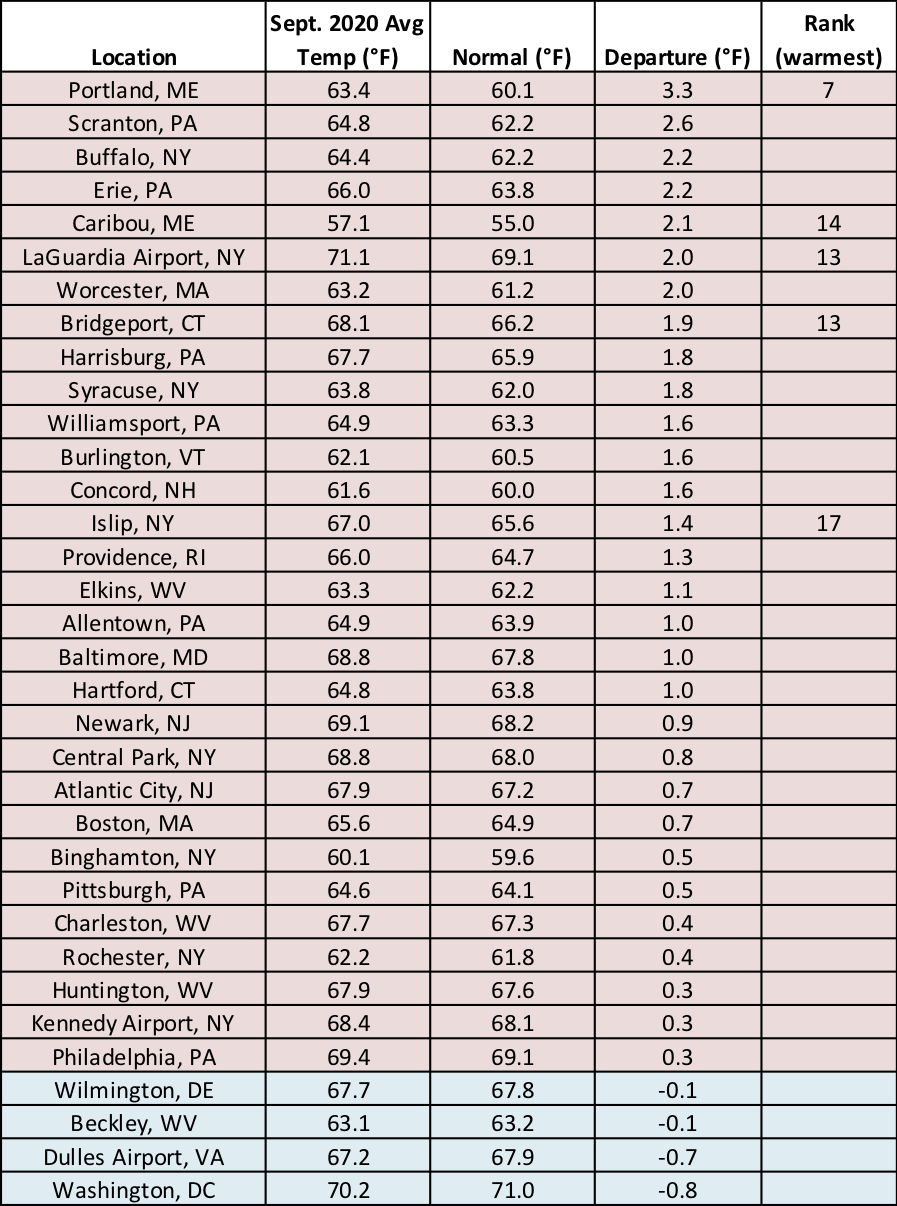
September average temperatures ranged from 0.8°F below normal in Washington, D.C., to 3.3°F above normal in Portland, ME.
Looking ahead to October, NOAA’s Climate Prediction Center favors above-normal temperatures for a majority of the Northeast. However, there’s a tilt toward cooler-than-normal temperatures in southern West Virginia and equal chances of below-, near-, or above-normal temperatures were predicted for the rest of West Virginia, western Maryland, and southwestern Pennsylvania. As for precipitation, the Climate Prediction Center indicates that drier-than-normal conditions are most likely for a majority of the Northeast, with equal chances predicted for portions of New England.
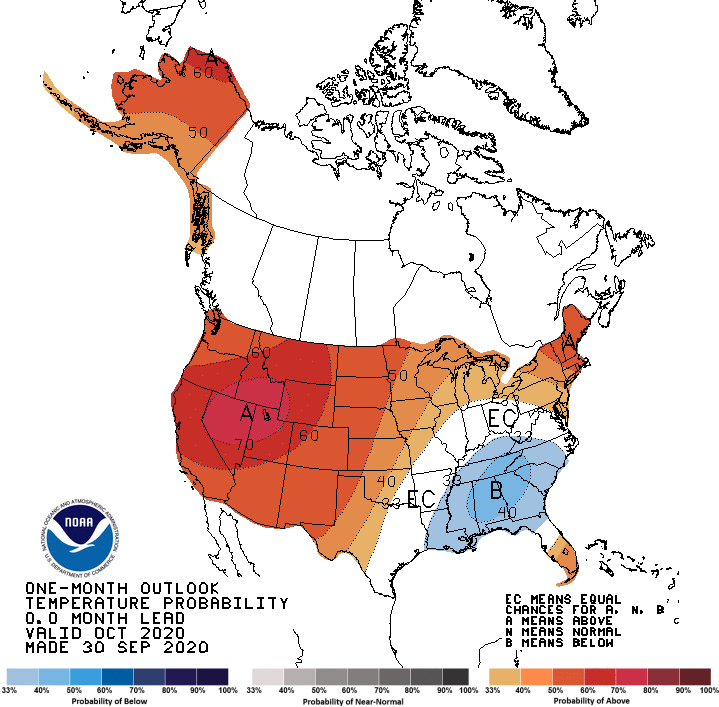
Most of the Northeast is expected to be warmer than normal for October.
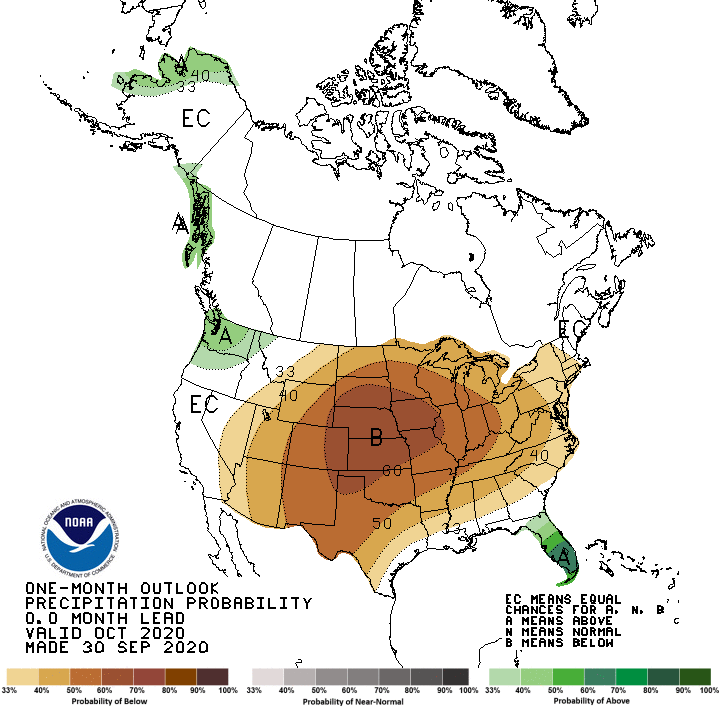
There’s a tilt toward drier-than-normal conditions in October for much of the Northeast.