Falling into Winter
The Northeast saw yet another warmer-than-normal month in November.
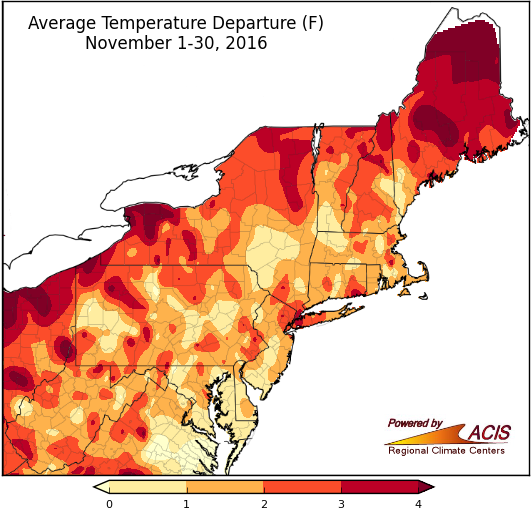
November average temperatures ranged from near normal to more than 4°F above normal. The warmest spots were in Maine, western New York, and northwestern Pennsylvania. All 35 major climates sites were warmer than normal, with November average temperature departures ranging from 1.2°F above normal in Syracuse, NY to 5.4°F above normal in Caribou, ME.
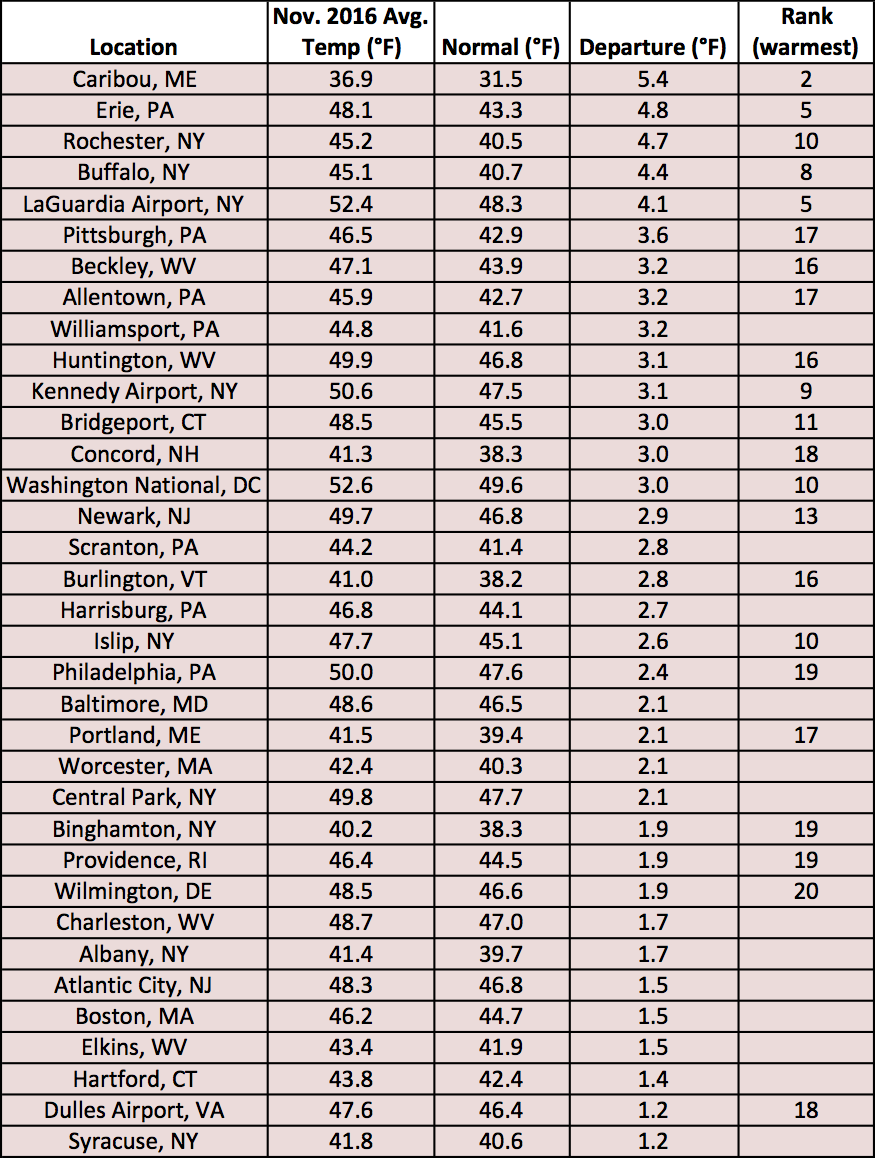
Twenty-two sites ranked this November among their top 20 warmest.
Fall also averaged out to be warmer than normal for the region.
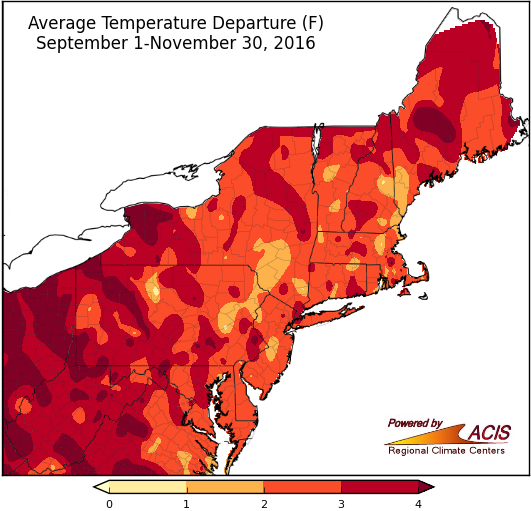
With September, October, and November all warmer than normal, it’s no surprise that fall wrapped up on the warm side of normal, too. Average temperatures ranged from 1°F to more than 4°F above normal. All but one major climate site ranked this fall among their top 20 warmest, with LaGuardia Airport, NY; Washington National, DC; and Bridgeport, CT each having a record warm fall.
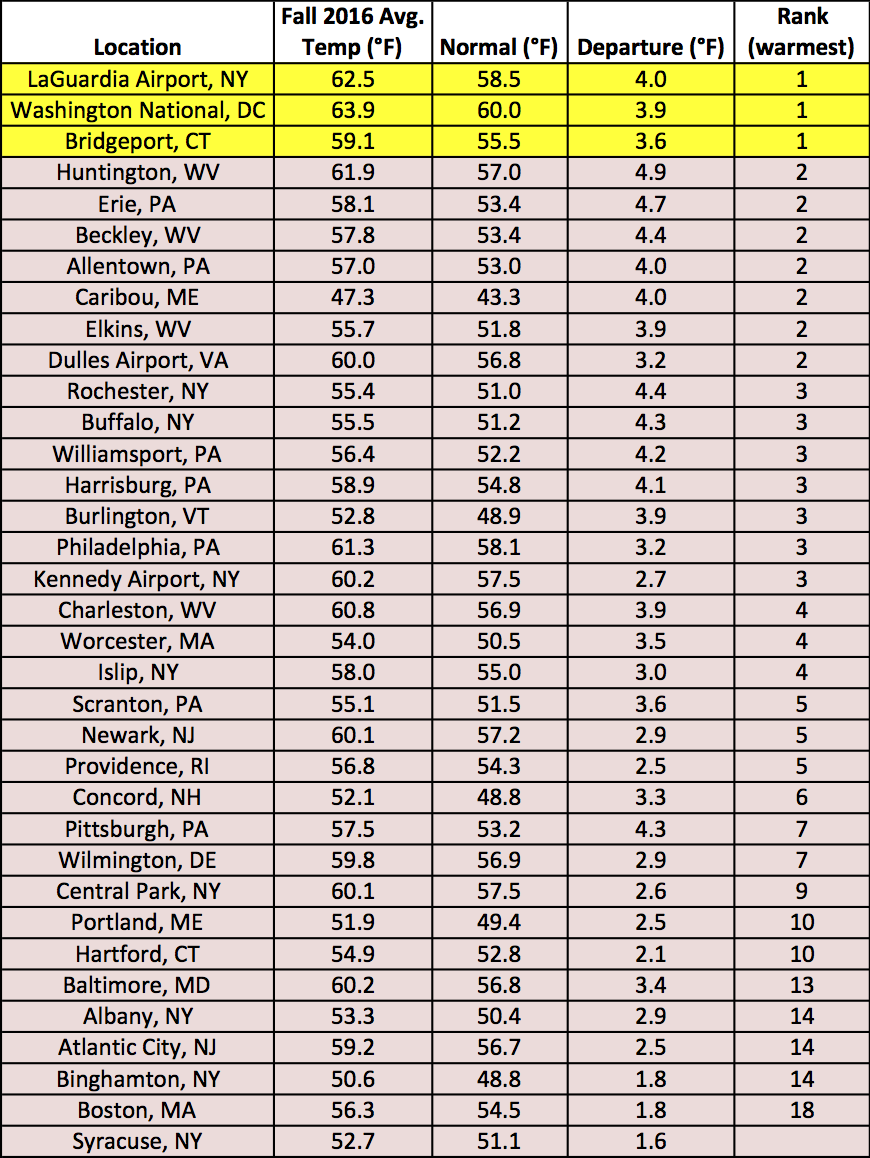
Fall temperature departures ranged from 1.6°F above normal in Syracuse, NY to 4.9°F above normal in Huntington, WV.
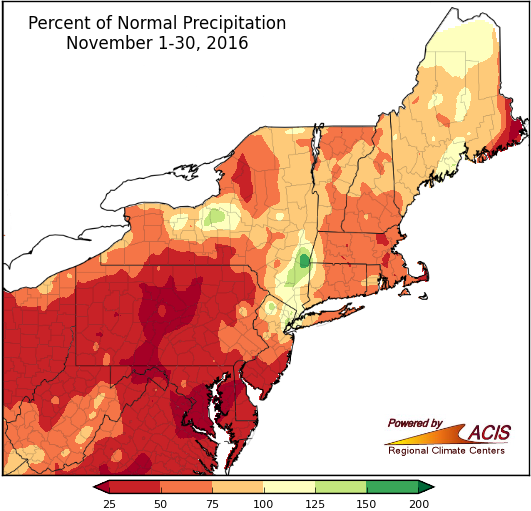
November featured below-normal precipitation for much of the region.
November precipitation generally ranged from less than 25% to 150% of normal. The driest areas were in central Pennsylvania, the Panhandle of West Virginia, and portions of Maryland and Delaware. Twenty-nine of the region’s 35 major climate sites received below-normal November precipitation. For all 35 sites, precipitation ranged from 24% of normal at Washington National, DC to 179% of normal in Newark, NJ.
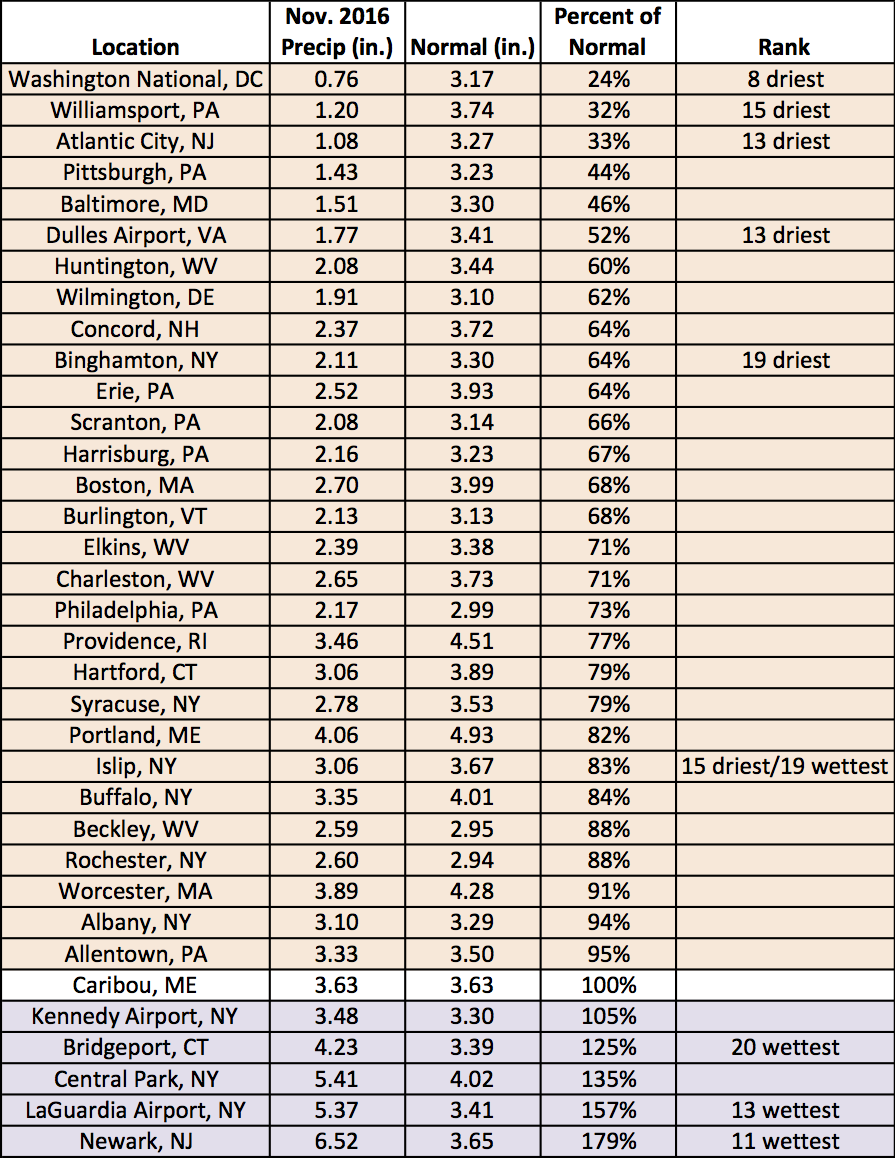
Six sites ranked this November among their top 20 driest, while four ranked it among their top 20 wettest. Due to Islip’s short period of record, the month ranked among both the top 20 driest and wettest.
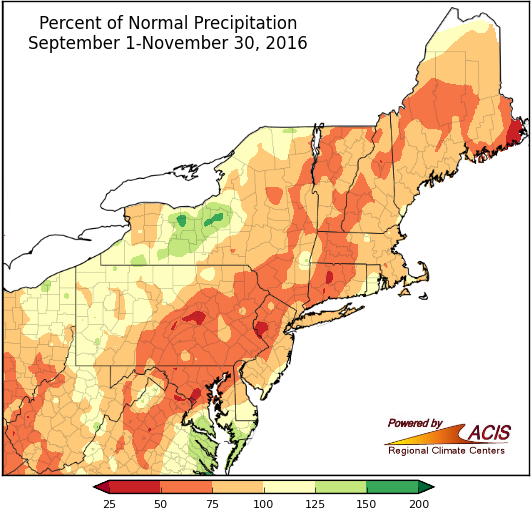
Fall precipitation was less than 125% of normal for most areas.
For fall, precipitation ranged from 50% to 150% of normal in most areas. A few spots in Maryland, Pennsylvania, and New Jersey saw less than 50% of normal, while a few spots in central New York saw more than 150% of normal. Twenty-seven major climate sites were drier than normal for fall, with precipitation for all 35 sites ranging from 40% of normal at Washington National, DC to 133% of normal in Syracuse, NY. Drought conditions persisted through fall for parts of the region.
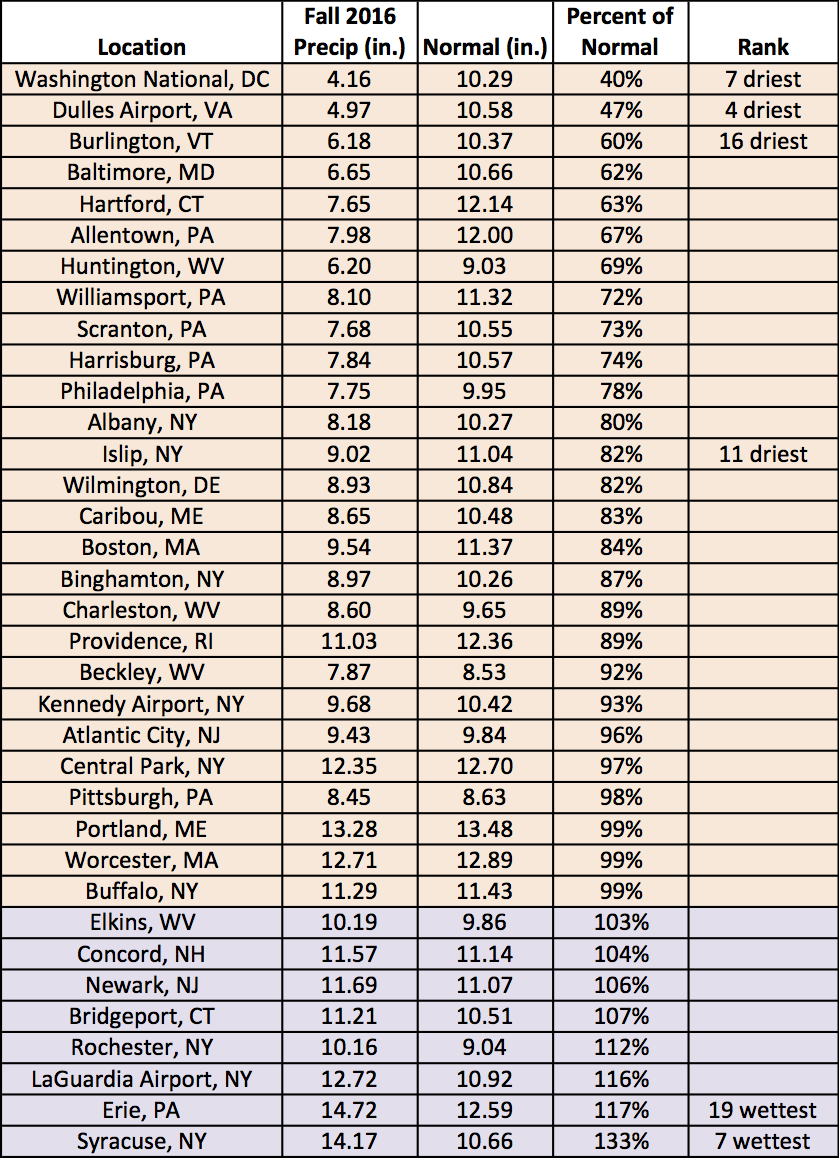
Four sites ranked this fall among their top 20 driest, while two ranked it among their top 20 wettest.
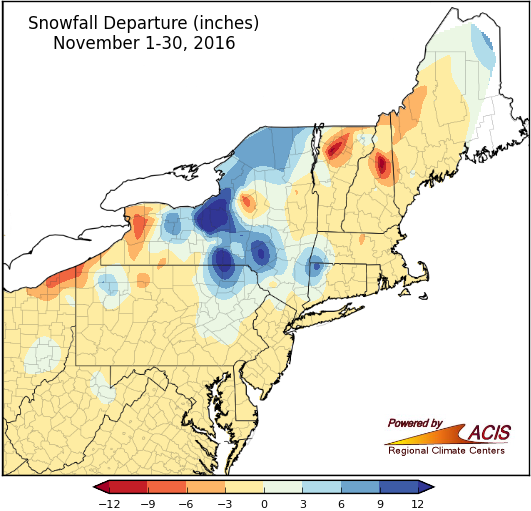
November snowfall was within 3 inches of normal for much of the region, with areas near Lake Ontario being the main exception.
November snowfall generally ranged from a foot below normal to more than a foot above normal. The largest deficits were in higher elevations of Vermont and New Hampshire, while the largest surpluses were southeast of Lake Ontario. Twenty-eight major climate sites had near to below-normal snowfall in November, with departures for all sites ranging from 7.0 inches below normal in Buffalo, NY to 21.8 inches above normal in Binghamton, NY.
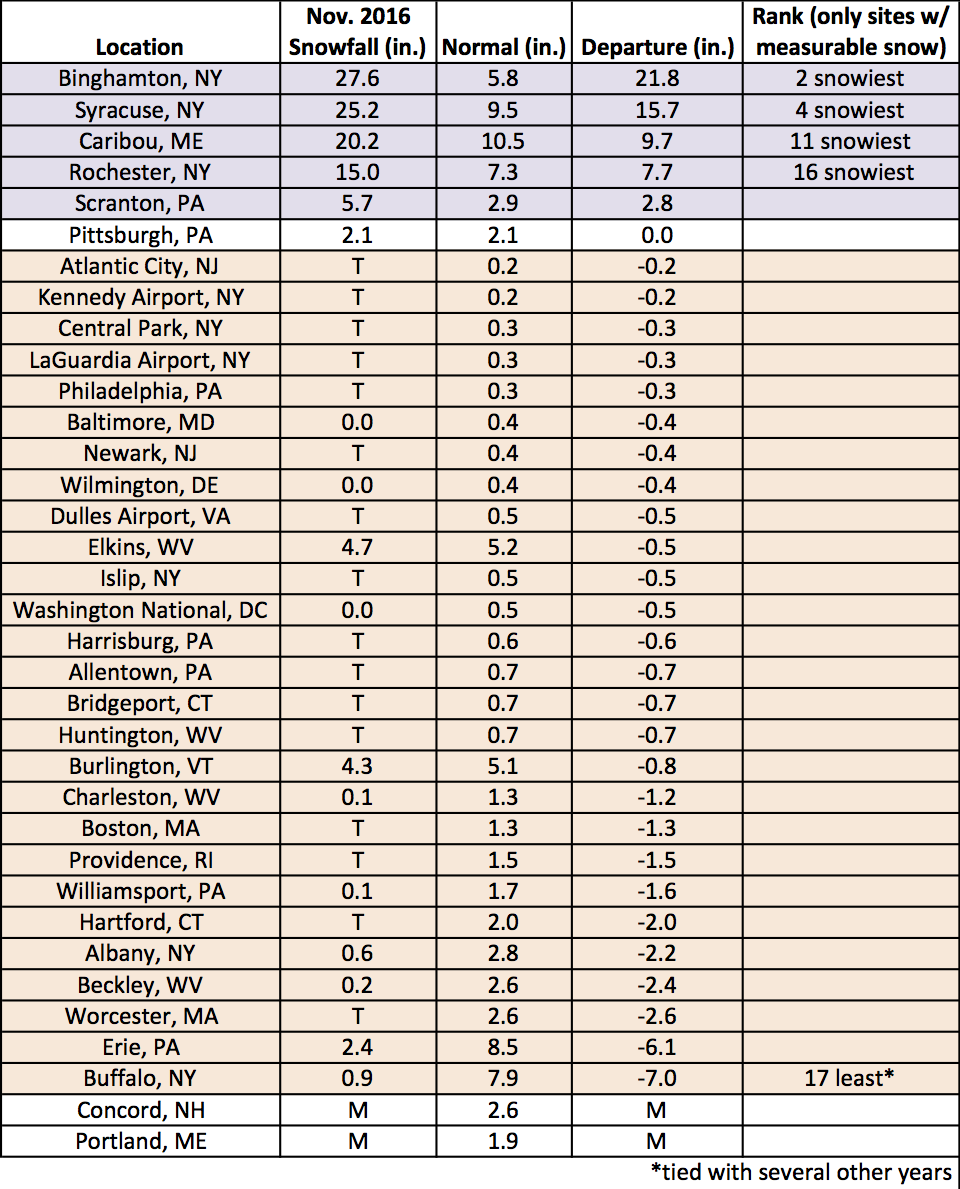
While Buffalo tied for its 17th least snowy November, four other sites ranked the month among their top 20 snowiest.