A Warm, Wet Summer
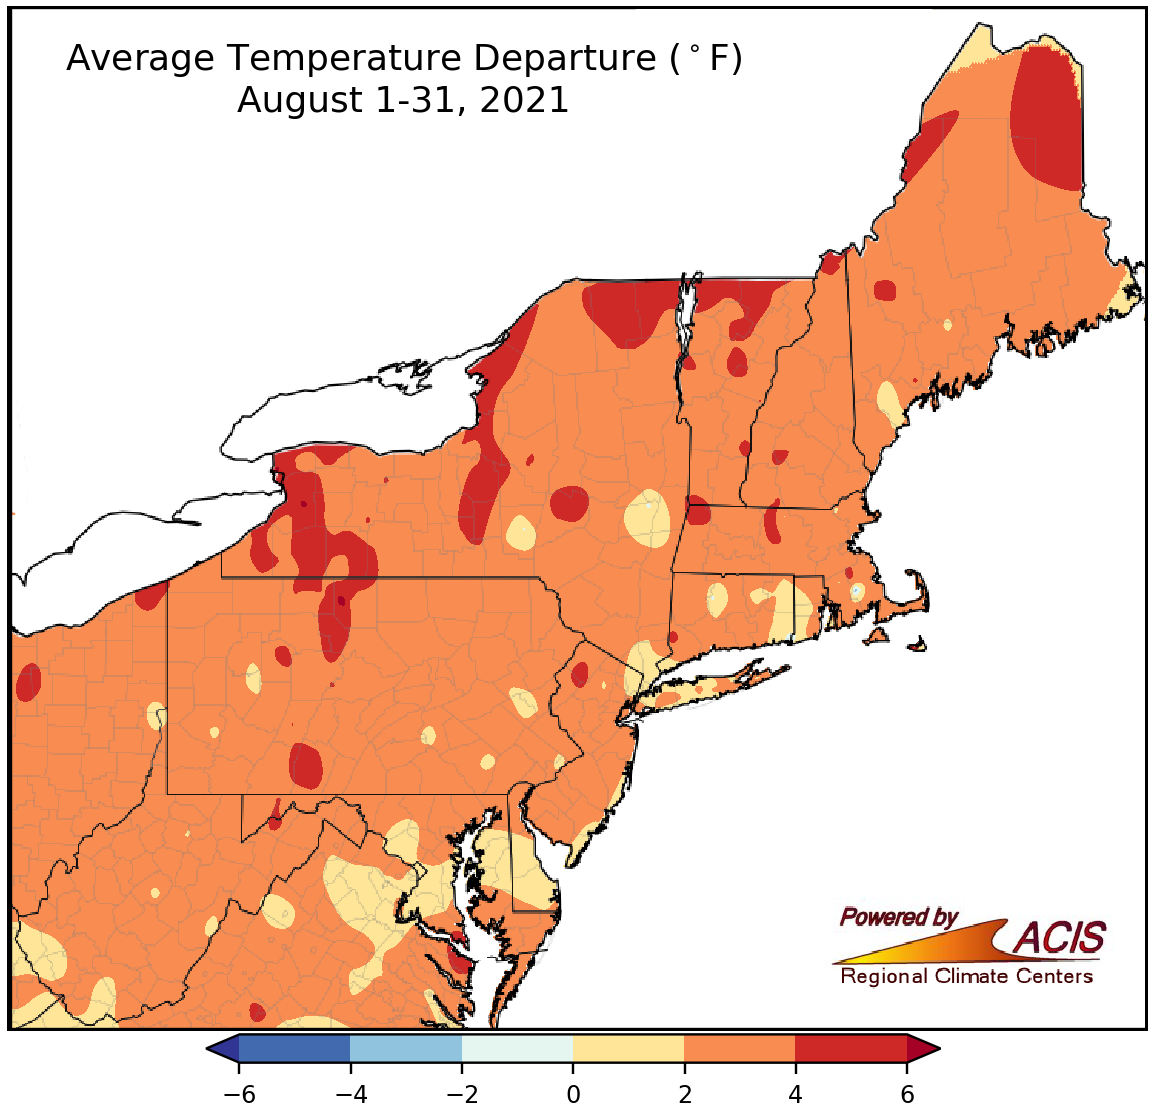
August average temperatures ranged from near normal to 6°F above normal.
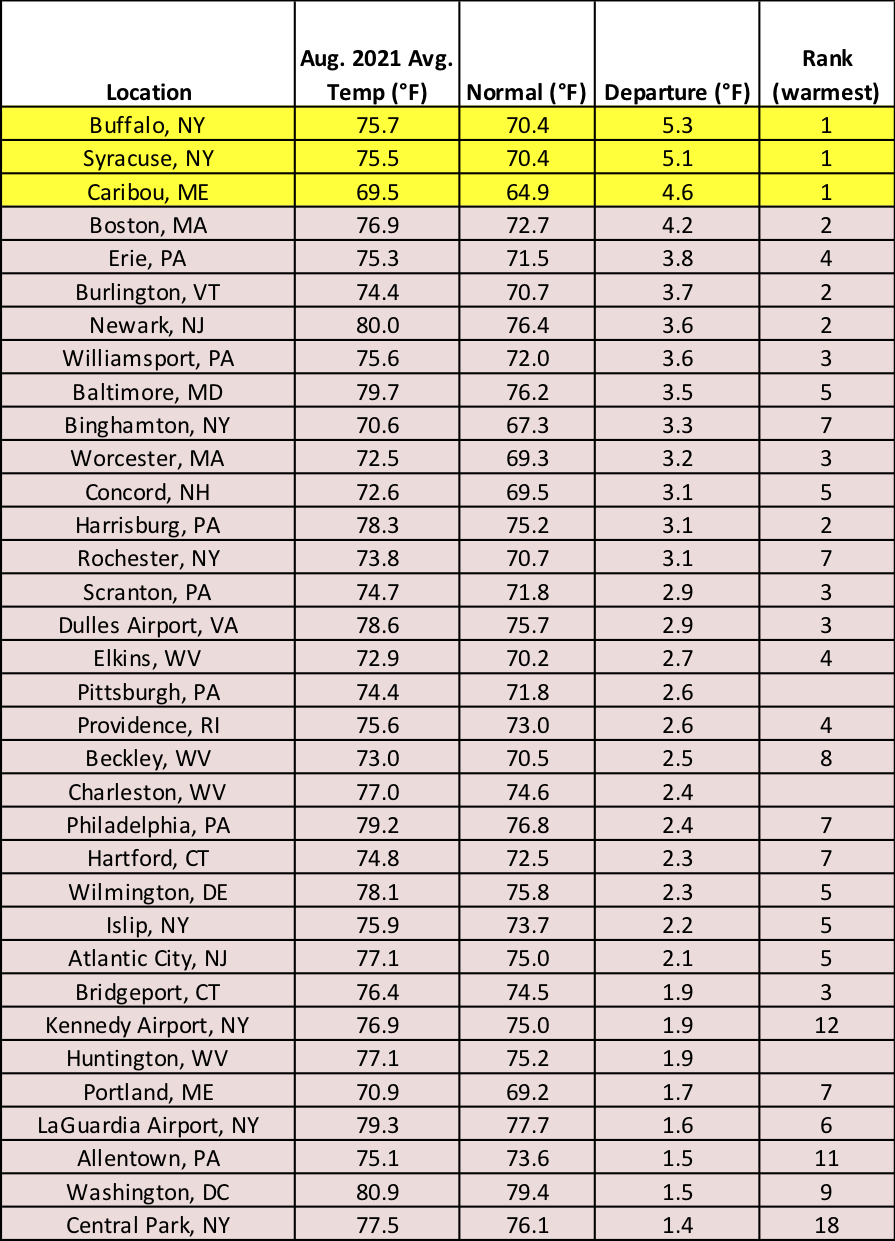
August average temperatures were 2°F to 4°F warmer than normal for much of the Northeast, with a few locations approaching 6°F above normal. This August was the warmest on record for Buffalo and Syracuse, NY, and Caribou, ME, and ranked among the 10 warmest on record for another 25 major climate sites. Overall, average temperatures at the major climate sites ranged from 1.4°F above normal in Central Park, NY, to 5.3°F above normal in Buffalo, NY.
This August was record warm for three major climate sites and among the 10 warmest for 25 additional sites.
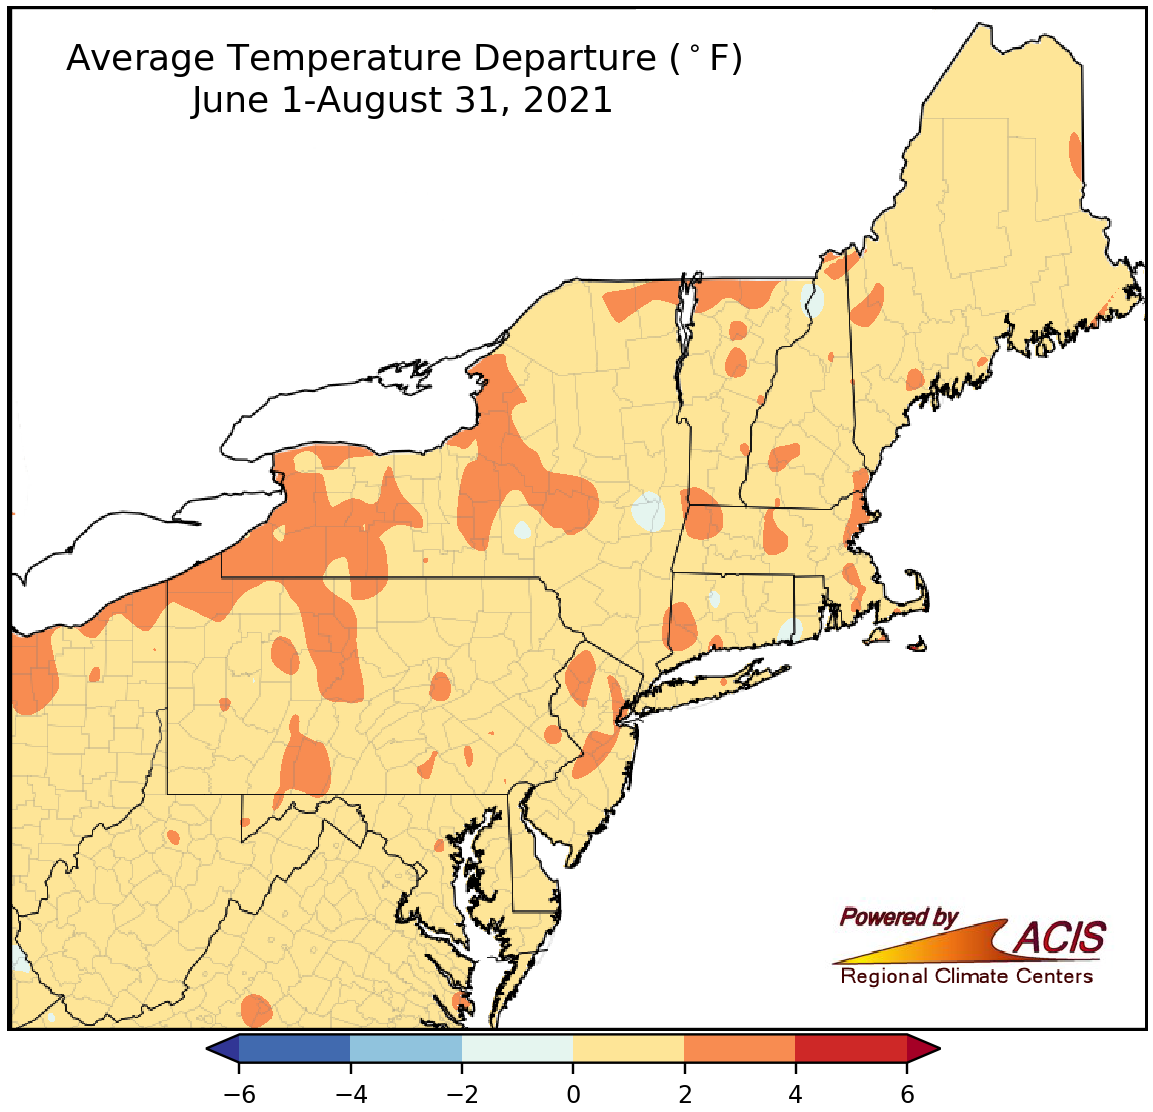
Summer average temperatures ranged from near normal to 4°F above normal.
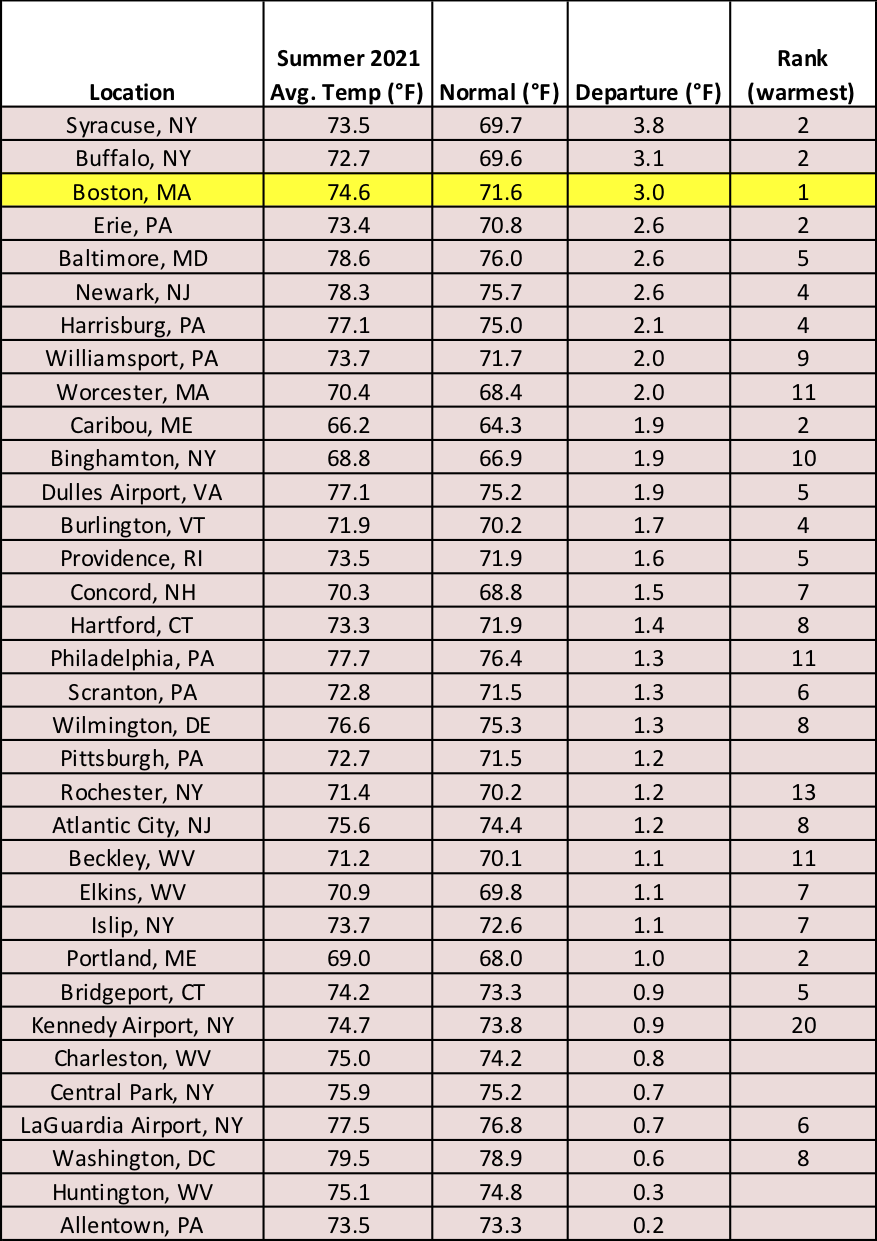
Summer was also warmer than normal, with average temperatures ranging from near normal to 4°F above normal. Boston, MA, experienced its warmest summer on record, while another 23 major climate sites had one of their 10 warmest summers on record. Average temperatures at the major climate sites ranged from 0.2°F above normal in Allentown, PA, to 3.8°F above normal in Syracuse, NY.
Summer 2021 was the warmest on record for Boston, MA, and among the 10 warmest for another 23 major climate sites.
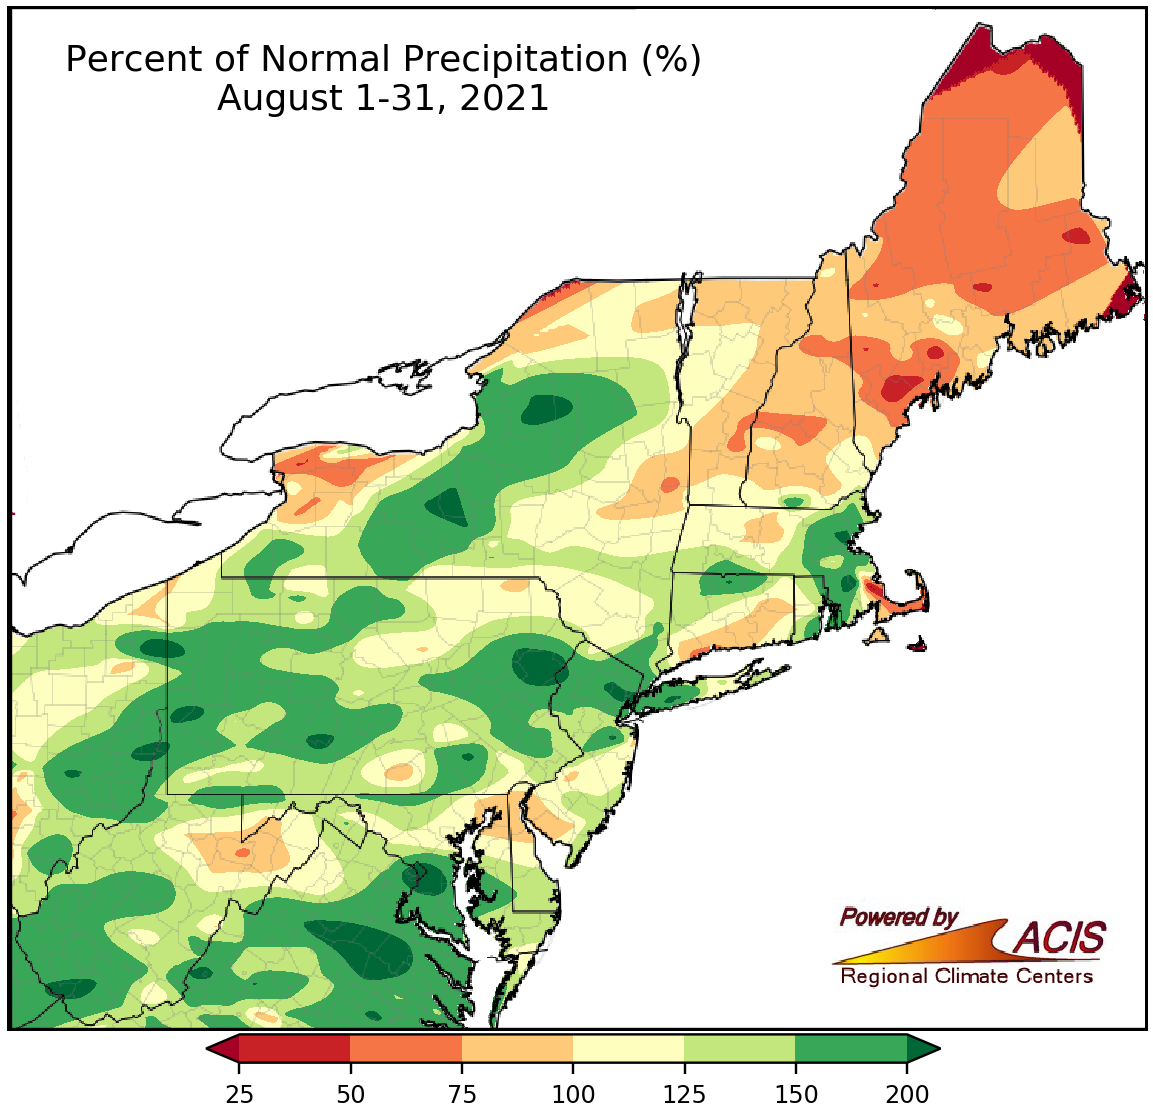
August precipitation ranged from 50% of normal to more than 200% of normal.
A large portion of the Northeast received above-normal precipitation during August, with the wettest locations seeing more than 200% of normal precipitation. Twenty-six of the 35 major climate sites wrapped up August on the wet side of normal, with 19 of them ranking this August among their 20 wettest on record. Back-to-back tropical systems in mid-August contributed to high rainfall totals in some areas.
On the other hand, several areas missed out on the heavy rain including much of northern New England, western New York, and Cape Cod, MA, with some of these locations seeing less than 75% of normal precipitation. In fact, drought and abnormal dryness persisted or intensified in a few of these areas during August.
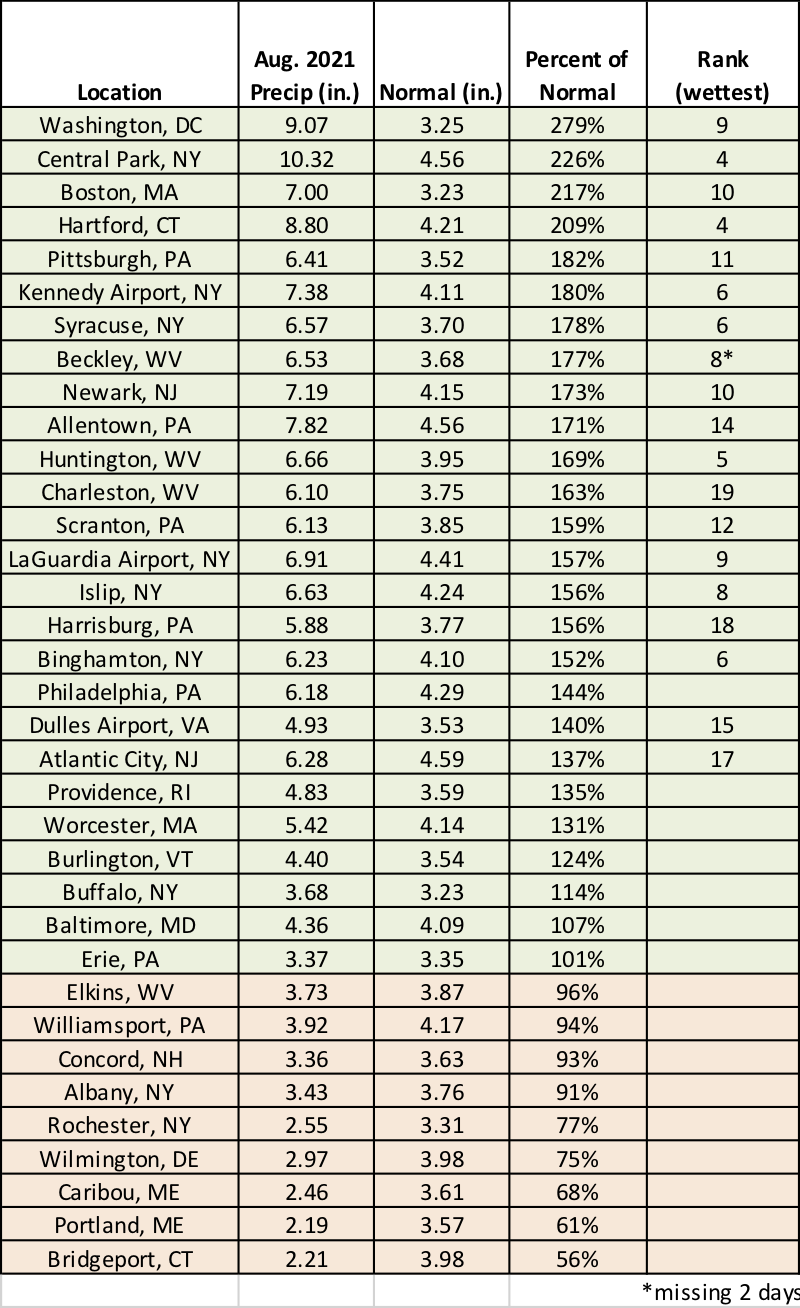
Nineteen major climate sites experienced one of their 20 wettest Augusts on record.
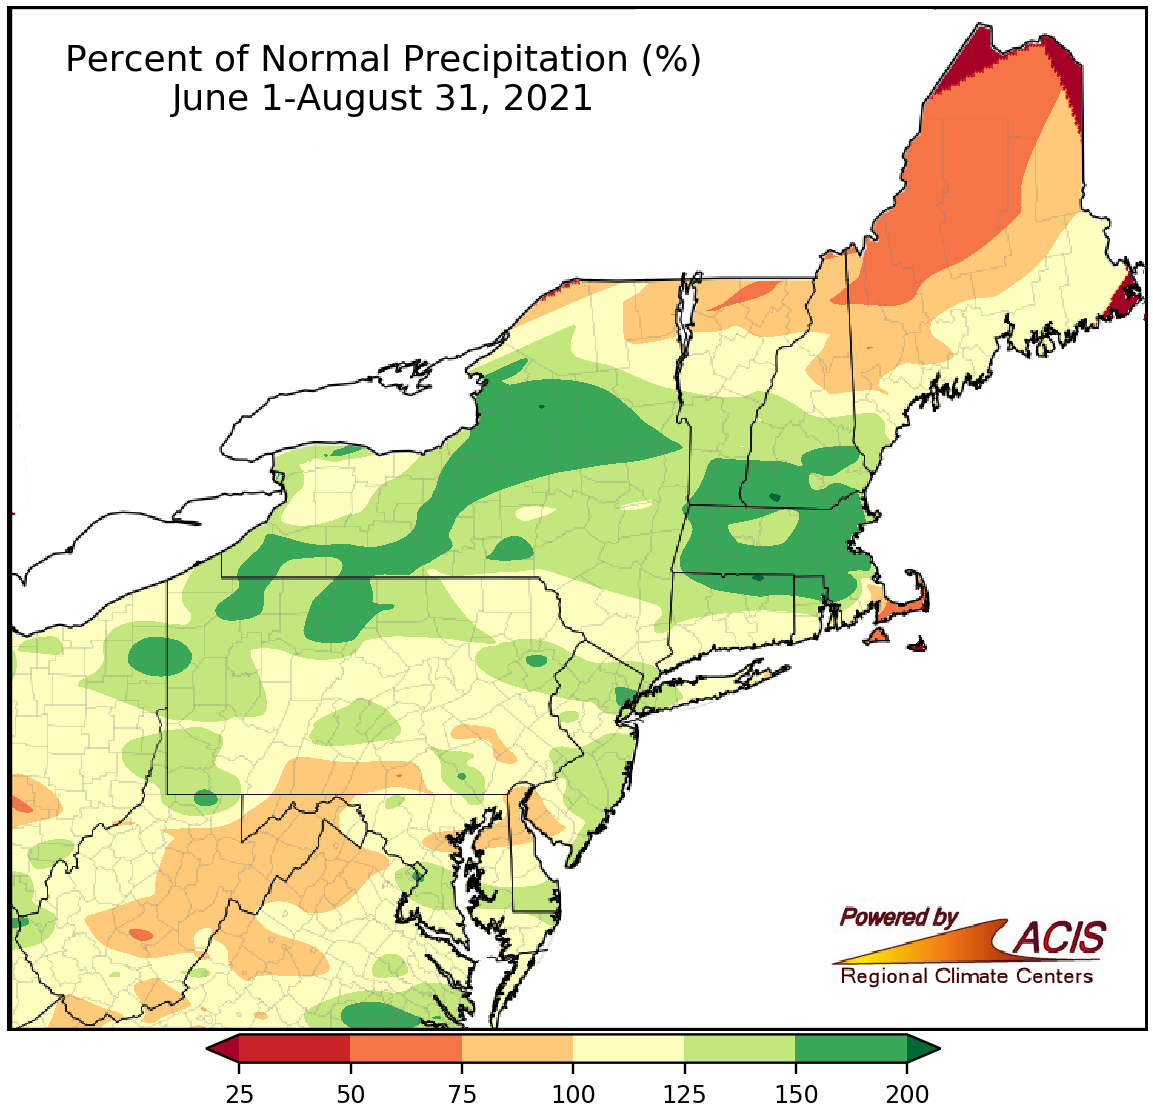
Summer precipitation ranged from 50% of normal to 200% of normal.
Summer precipitation ranged from 50% of normal to 200% of normal, with much of the Northeast being wetter than normal. Huntington, WV, recorded its wettest summer on record, while another 18 major climate sites had one of their 20 wettest summers on record. Meanwhile, Caribou, ME, logged its 14th driest summer on record. Overall, summer precipitation at the 35 major climate sites ranged from 74% of normal in Wilmington, DE, to 189% of normal in Boston, MA.
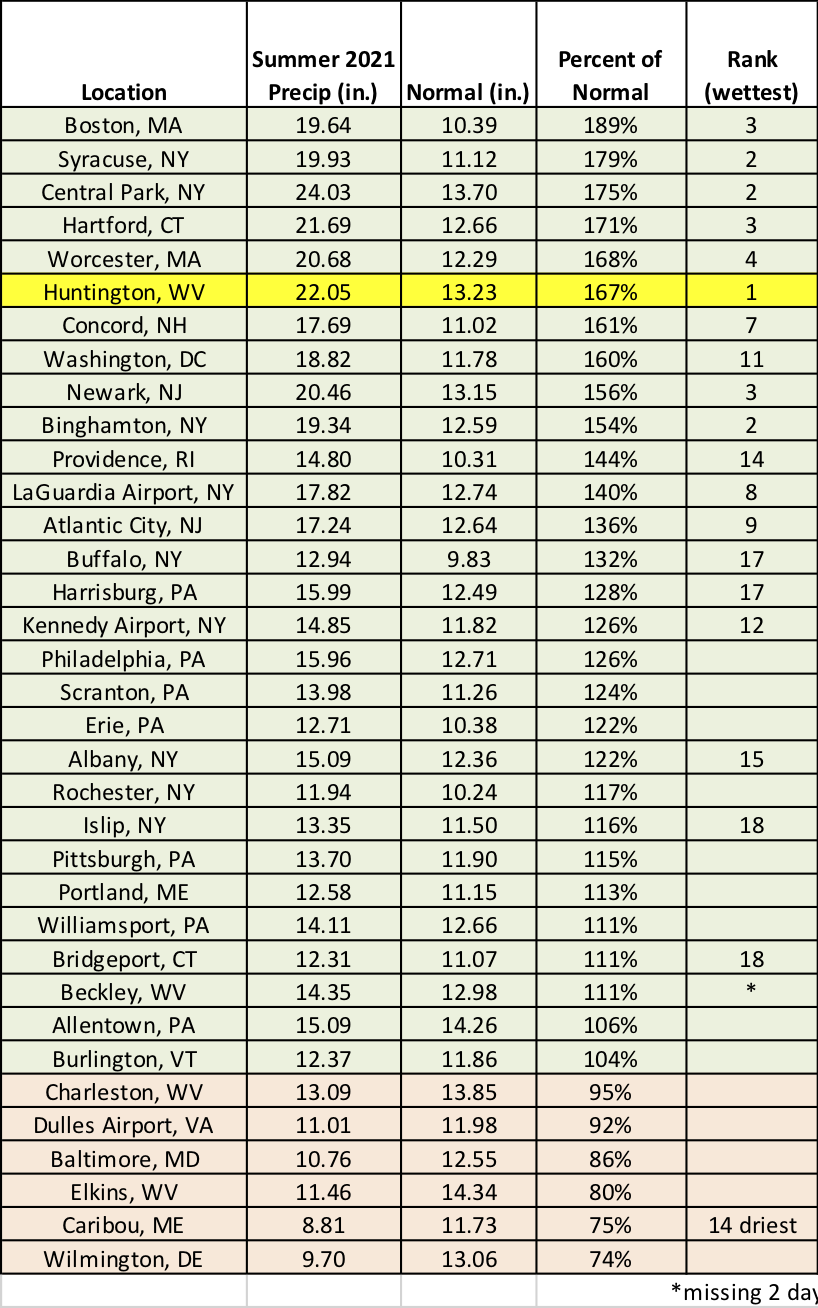
This summer was the wettest on record for Huntington, WV, and among the 20 wettest for another 18 major climate sites. However, Caribou, ME, had its 14th driest summer
For September, NOAA’s Climate Prediction Center indicates an increased likelihood of above-normal precipitation for much of the Northeast, driven by rainfall from Tropical Depression Ida, which was moving into the region as this blog was published the morning of September 1. There’s a tilt toward above-normal temperatures for New England, eastern New York, and a sliver of New Jersey, with equal chances predicted for the rest of the Northeast.
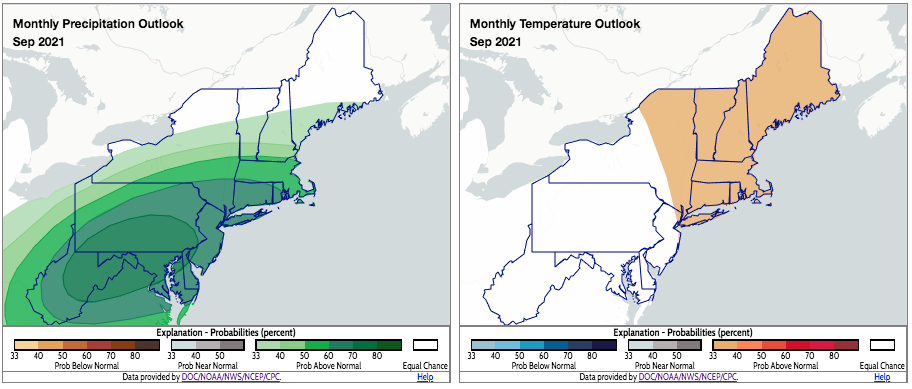
September is expected to be wetter and warmer than normal normal for several areas. Click to enlarge.