A Cold Start to March
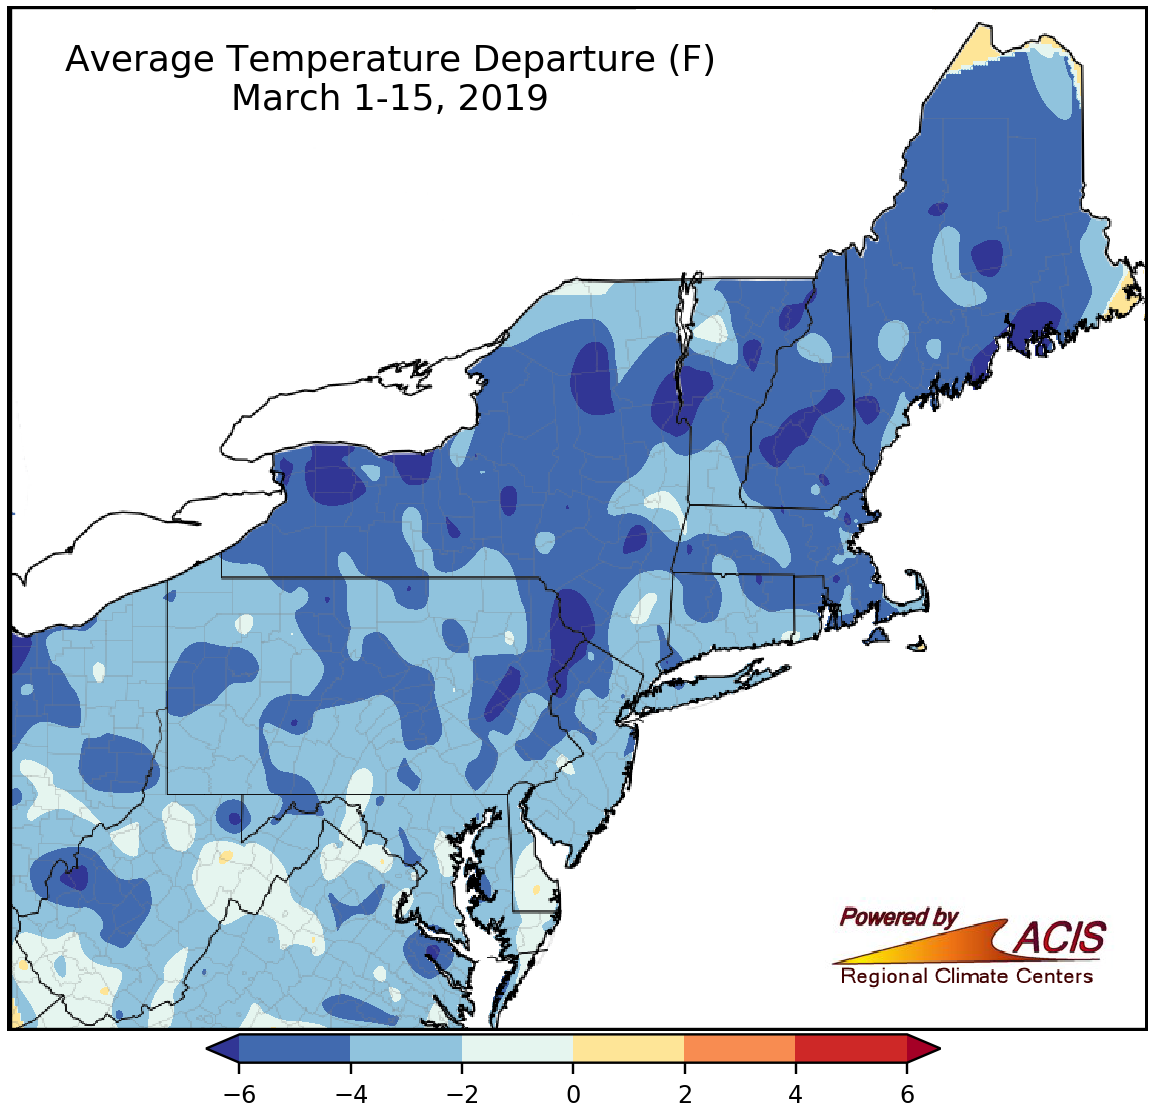
Most of the Northeast was 2°F to 6°F colder than normal from March 1-15.
The Northeast has experienced below-normal temperatures during the first half of March. Average temperatures ranged from more than 6°F below normal to near normal, with most areas 2°F to 6°F below normal. All of the 35 major climate sites were colder than normal, with departures ranging from 4.4°F below normal in Providence, RI, to 0.4°F below normal in Elkins, WV. Three sites ranked this first half of March among their 20 coldest on record.
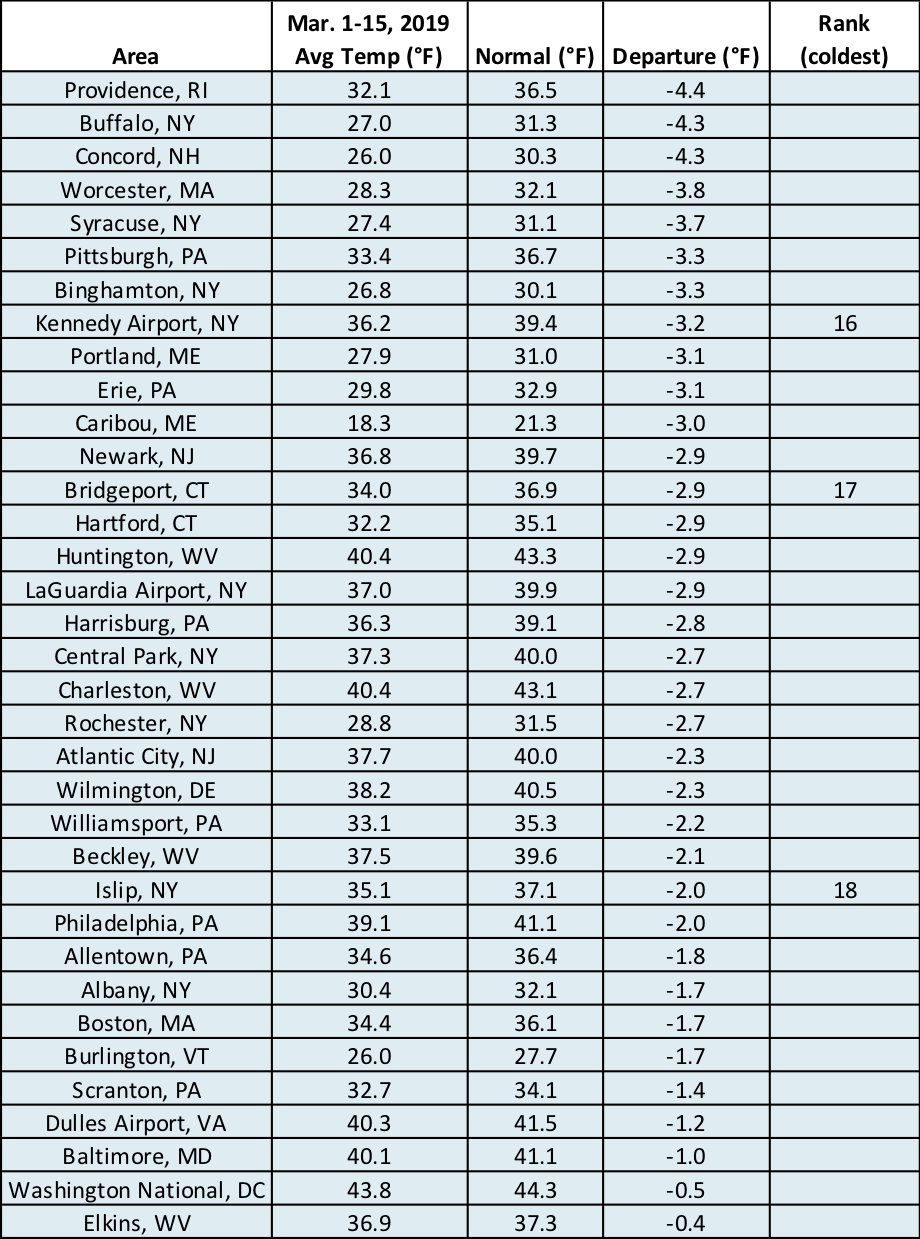
All of the major climate sites were colder than normal during the first half of March.
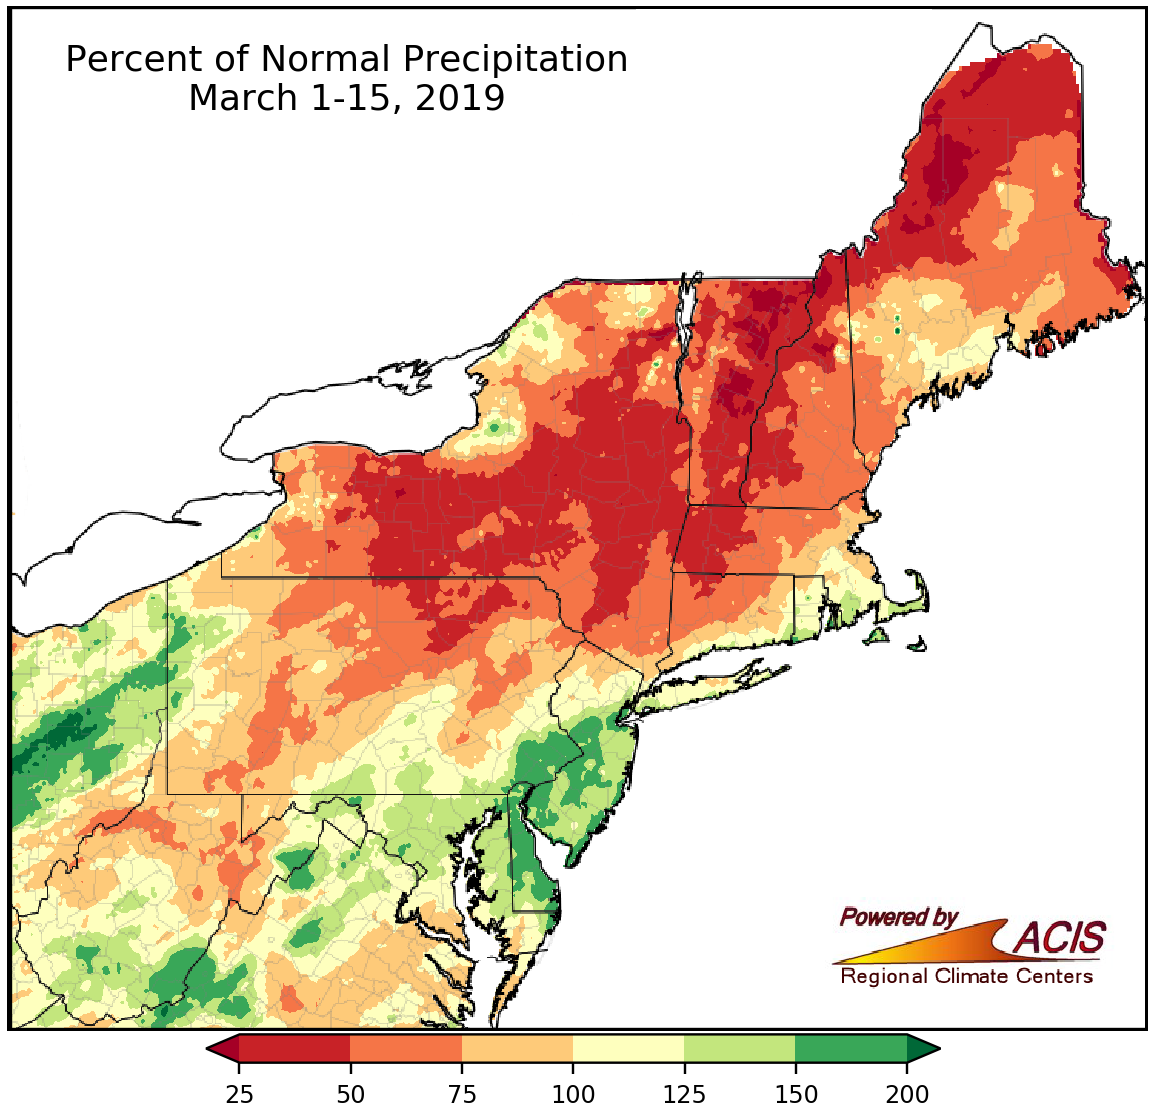
March 1-15 precipitation ranged from less than 25% of normal to 200% of normal.
Precipitation during the first half of March varied, ranging from less than 25% of normal to 200% of normal. The driest areas were in northern New England, while the wettest areas were in the southeastern corner of the region and parts of West Virginia and western Pennsylvania. At the 35 major climate sites, precipitation ranged from 28% of normal in Binghamton, NY, to 156% of normal at Kennedy Airport, NY. Three of the 14 drier-than-normal major climate sites ranked this first half of March among their 20 driest. Similarly, three of the 21 wetter-than-normal sites ranked this first half of March among their 20 wettest.
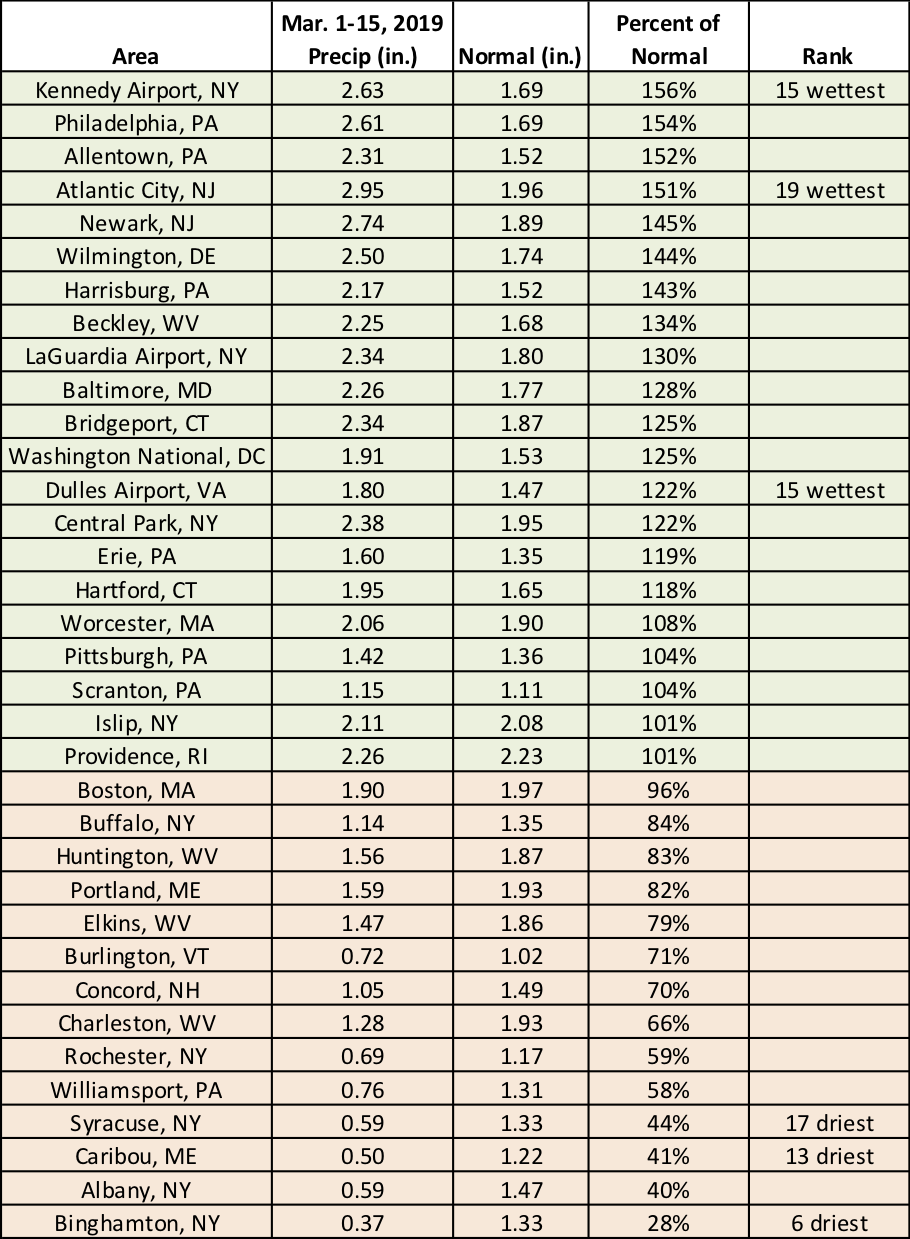
The first half of March 2019 ranked among the 20 driest on record for three major climate sites and among the 20 wettest at three other climate sites.
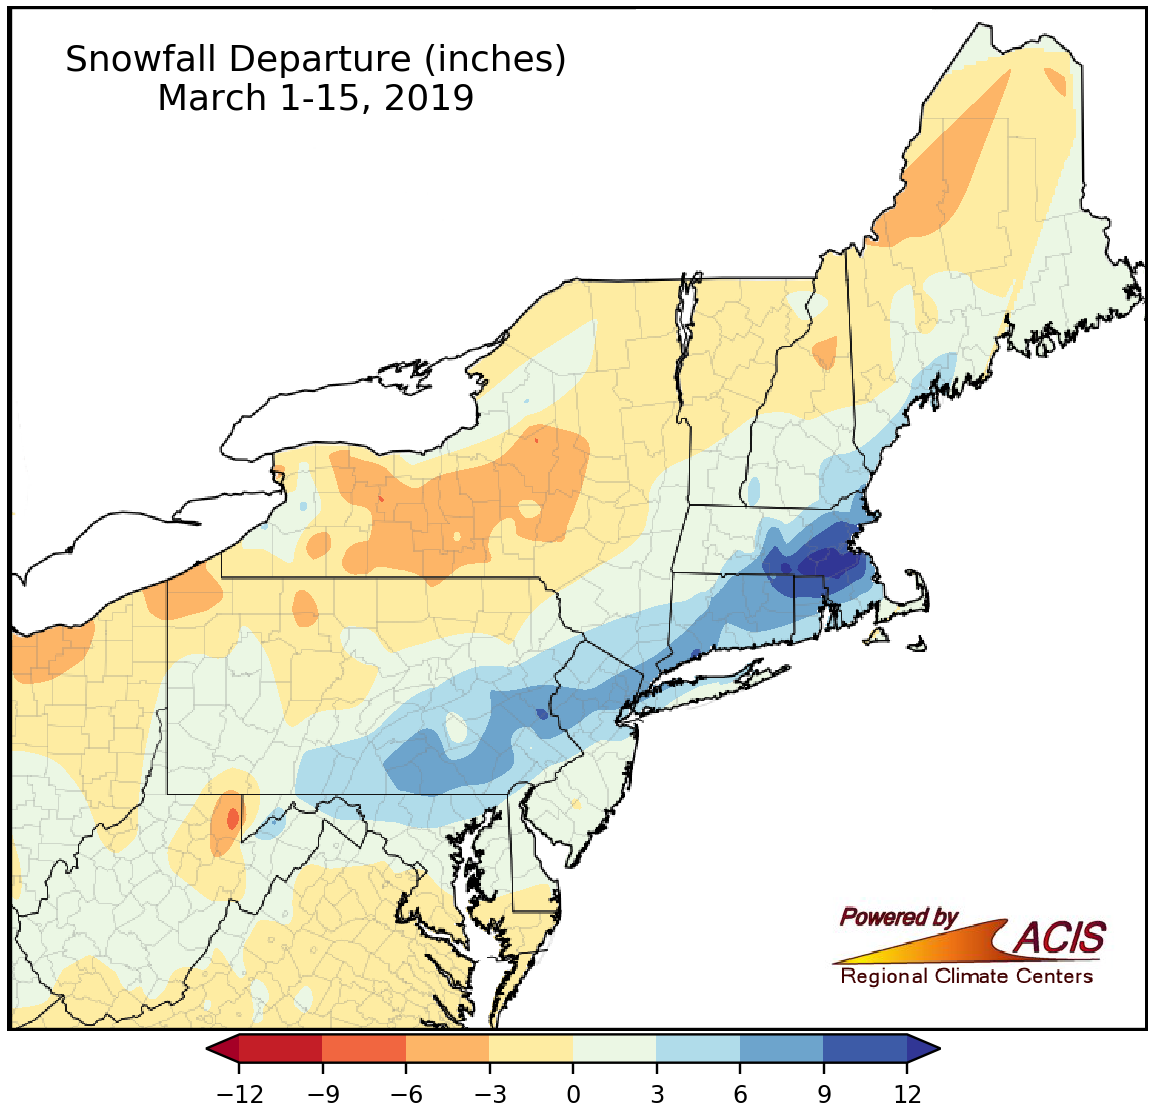
March 1-15 snowfall ranged from 6 inches below normal to more than 12 inches above normal.
While cold temperatures were in place, snowfall during the first half of March varied. The largest deficits of up to 6 inches below normal were found in western Maine, northern New Hampshire, western and central New York, northwestern Pennsylvania, and northern West Virginia. Back-to-back storms the first few days of the month supplied a snowfall surplus to areas from northern Maryland into parts of New England. In fact, the largest surplus of more than 12 inches was in Massachusetts. At the major climate sites, snowfall ranged from 5.2 inches below normal in Rochester, NY, to 10.2 inches above normal in Bridgeport, CT. Twenty-one of the 35 major climate sites were snowier than normal, with 12 sites ranking this March 1-15 period among their 20 snowiest on record.
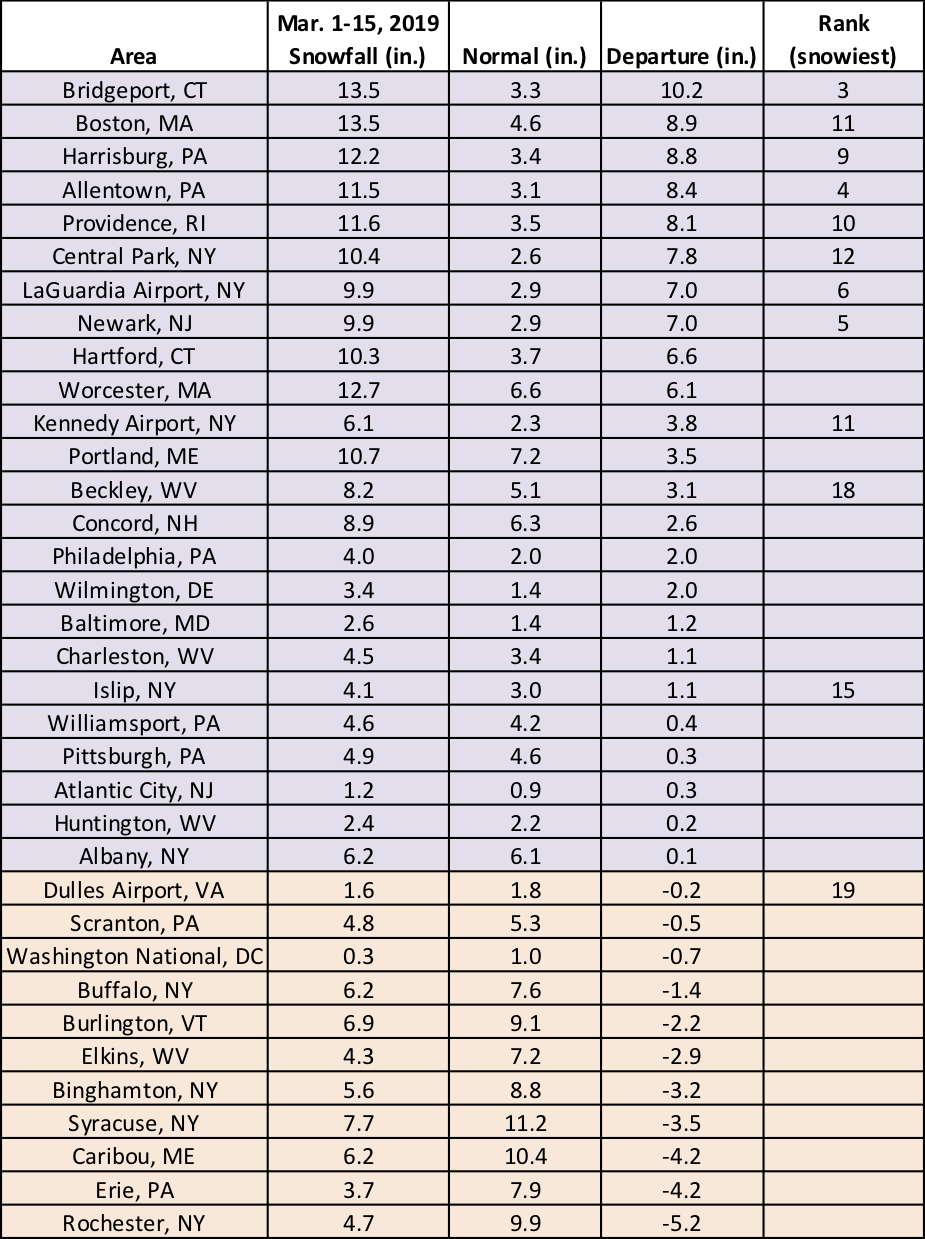
Twelve major climate sites ranked this first half of March among their 20 snowiest on record.