What Does It All Mean?
Precipitation. Snowfall. Snow Depth. Isn’t snow a type of precipitation? And snowfall is reported as a depth but it’s different than snow depth? While the answer to both those questions is “yes,” these terms mean distinctly different things when it comes to climate data. Here’s a primer using our “Daily Data for a Month” product as an example.
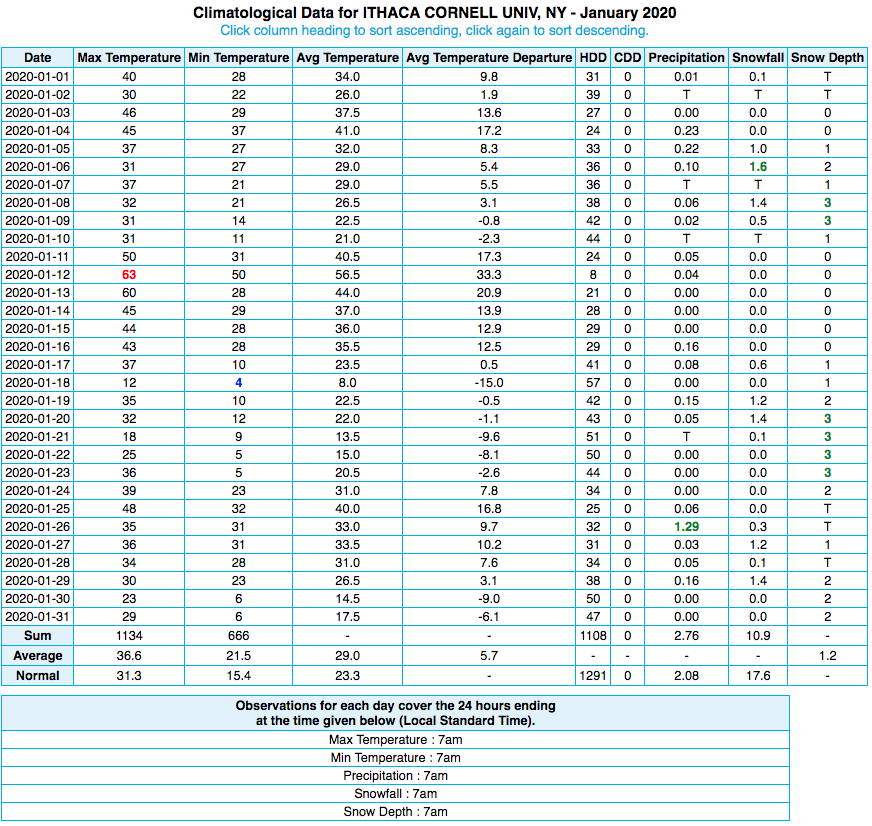
An example of the Northeast Regional Climate Center’s daily data report.
Before we get started on variables like precipitation and snowfall, let’s discuss observation times. Across the U.S., a set of dedicated volunteers trek out to their official weather stations each morning, usually around 7 AM, and report their measurements. A day is a 24-hour period ending at observation time, so the weather conditions reported on January 2 actually occurred sometime between the morning of January 1 and the morning of January 2. A majority of the weather observers in the Northeast take their observations in the morning.
However, there are some sites, mostly airports, that report at midnight. In those cases, what’s reported on a day actually occurred on that day (so January 2 conditions occurred between midnight and 11:59 PM on January 2). There are also a few sites that report in the evening. Observation time is quite important for determining when weather conditions occurred. You can find a site’s observation time at the bottom of the “Daily Data for a Month” report. By the way, observation times are unreliable prior to 1982 so we don’t include them.
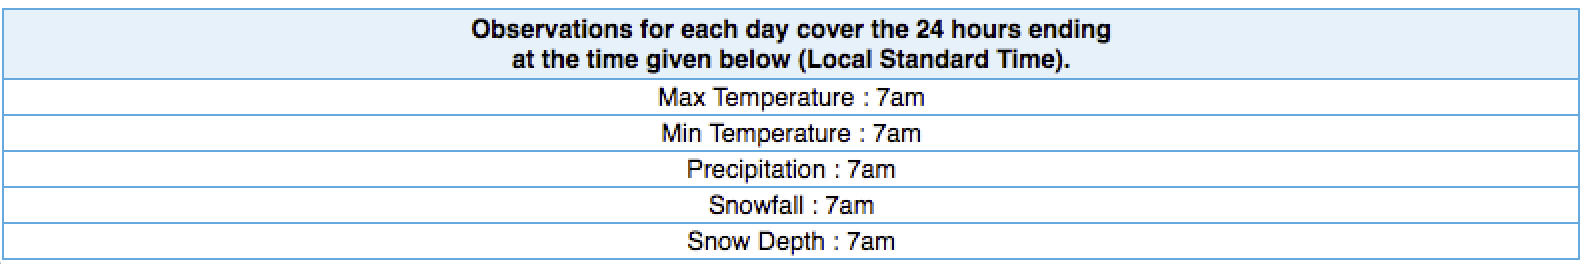
Observation times are key to figuring out when weather conditions occurred.
Ok, about those variables. First up is precipitation. Some folks assume that this is rainfall. It can be but isn’t always. Precipitation is actually rain and/or the liquid equivalent of snow and ice. While precipitation would likely be just rain during summer, it also would include melted snow during the colder months. Precipitation is reported to the nearest 1/100 of an inch (0.01).
Next is snowfall, which is the amount of new snow and ice that fell during the observation period. For daily data, that’s the snow and ice that fell in a 24-hour period, say between the mornings of January 1 and January 2. Snowfall resets to 0" at the end of the observation period to be measured and reported the next observation period. Snowfall is measured to the nearest 1/10 of an inch (0.1).
And then we have snow depth, which is the total depth of (new and old) snow and ice on the ground at observation time. It’s sort of like snow’s school photo - a lovely snapshot of that one moment in time - but on a daily basis. Snow depth changes with the weather. For instance, if there were several days in a row with over an inch of snowfall, the snow depth would increase each day as the snow piled up. But, if there was a warm-up or some rain, the snow depth would decrease. Snow depth is reported to the nearest inch.
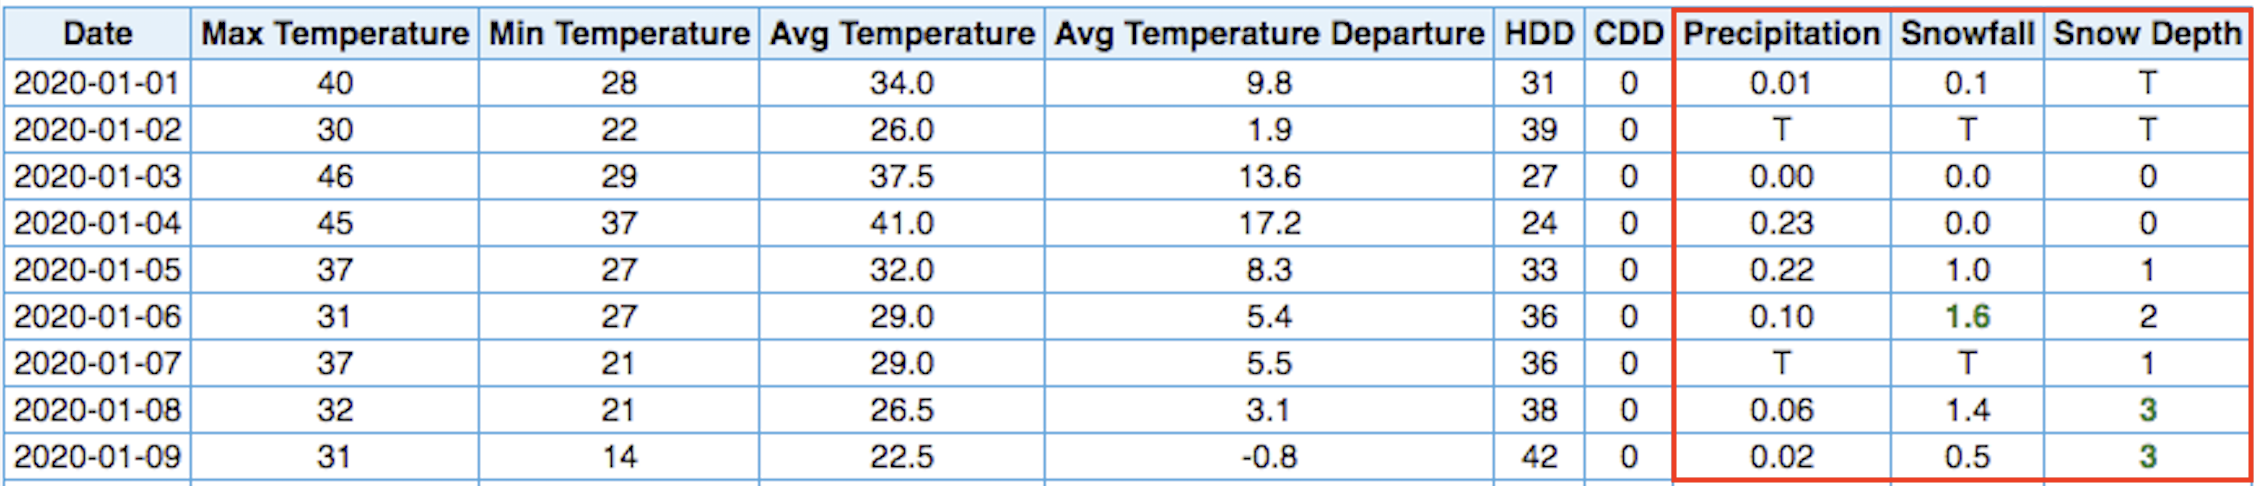
Precipitation, snowfall, and snow depth are all different measurements.
Along with the 1, 2, 3s of precipitation and snowfall, you may also see some A, B, Cs…well, more like T, M, S, and As.
T - Imagine you’re outside and a few sprinkles drop down on you. That’s all. It was there but not measurable. We’d call that a trace. Technically speaking, it’s less than 0.01" of precipitation, less than 0.1" of snow, or less than 0.5" of snow depth. Trace amounts are treated as 0s and do not get tallied in monthly or annual sums.
M - It means missing. Perhaps the observation wasn’t taken. Perhaps the observation was taken but quality control experts deemed it highly questionable (how did you have no precipitation or snowfall yet your snow depth increased by 2 inches?!). Whatever the reason, that observation is not there.
S & A - Sometimes observers take a vacation or get sick or life happens. In these cases, you might see an S and A in the data. The S means subsequent, or that day is missing but it’s included in a subsequent value. After that you may see some Ms (but don’t worry, they’re accounted for). Finally, you’ll see an A, which means accumulated and marks the accumulated value (including that day, the first day of accumulation marked S, and all the “missing” days in between).
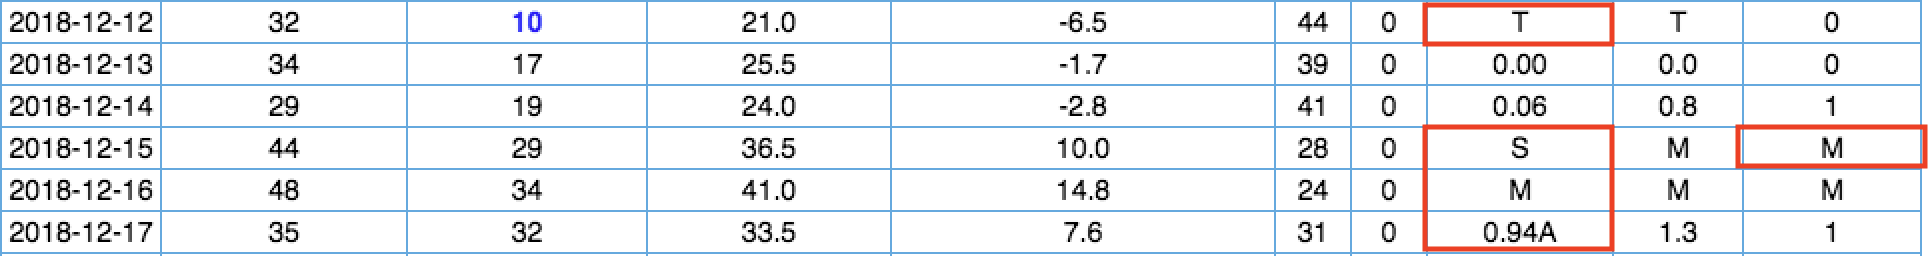
Traces, missing data, and accumulations are also noted in the report.
What is “normal,” really? Well in climate-speak, it’s a 30-year average. Specifically, the most recent 30-year period ending in a “0” year. The current climate normals are calculated for 1981-2010 but after 2020 “new normals” will be calculated. Climatologists can be a little like Bubba from Forrest Gump when it comes to normals - “above normal, below normal, percent of normal, departure from normal, warmer than normal, less snow than normal…” Why? Normals are a good way to show how recent conditions compare to historical conditions and they give folks an idea of what conditions can typically be expected at a location.

Climate normals are an average of a variable over a set 30-year period.