January - Winter Arrives
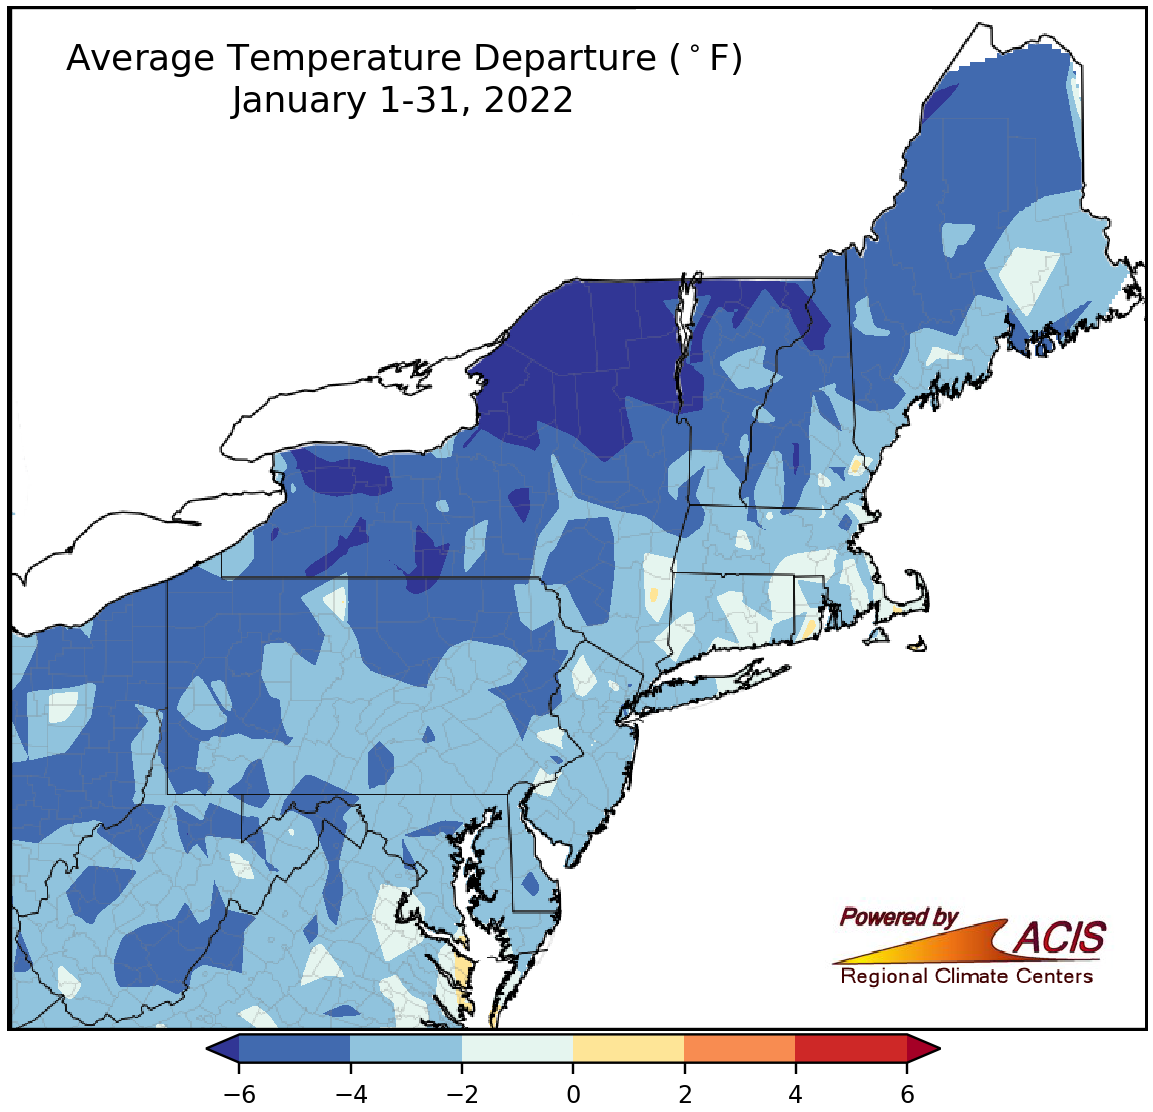
January average temperatures ranged from more than 6°F below normal to near normal.
January was a colder-than-normal month for the Northeast, with the greatest departures from normal of more than 6°F in parts of New York and northern New England. January average temperatures at the 35 major climate sites ranged from 6.9°F below normal in Burlington, VT, to 1.3°F below normal in Philadelphia, PA, with two of the sites experiencing one of their 20 coldest Januaries on record.
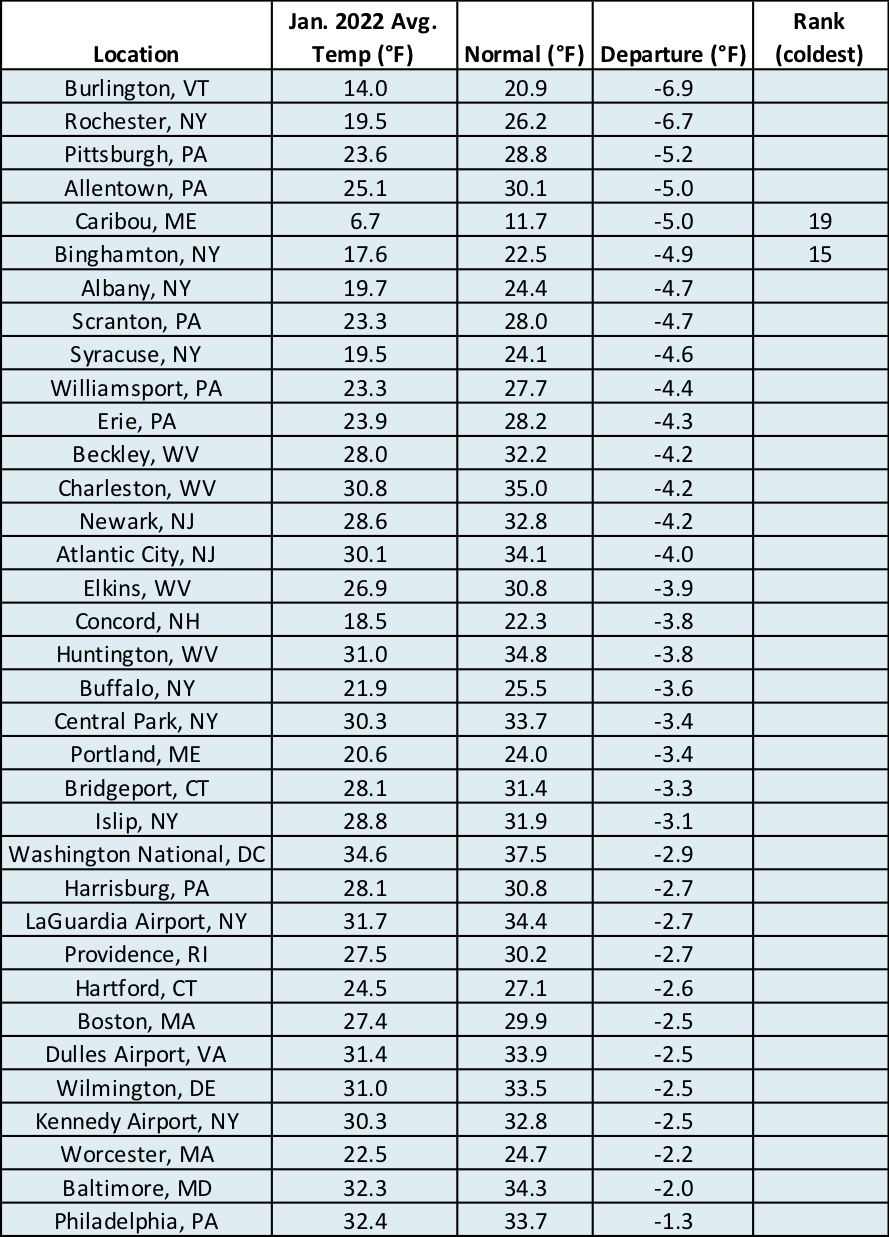
January temperatures were as much as 6.9°F below normal at the major climate sites, with two of the sites ranking this January among their 20 coldest on record.
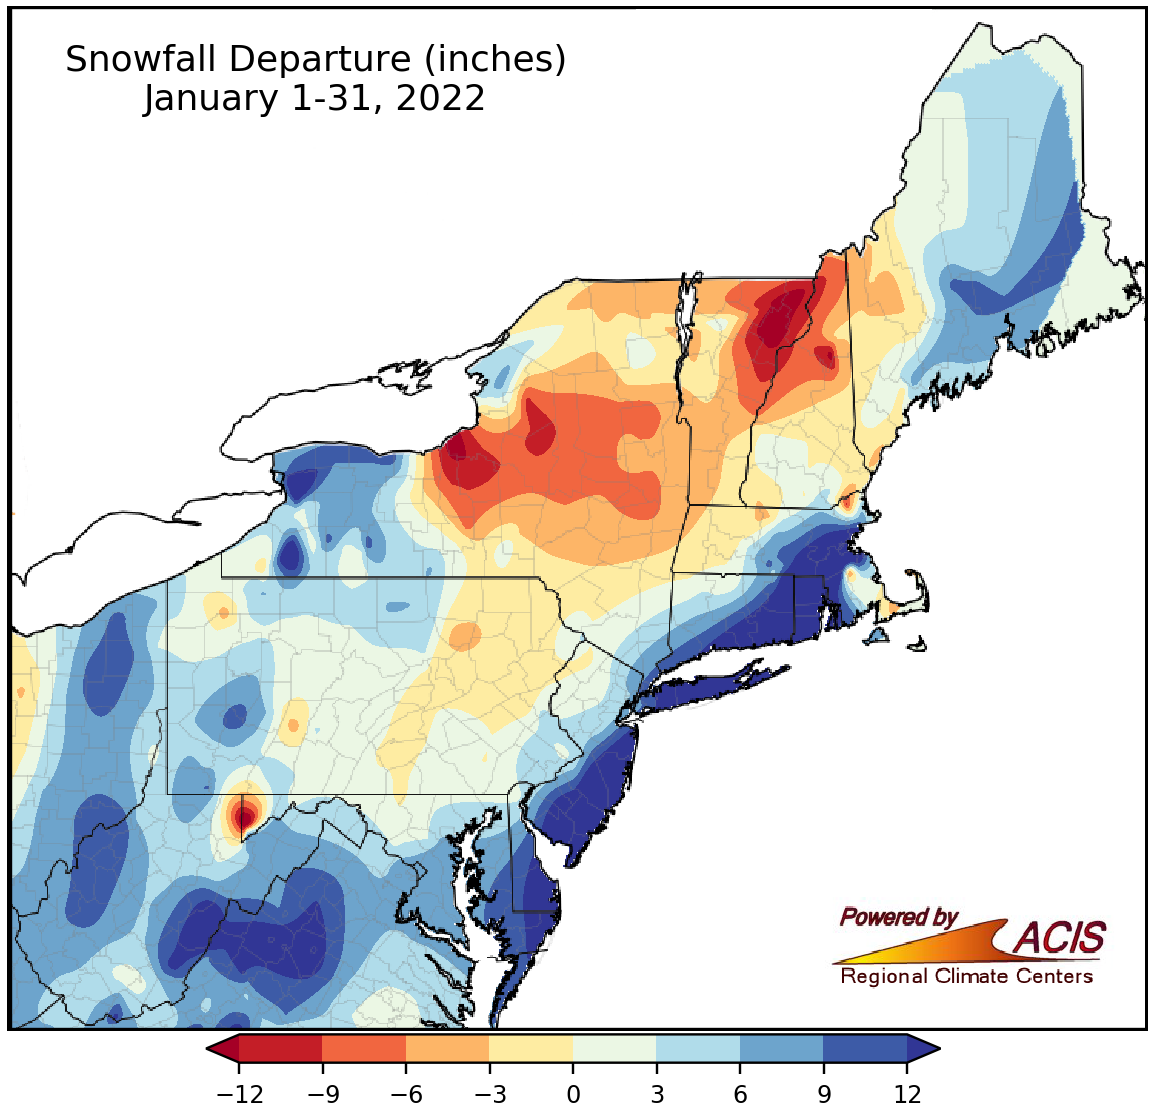
January snowfall ranged from more than 12 inches below normal to more than 12 inches above normal.
There were frequent snowstorms during January, including a mid-January storm that dropped up to 24 inches of snow on interior parts of the Northeast and a late-month blizzard that dumped up to 30 inches of snow on coastal locations. January snowfall ranged from more than 12 inches below normal in parts of central New York and northeastern Vermont to more than 12 inches above normal in western New York, southeastern West Virginia, and coastal areas from Maryland to Massachusetts. Twenty-six of the 35 major climate sites experienced a snowier-than-normal January, with snowfall for all sites ranging from 10.5 inches below normal in Syracuse, NY, to 27.5 inches above normal in Atlantic City, NJ, its snowiest January on record. In fact, this January ranked among the 20 snowiest Januaries on record for 20 major climate sites and among the 20 all-time snowiest months on record for nine major climate sites.
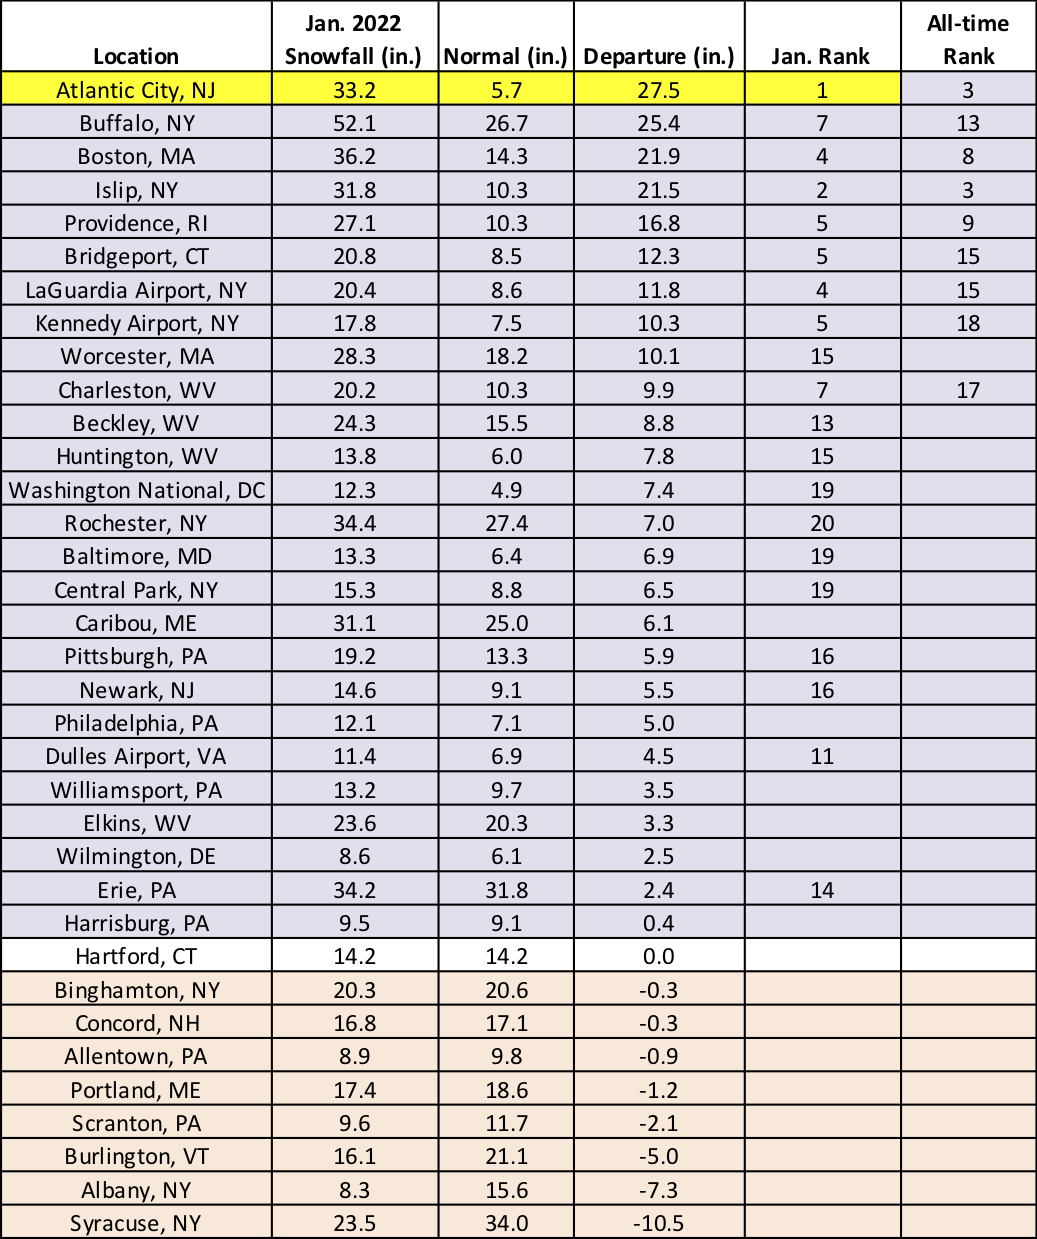
This January was the snowiest January on record for Atlantic City, NJ, and among the 20 snowiest Januaries on record for another 19 major climate sites. It also ranked among the 20 all-time snowiest months on record for nine major climate sites.
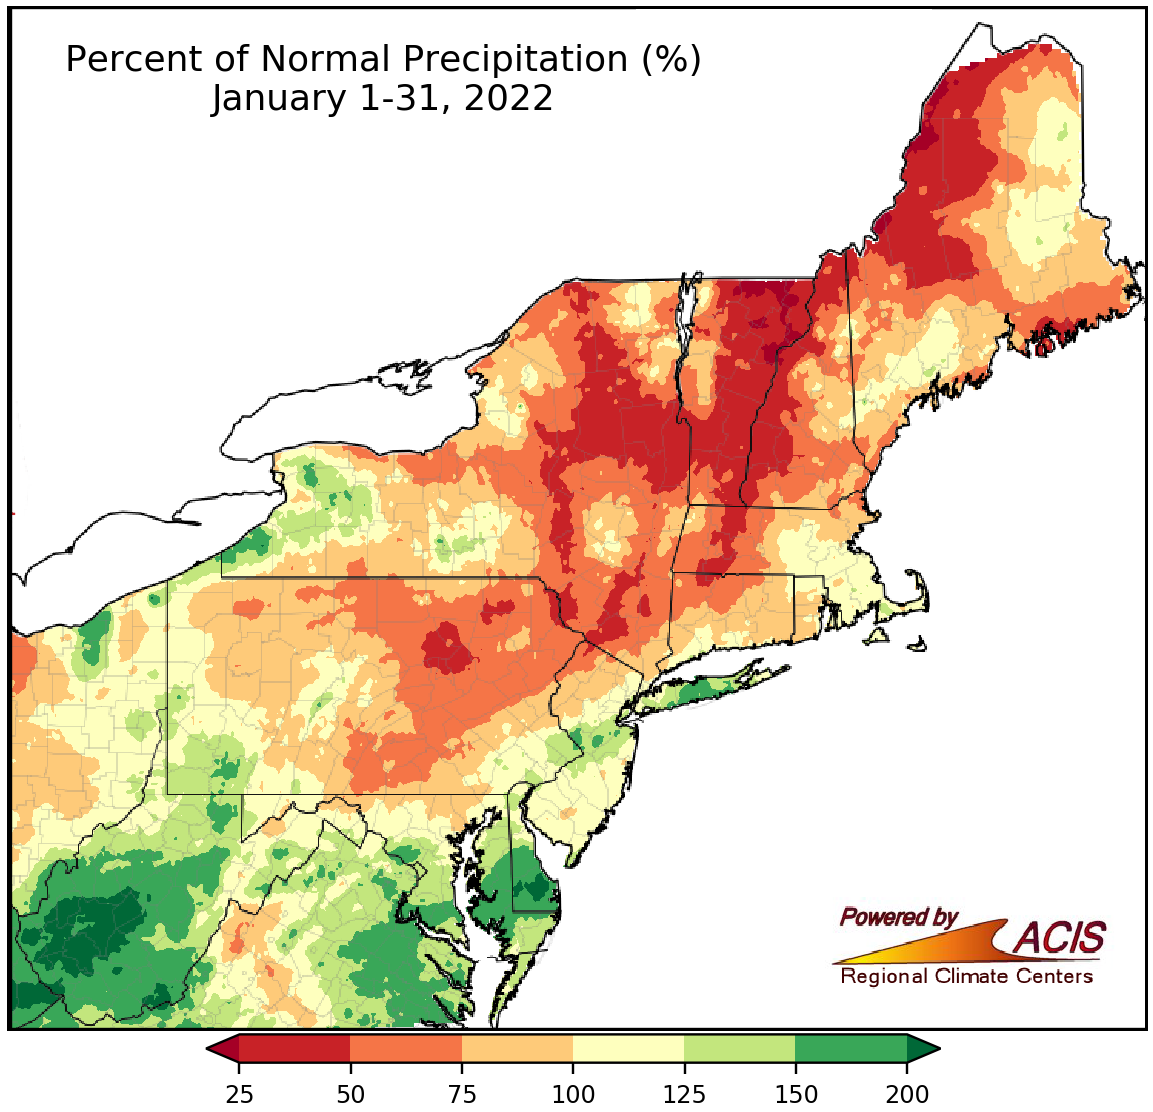
January precipitation ranged from 25% to more than 200% of normal.
January precipitation ranged from less than 25% of normal in northeastern Vermont to more than 200% of normal in southern West Virginia and southern Delaware. At the 35 major climate sites, January precipitation ranged from 44% of normal in Burlington, VT, to 179% of normal in Charleston, WV, with 19 being drier than normal and 16 being wetter than normal. This January ranked as the 17th driest January on record for Hartford, CT, but among the 20 wettest Januaries for seven of the sites.
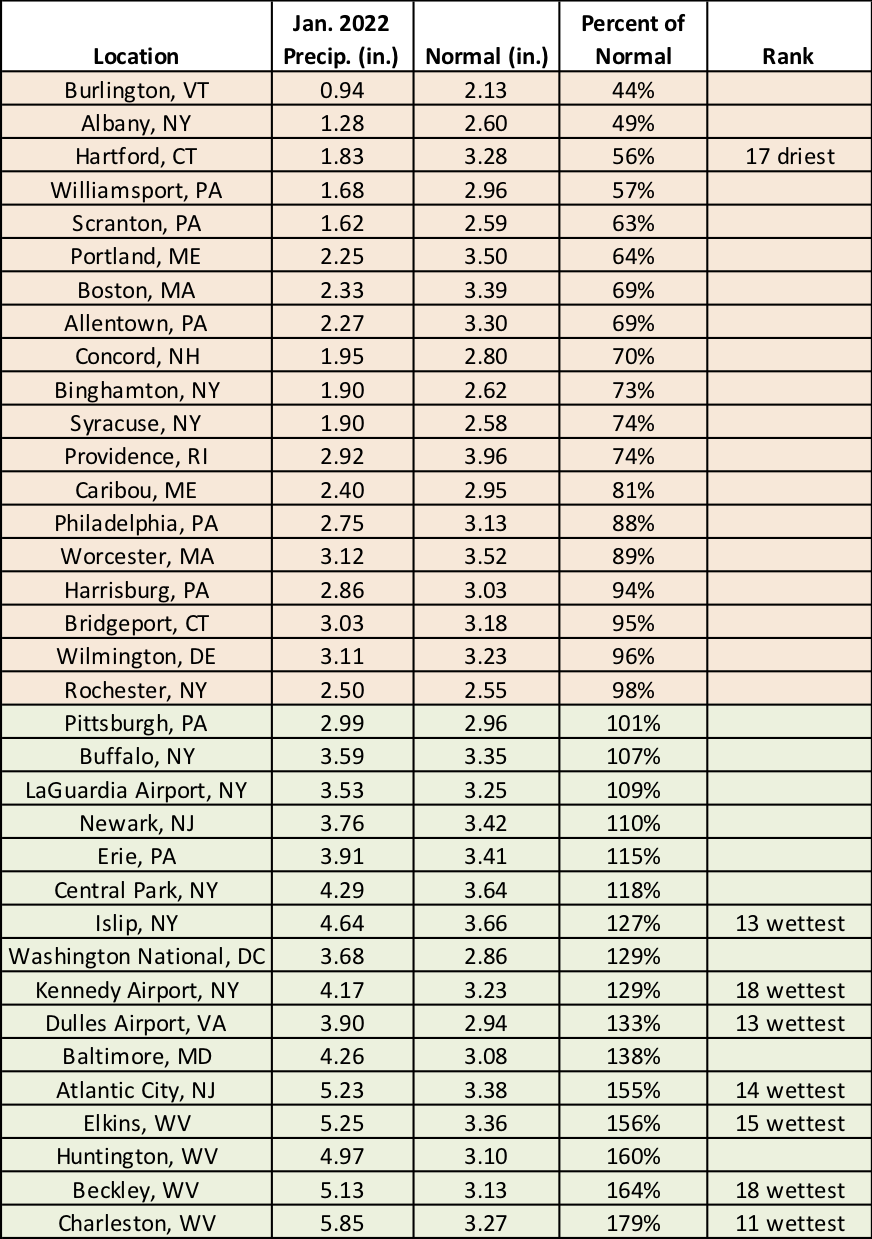
This January was the 17th driest on record for Hartford, CT, but among the 20 wettest for seven of the sites.
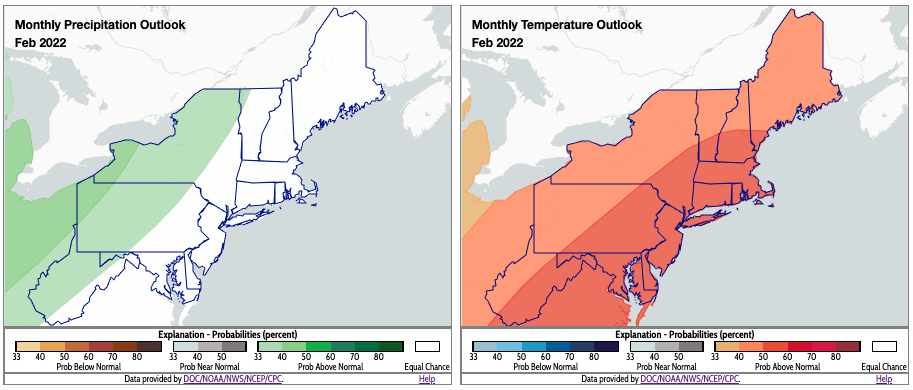
For February, NOAA’s Climate Prediction Center favors above-normal precipitation for interior locations and above-normal temperatures for the entire region. Click to enlarge.
Above-normal precipitation is favored for February for interior parts of the Northeast, according to NOAA’s Climate Prediction Center. Meanwhile, there’s a tilt toward above-normal temperatures for the entire Northeast for February.