Wet or Dry Through Mid-July
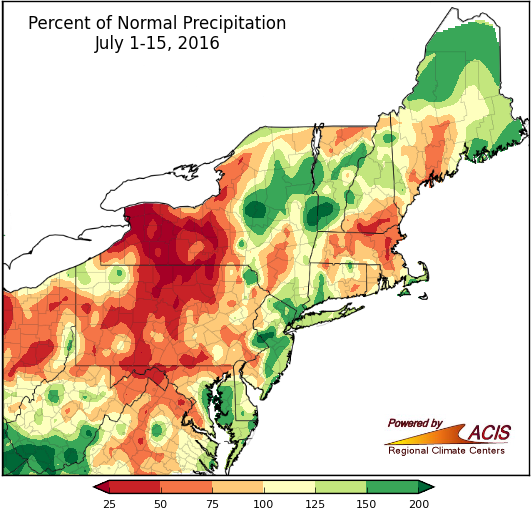
Precipitation during the first two weeks of July ranged from less than 25% of normal to more than 200% of normal.
Rainfall was highly variable during the first half of July. The driest spots, which saw less than 25% of normal, were in western New York and northern Pennsylvania. The wettest areas, which saw more than 200% of normal, were scattered throughout the region. Nineteen of the Northeast’s 35 major climate sites were drier than normal, with four ranking the first half of July 2016 among their top 20 driest. Conversely, 16 sites were wetter than normal, with eight of those having a top 20 wet start to July.
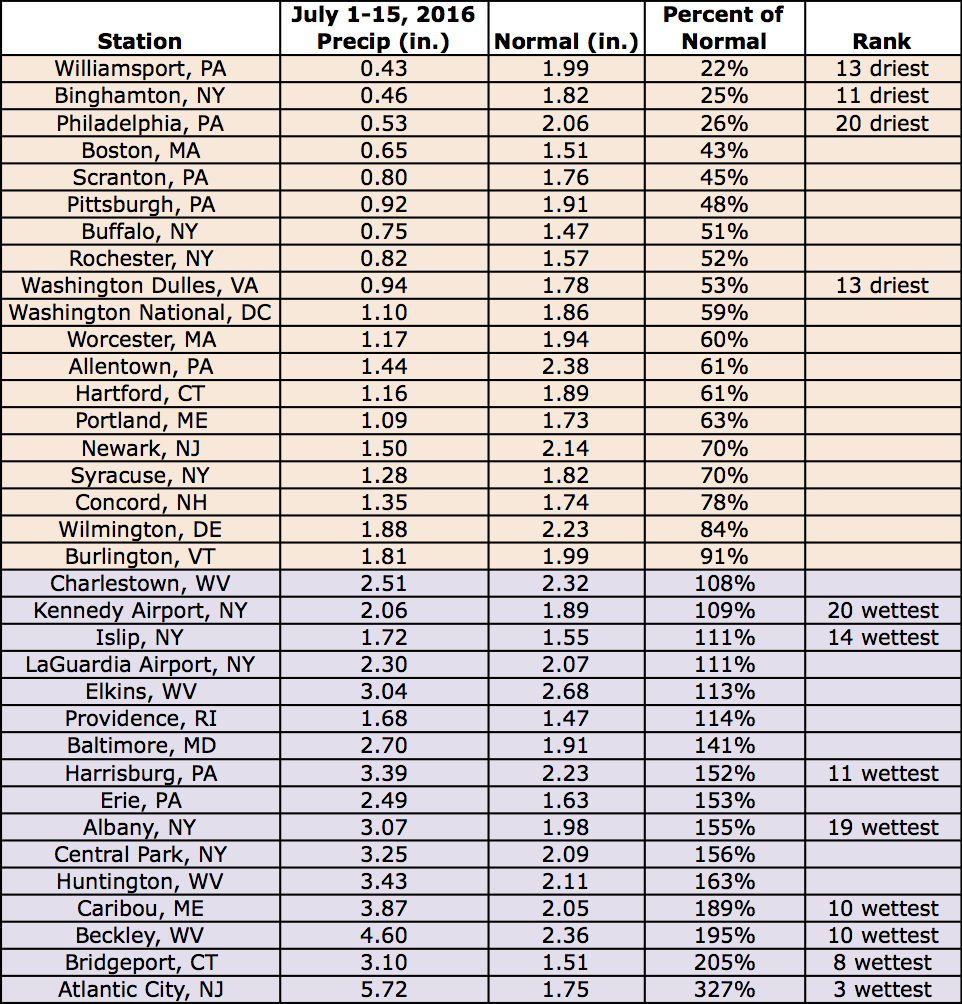
At the major climate sites, July 1-15 precipitation ranged from 22% of normal in Williamsport, PA to 327% of normal in Atlantic City, NJ.
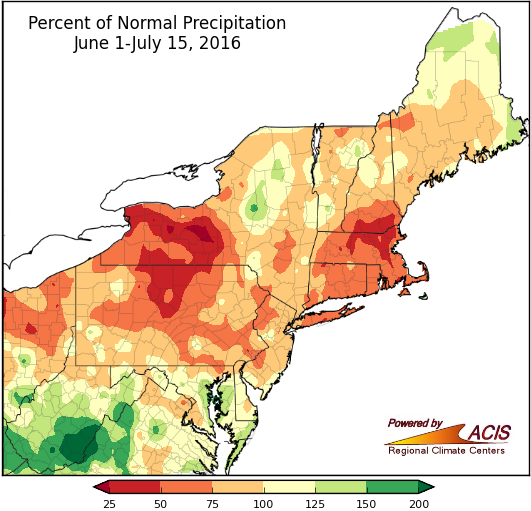
Summer so far has been drier than normal for a large portion of the region.
Since June 1, much of the Northeast has seen less than 125% of normal precipitation. Central and western New York, northern Pennsylvania, southern New Hampshire, and parts of Massachusetts have been the driest at less than 50% of normal, while southern West Virginia has been the wettest at more than 150% of normal. Twenty-five of the major climate sites were drier than normal, with 11 of them ranking the first half of summer 2016 among their top 20 driest. Six of the nine wetter-than-normal sites had a top 20 wet start to summer.
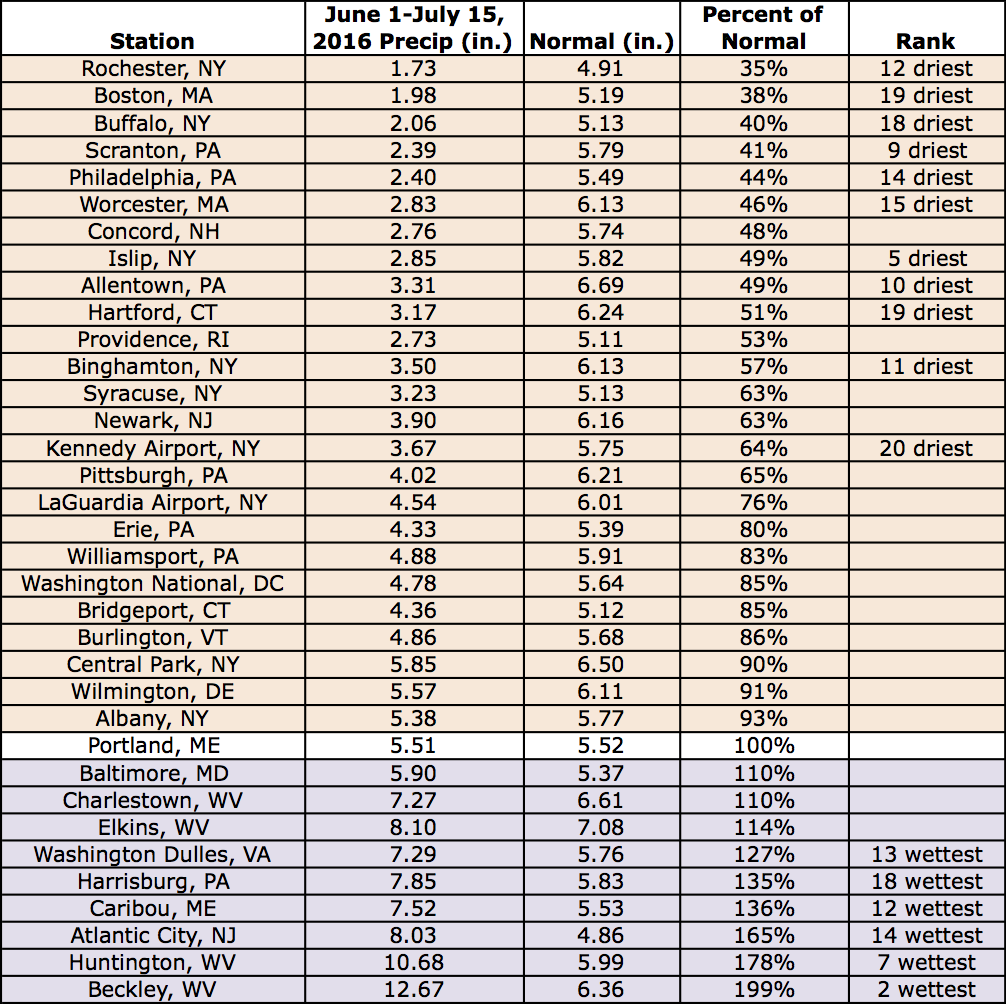
During the first half of summer, precipitation ranged from 35% of normal in Rochester, NY to 199% of normal in Beckley, WV at the major climate sites.
The ongoing lack of precipitation contributed to worsening drought conditions. At the start of June, only a small portion of south-central Pennsylvania (less than 1% of the Northeast) was experiencing moderate drought. However, by mid-July, 23% of the region was experiencing either moderate or severe drought. For more information on the drought, check out the Northeast Drought Impacts and Outlook document.
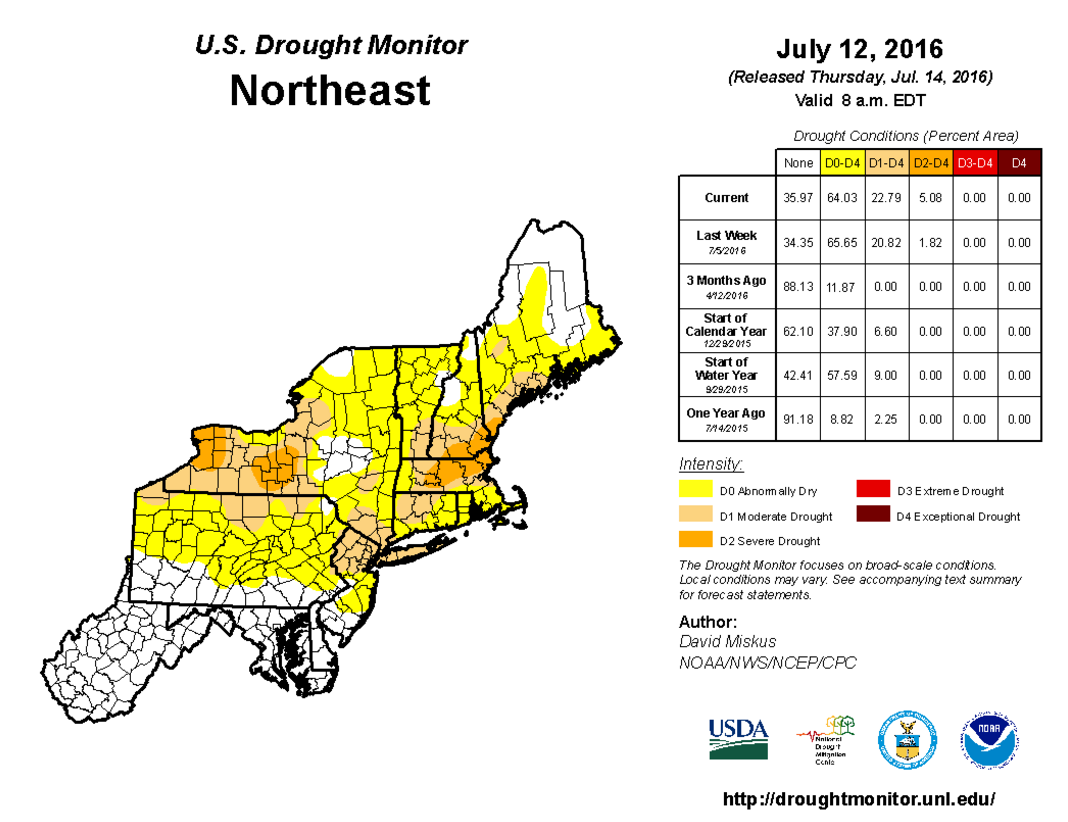
Abnormally dry (yellow areas) and drought (tan and orange areas) conditions expanded during June and July. Click to enlarge.
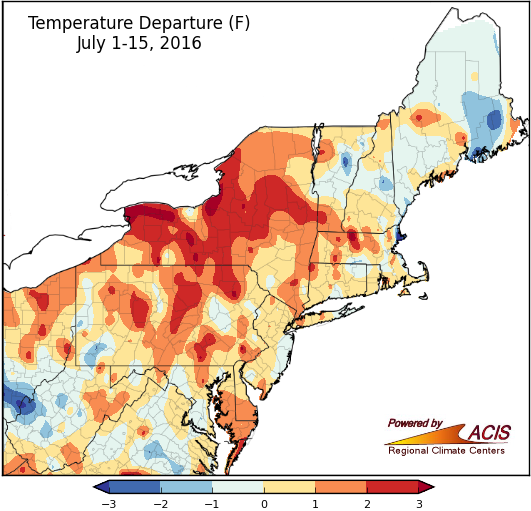
July 1-15 average temperatures were generally near to above normal for most of the Northeast.
Average temperature during the first two weeks of July also varied, ranging from 3°F below normal in parts of West Virginia and Maine to more than 3°F above normal in portions of New York. Most areas, though, saw average temperatures ranging 1°F below normal to 3°F above normal. Twenty-seven of the 35 major climate sites were warmer than normal, with 13 of them ranking the first half of July 2016 among their top 20 warmest.
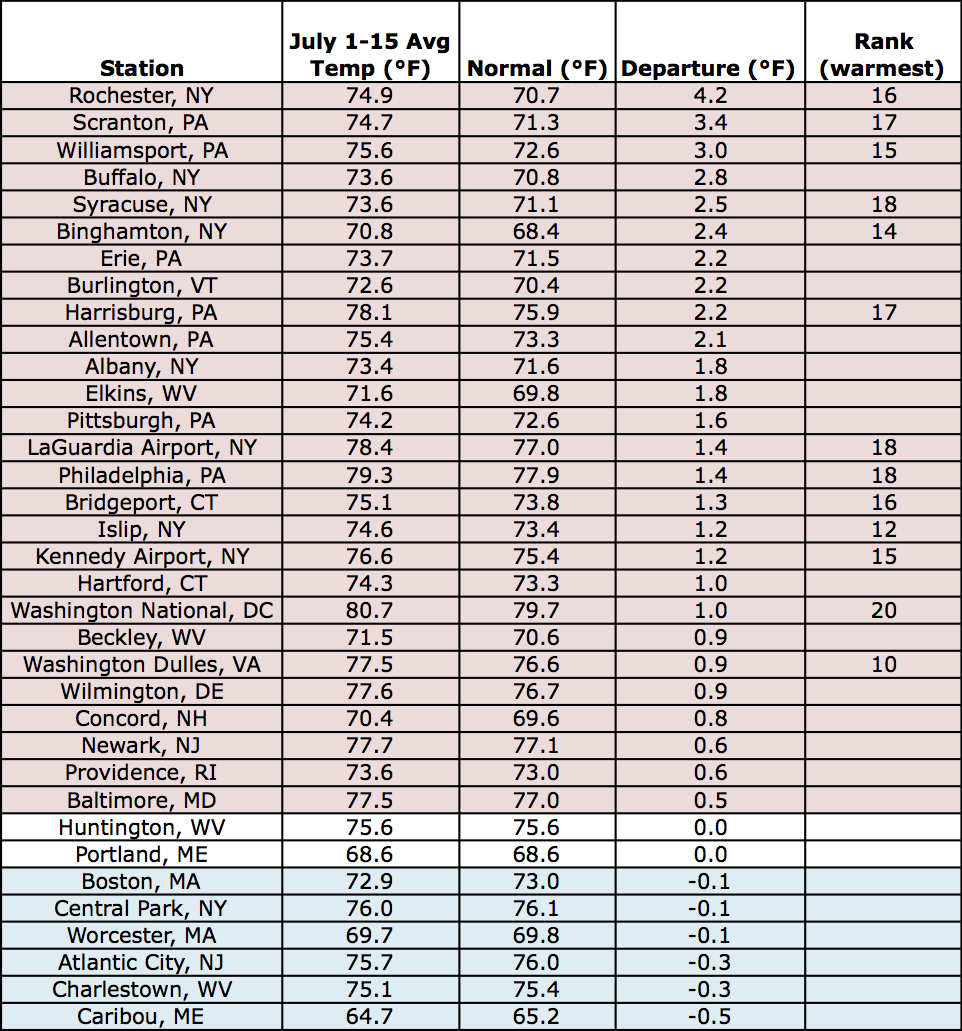
Average temperatures at the major climate sites ranged from 0.5°F below normal in Caribou, ME to 4.2°F above normal in Rochester, NY during the first two weeks of July.
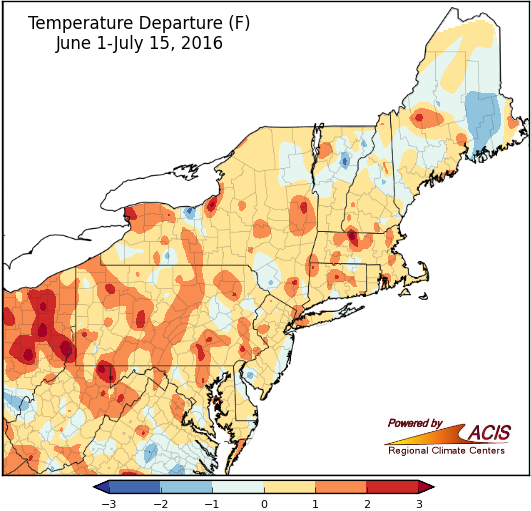
During the first half of summer, average temperatures were near to above normal for many areas.
June 1-July 15 average temperatures were generally within 2°F of normal, with most places near to above normal. The major climate sites also saw near to above-normal temperatures, with 14 having a top 20 warm start to summer.
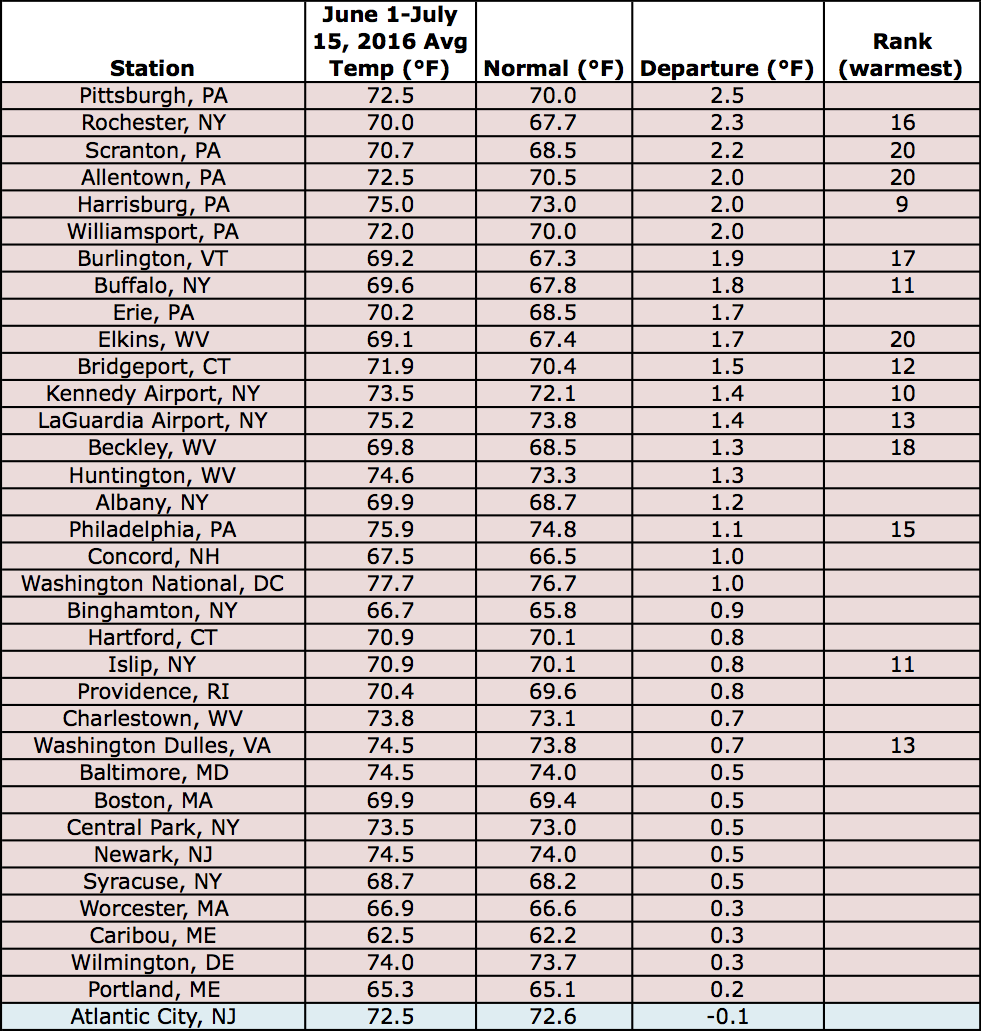
June 1-July average temperatures at the major climate sites ranged from 0.1°F below normal in Atlantic City, NJ to 2.5°F above normal in Pittsburgh, PA.