Mid-June - A Little Bit of Everything
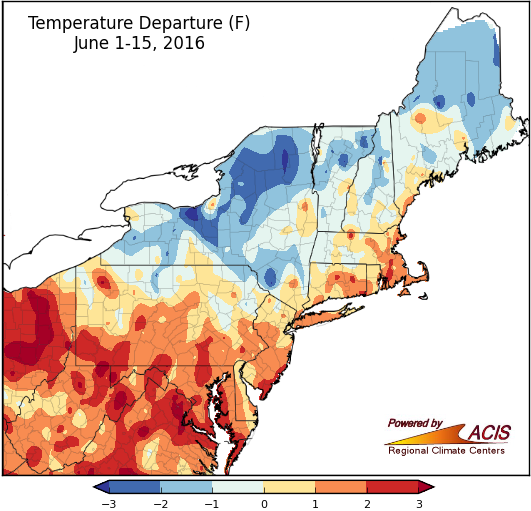
Much of New York and northern New England saw below-normal temperatures from June 1-15, while the rest of the Northeast was warmer.
During the first two weeks of June, average temperatures generally ranged from 3°F below normal to 3°F above normal. The coolest spots were in northern and central New York, while the warmest spots were in West Virginia, southern Pennsylvania, and Maryland.
At the region’s 35 major climate sites, average temperatures ranged from 1.8°F below normal in Syracuse, NY to 3.2°F above normal in Pittsburgh, PA. Overall, 27 of the sites experienced above-normal temperatures during the first half of June.
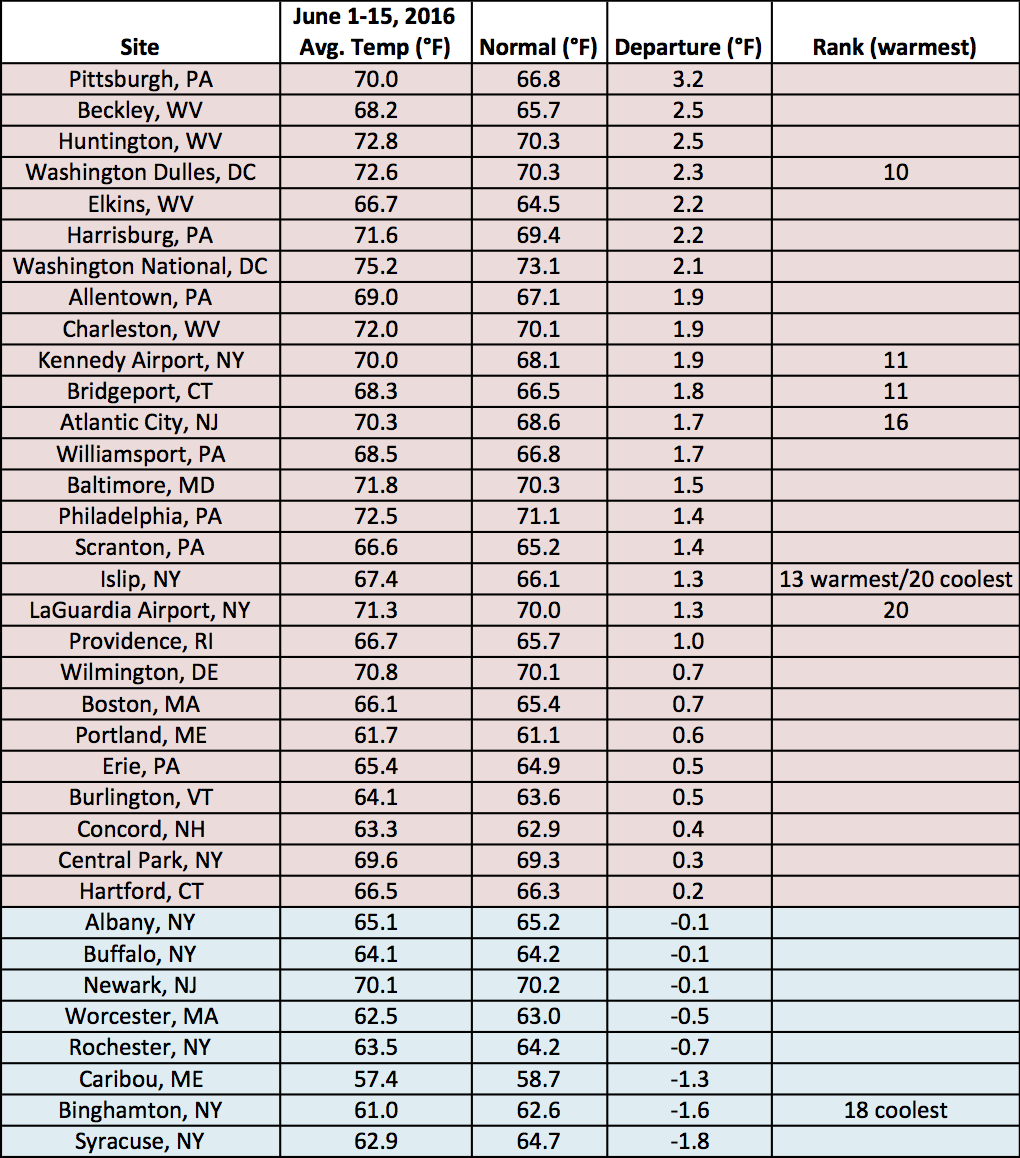
Six sites ranked the first half of June 2016 among their top 20 warmest, while two sites ranked it among their top 20 coolest. Due to Islip, NY’s short period of record (since 1984), the temperature ranked among the site’s top 20 warmest and coolest.
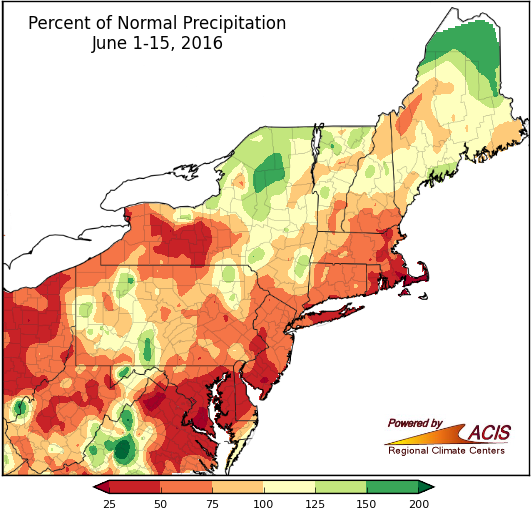
Precipitation during the first two weeks of June was near to below normal for a large portion of the region.
June 1-15 precipitation ranged from less than 25% of normal in the eastern half of Maryland, southern New Jersey, and Cape Cod, MA to more than 150% of normal in far northern Maine, northern New York, and localized spots throughout the region. Precipitation at the major climate sites ranged from 19% of normal in Atlantic City, NJ to 189% of normal in Huntington, WV. Twenty-nine of the 35 sites were drier than normal during the first half of June.
Continued below-normal precipitation led to the expansion of abnormal dryness in New England and the introduction of moderate drought in northern New Jersey and southeastern New York. However, the region could see above-normal precipitation through the end of the month.
As for snow, Mount Washington, NH received 6.9 inches of it so far this month, which is 6.1 inches above normal. That currently makes it the site’s third snowiest June on record.
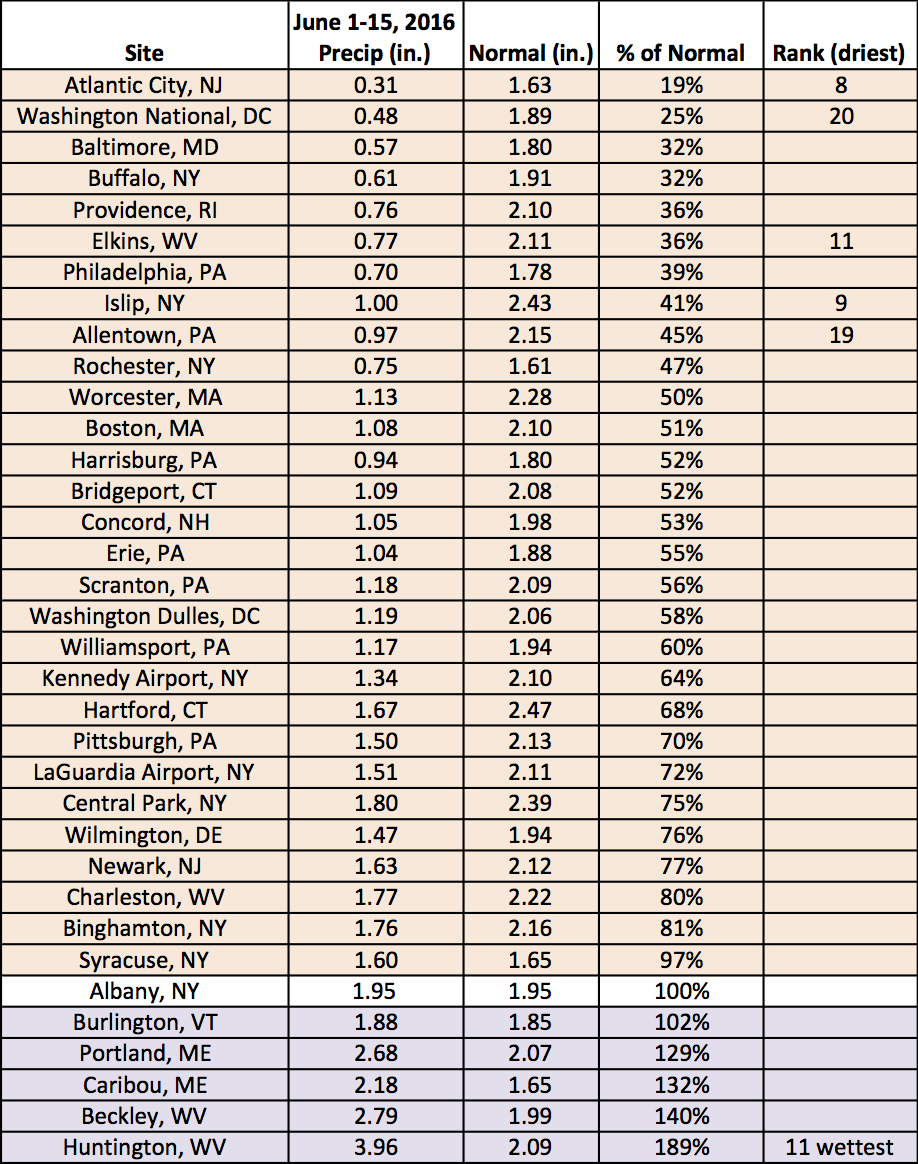
Five sites ranked the June 1-15 period this year among their top 20 driest, while Huntington, WV ranked it as its 11th wettest.
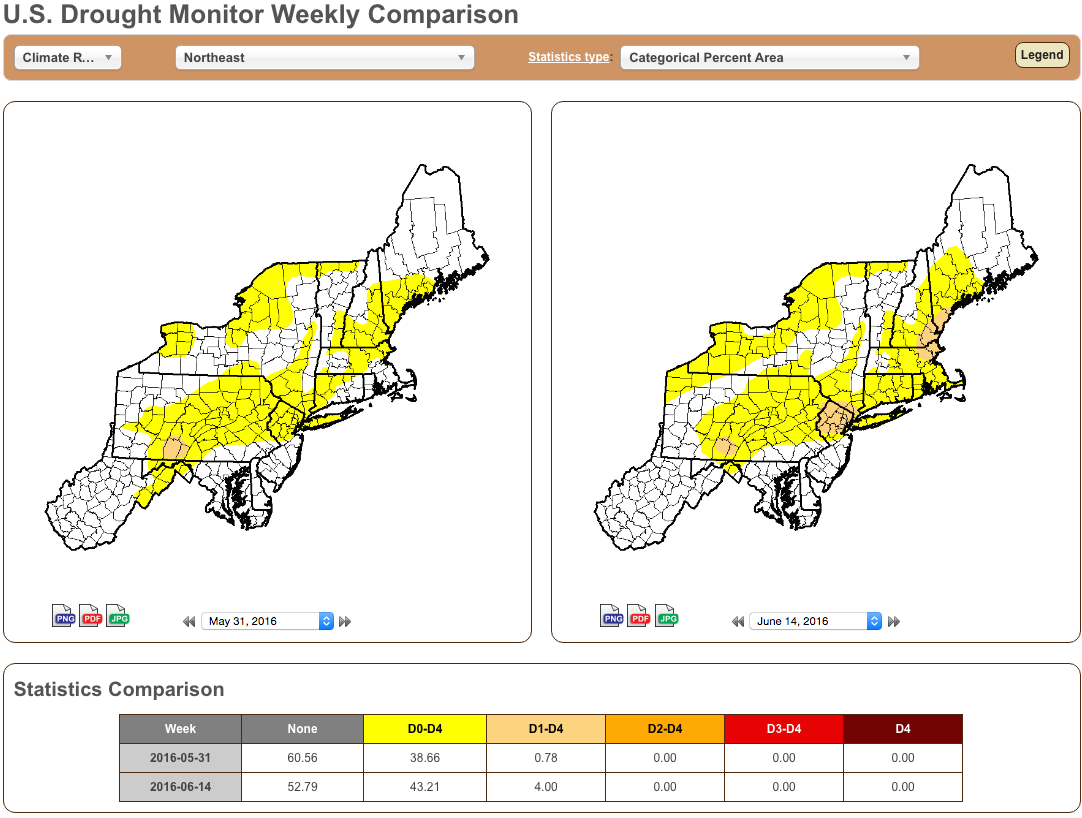
U.S. Drought Monitor maps from late May/early June (left) and mid-June (right) show the expansion of dry conditions in the region. Areas shaded yellow are abnormally dry, while areas shaded tan are experiencing moderate drought conditions. Click to enlarge.