Changing Seasons
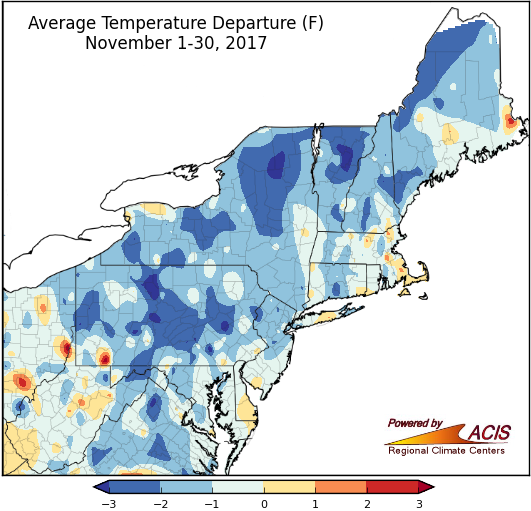
Average temperatures for November ranged from 3°F below normal to normal for a majority of the Northeast.
November wrapped up on the cold side of normal, with average temperatures ranging from 3°F below normal to normal for a majority of the Northeast. A few cooler spots in northern New York, northern Vermont, and northern Pennsylvania were more than 3°F colder than normal, while a few warmer spots scattered throughout the region were up to 1°F warmer than normal. November average temperatures at the major climate sites ranged from 2.6°F below normal in Syracuse, NY, to 0.9°F above normal in Elkins and Beckley, WV. Twenty-six sites were colder than normal in November, with Kennedy Airport, NY, having its 20th coldest November on record.
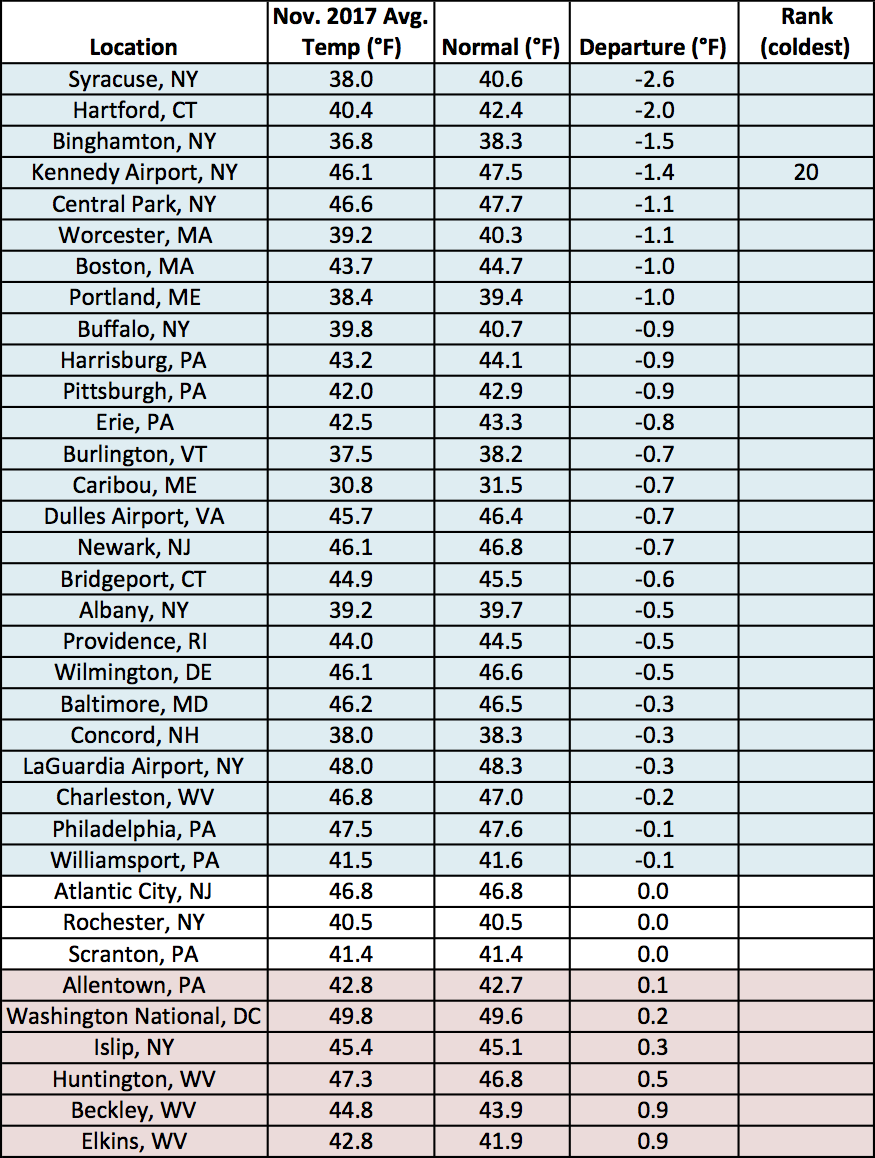
November average temperatures at the major climate sites ranged from 2.6°F below normal in Syracuse, NY, to 0.9°F above normal in Elkins and Beckley, WV.
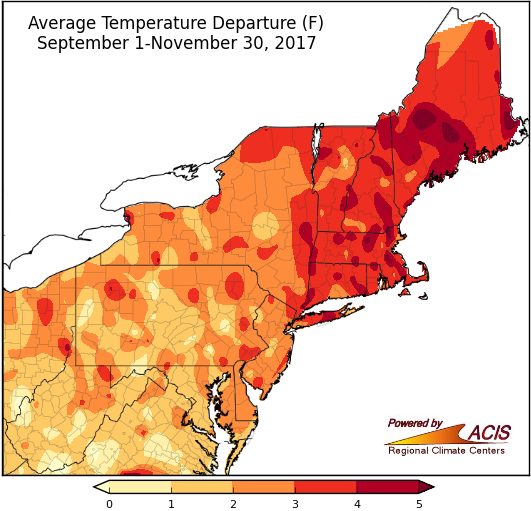
Fall average temperatures ranged from normal to more than 5°F above normal.
With a mild September and record to near-record hot October, the fall season averaged out to be warmer than normal despite the cool November. Average temperatures ranged from normal to more than 5°F above normal, with the greatest departures in New England. Average temperatures for the major climate sites ranged from 1.3°F above normal in Huntington, WV, to 5.0°F above normal in Burlington, VT. Four sites had a record warm fall - Burlington, VT; Concord, NH; Islip, NY; and Providence, RI. For another 27 of the sites, this fall ranked among their 20 warmest on record.
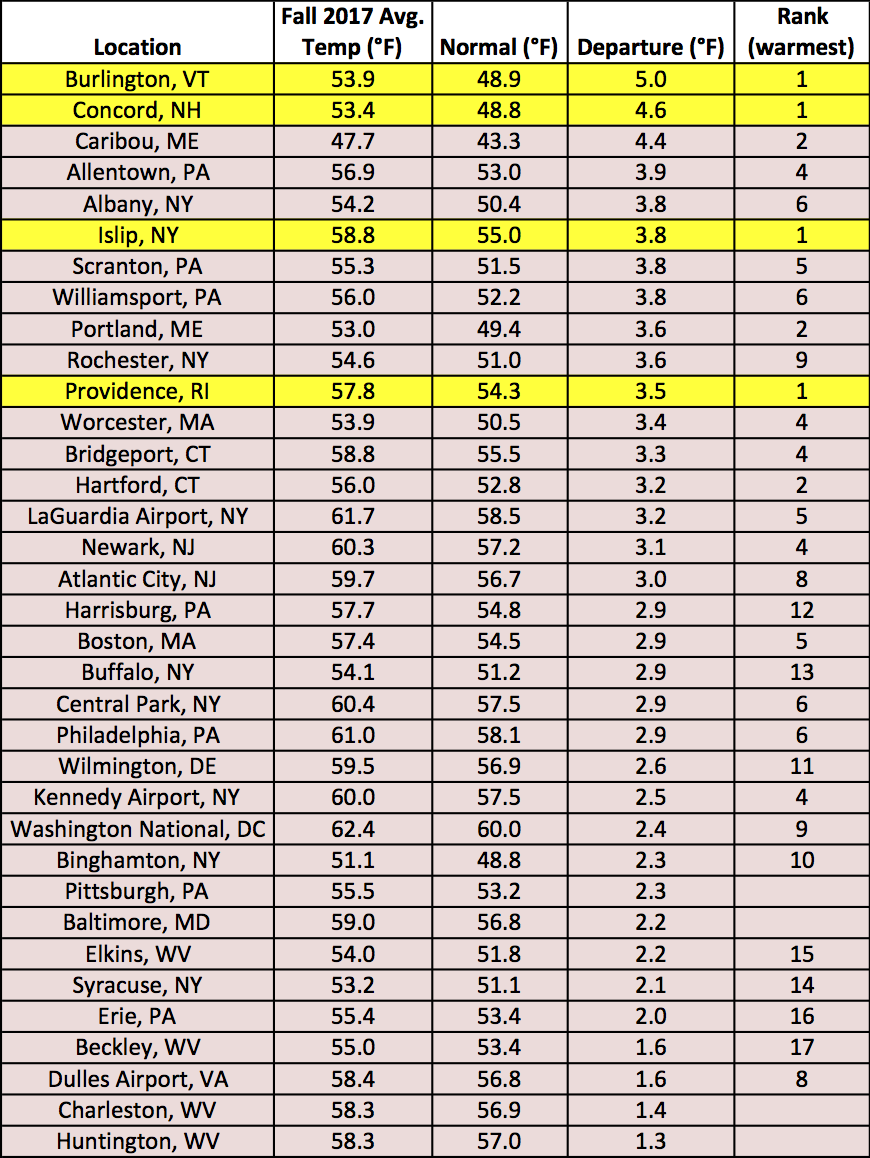
Four major climate sites had their warmest fall season on record. Average temperatures for the 35 sites ranged from 1.3°F above normal in Huntington, WV, to 5.0°F above normal in Burlington, VT.
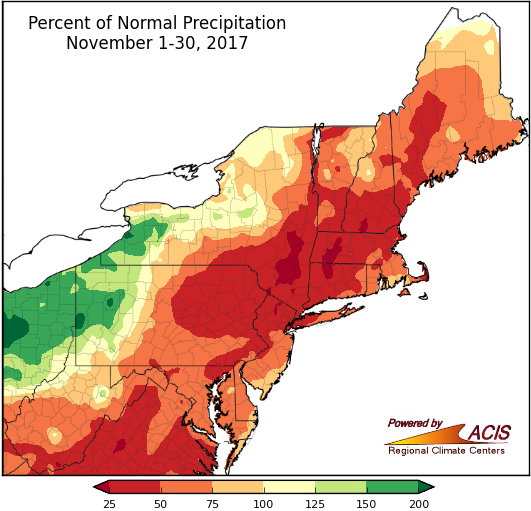
For a majority of the Northeast, November precipitation ranged from 25% of normal to normal.
November precipitation ranged from less than 25% of normal in southeastern New York and parts of New England to more than 200% of normal in western Pennsylvania and western New York. For a majority of the Northeast, though, precipitation ranged from 25% of normal to normal. At the major climate sites, November precipitation ranged from 27% of normal in Hartford, CT, and Albany, NY, to 165% of normal in Erie, PA. Twenty-nine sites received below-normal precipitation, with 16 of those sites ranking this November among their 20 driest. Of the six wetter-than-normal sites, four ranked this November among their 20 wettest.
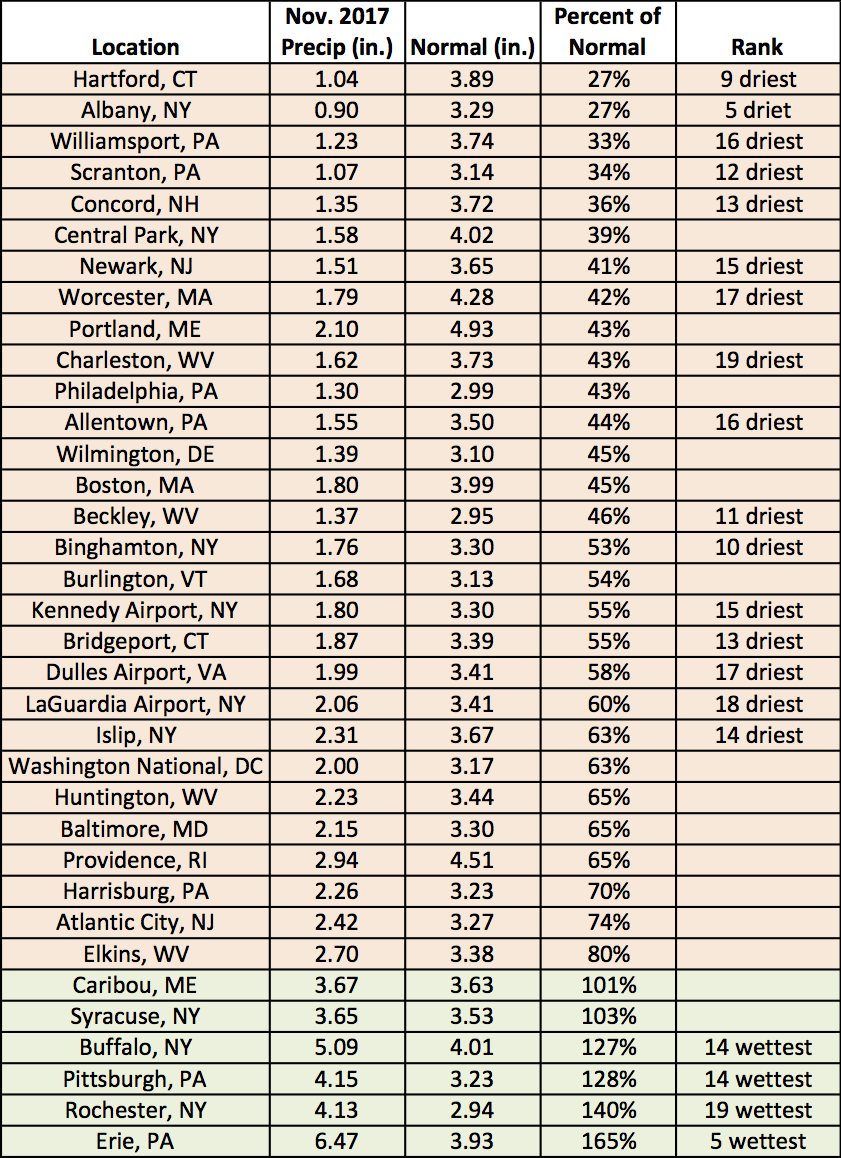
At the major climate sites, November precipitation ranged from 27% of normal in Hartford, CT, and Albany, NY, to 165% of normal in Erie, PA.
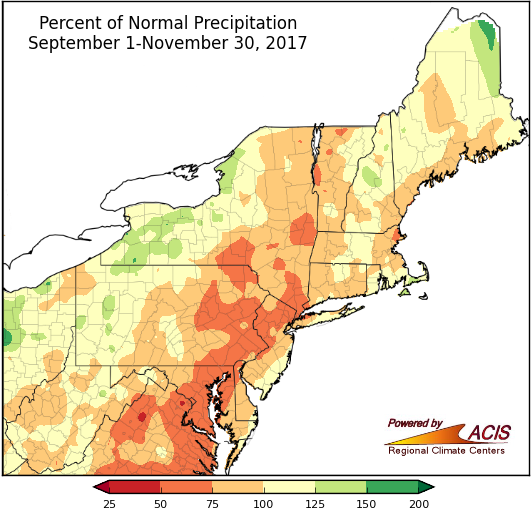
Precipitation during the fall season ranged from 50% of normal to 150% of normal.
Precipitation during each month of fall varied. September was drier than normal. October started dry, but two late-month rainstorms caused most areas to be wetter than normal for the month. In November, much of the region was dry but there were some areas that were quite wet. Overall, precipitation during the fall season ranged from 50% of normal to 150% of normal. Fall precipitation at the 35 major climate sites ranged from 53% of normal at Washington National, DC, to 134% of normal in Rochester, NY. Twenty-three sites were drier than normal for fall, with seven ranking this fall among their 20 driest. Of the 12 wetter-than-normal sites, four ranked this fall among their 20 wettest.
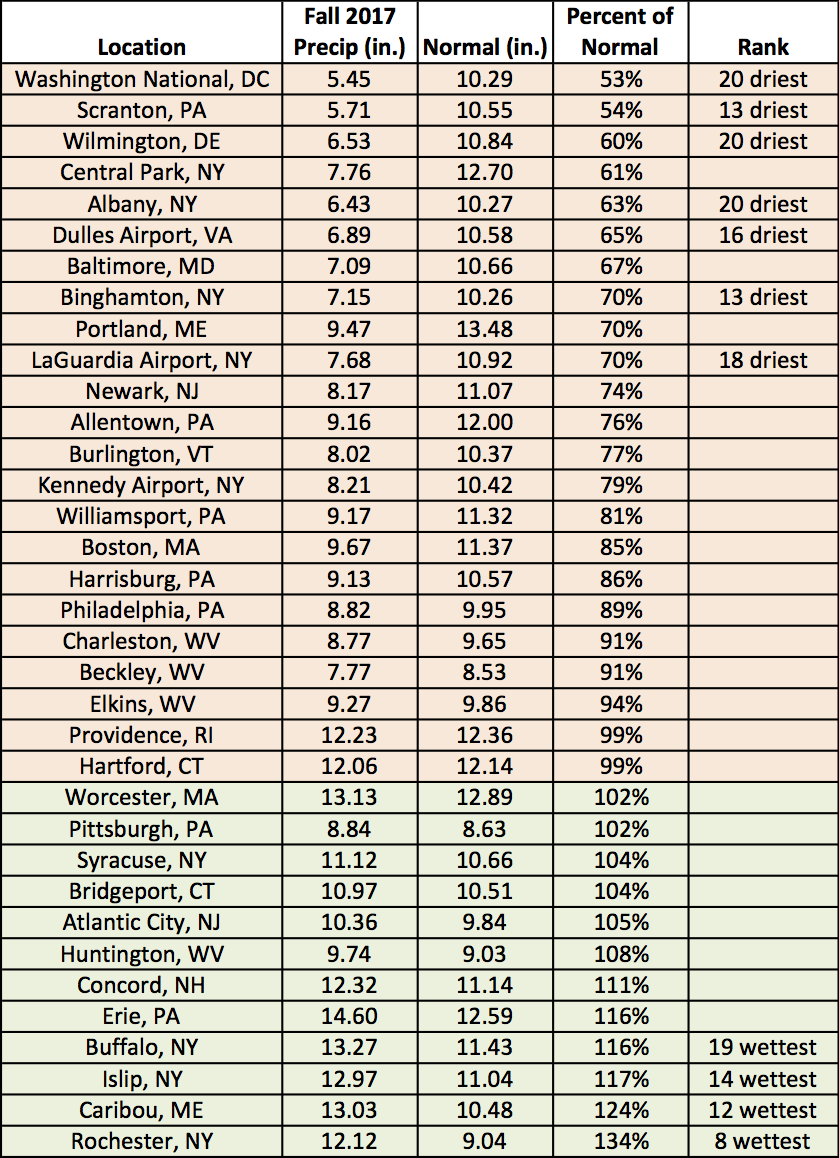
Fall precipitation at the 35 major climate sites ranged from 53% of normal at Washington National, DC, to 134% of normal in Rochester, NY.
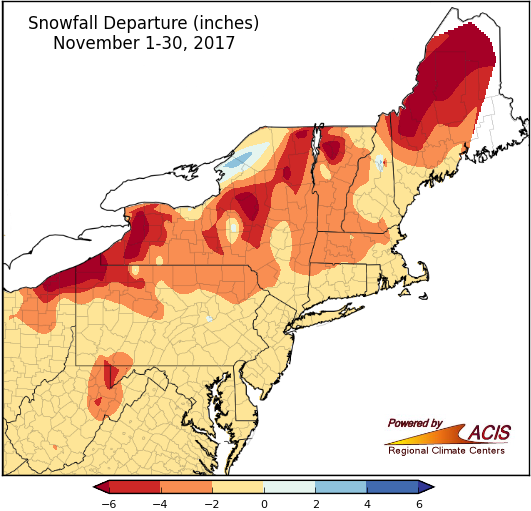
For almost the entire region, November snowfall ranged from more than 6 inches below normal to normal.
The Northeast received little, if any, snowfall during November. For almost the entire region, November snowfall ranged from more than 6 inches below normal to normal. The largest deficits were in lake-effect prone areas of northwestern Pennsylvania and western/central New York, as well as higher elevations of northern New York and northern New England. The main exception was an area northeast of Lake Ontario, which saw a surplus of up to 4 inches. November snowfall at the major climate sites ranged from 8 inches below normal in Erie, PA, to 0.2 inches below normal in Atlantic City, NJ, and Kennedy Airport, NY. All 35 climate sites average measurable snow (0.1 inches) in November, but this year only 11 sites received it. And of those 11 sites, five ranked this November among their 20 least snowy Novembers on record.
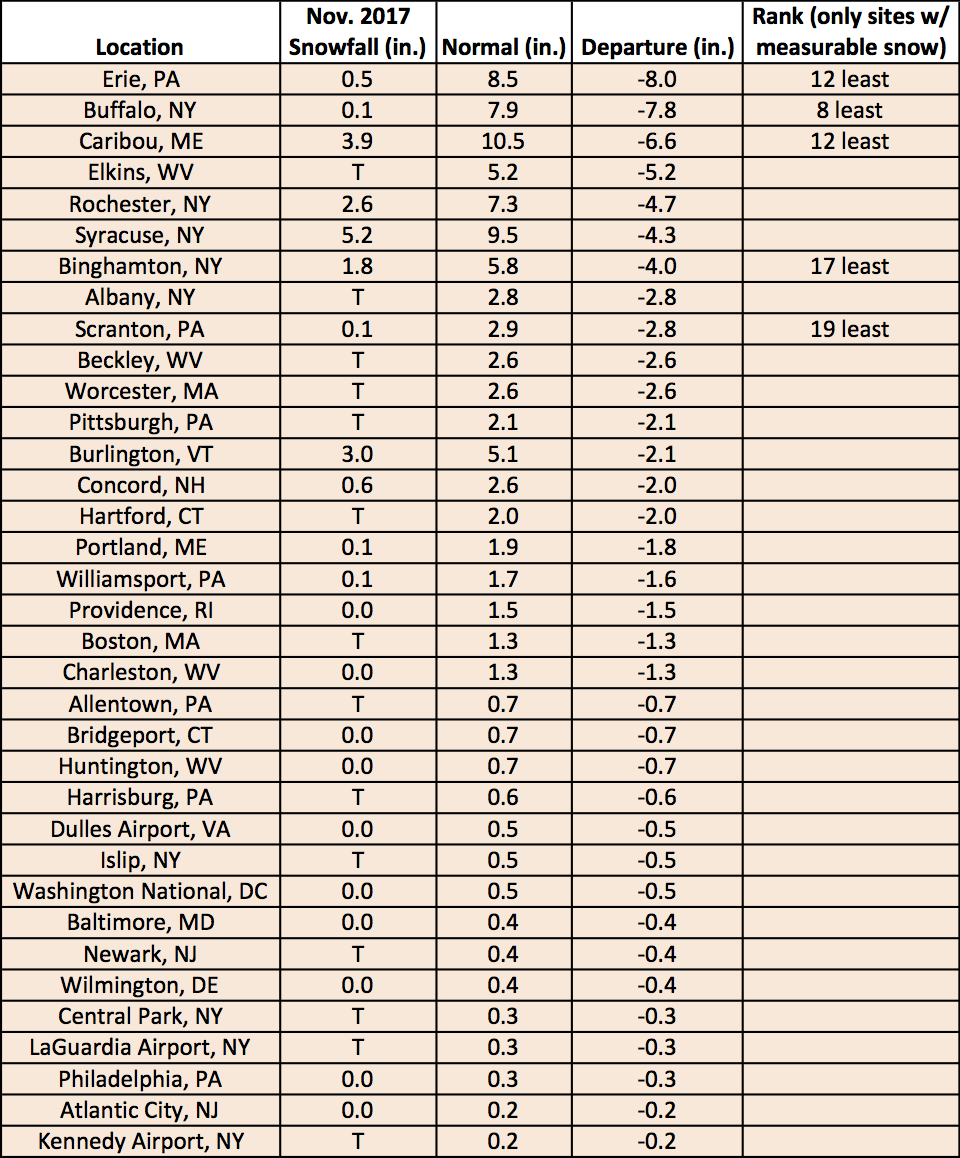
November snowfall at the major climate sites ranged from 8 inches below normal in Erie, PA, to 0.2 inches below normal in Atlantic City, NJ, and Kennedy Airport, NY.
The cooler-than-normal conditions of November are expected to continue into December. NOAA’s Climate Prediction Center (CPC)'s December temperature outlook indicates increased chances of below-normal temperatures for the entire Northeast, with the greatest chance in parts of West Virginia and southwestern Pennsylvania. However, CPC’s winter (December through February) temperature outlook indicates an increased chance of above-normal temperatures for the Northeast. This means that while there can still be cold air outbreaks and even a cold month or two, overall there’s a tilt towards the season averaging out to be warmer than normal.
CPC’s temperature outlook for December indicates increased chances of below-normal temperatures for the Northeast.
CPC’s temperature outlook for winter indicates increased chances of above-normal temperatures for the Northeast.
CPC is calling for equal chances of below-, near-, or above-normal December precipitation for the region. And for winter, CPC’s forecast indicates an increased chance of below-normal precipitation for southeastern Maryland and increased chances of above-normal precipitation for an area from West Virginia through Pennsylvania and New York into northern New England. Equal chances were forecast elsewhere. For more information on winter climate patterns and the outlooks, check out the Northeast Winter Climate Patterns and Outlook document.
The December precipitation outlook from CPC indicates there are equal chances of below, near, or above-normal precipitation for the entire region.
The winter precipitation outlook from CPC indicates there is an increased chance of above-normal precipitation for an area from West Virginia through Pennsylvania and New York into northern New England.