Chillin’ in Mid-August
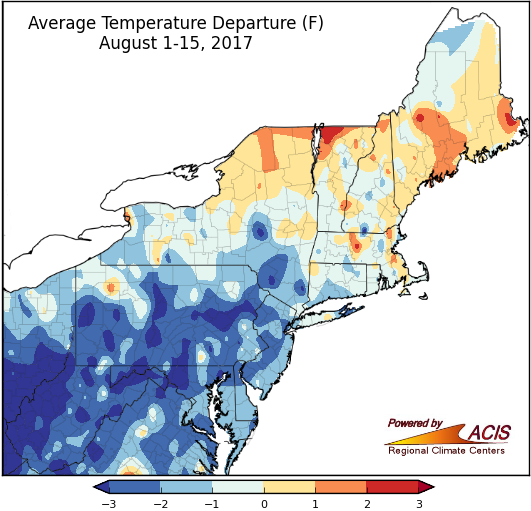
August 1-15 average temperatures ranged from more than 3°F below normal to 3°F above normal.
The Northeast has generally been colder than normal during the first half of August, with average temperatures in many areas ranging from more than 3°F below normal to normal. The coldest areas tended to be in southern portions of the region. However, some parts of northern New York, Massachusetts, and northern New England have seen average temperatures ranging from normal to 3°F above normal. The warmest area was northwestern Vermont. Thirty of the region’s 35 major climate sites were colder than normal, with six sites ranking this first half of August among their top 20 coldest.
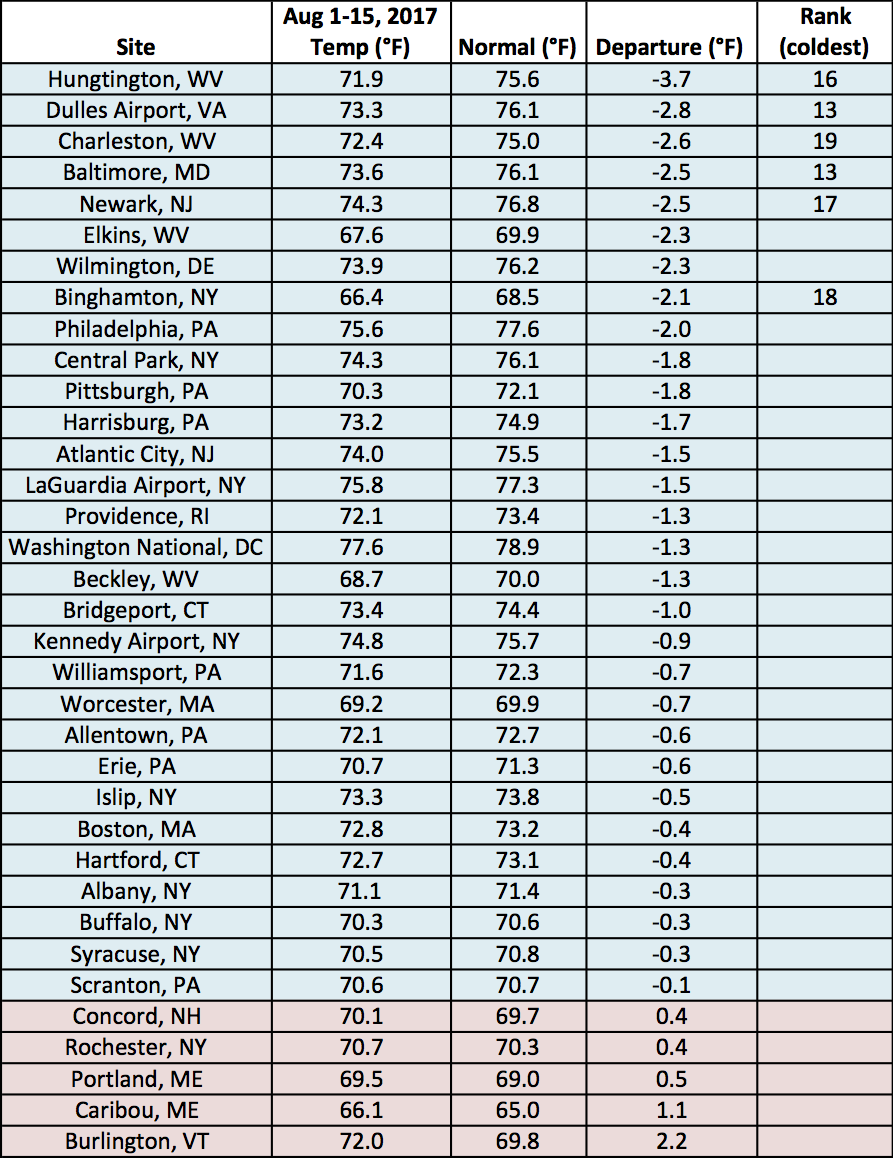
August 1-15 average temperatures at the major climate sites ranged from 3.7°F below normal in Huntington, WV, to 2.2°F above normal in Burlington, VT.
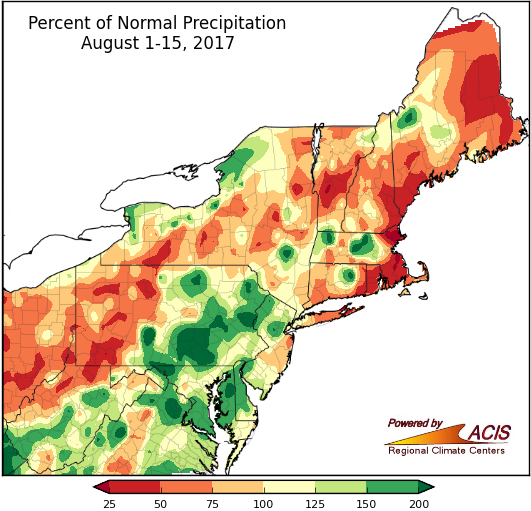
August 1-15 precipitation ranged from less than 25% of normal to more than 200% of normal.
Just like the previous two summer months, August so far has featured variable precipitation. Northeast Massachusetts has seen less than 25% of normal precipitation, and dry conditions led to the introduction of moderate drought in Maine. On the other hand, several areas, including south-central Pennsylvania, have seen more than 200% of normal, and heavy rain caused flash flooding in multiple locations. Nine of the 35 major climate sites were drier than normal during the first two weeks of August, with Islip, NY, having it’s 16th driest start to the month. Of the 16 wetter-than-normal sites, five ranked this first half of August among their top 20 wettest.
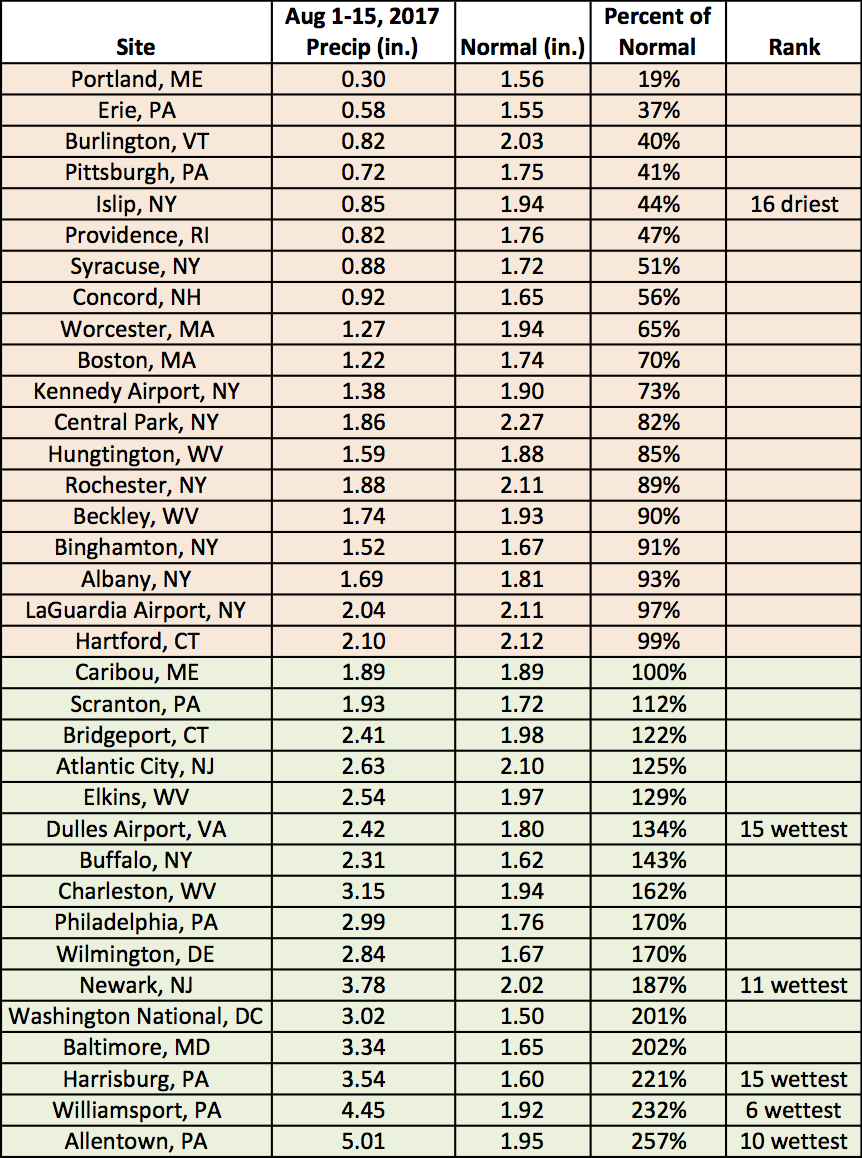
August 1-15 precipitation ranged from 19% of normal in Portland, ME, to 257% of normal in Allentown, PA.