Summer Scorcher
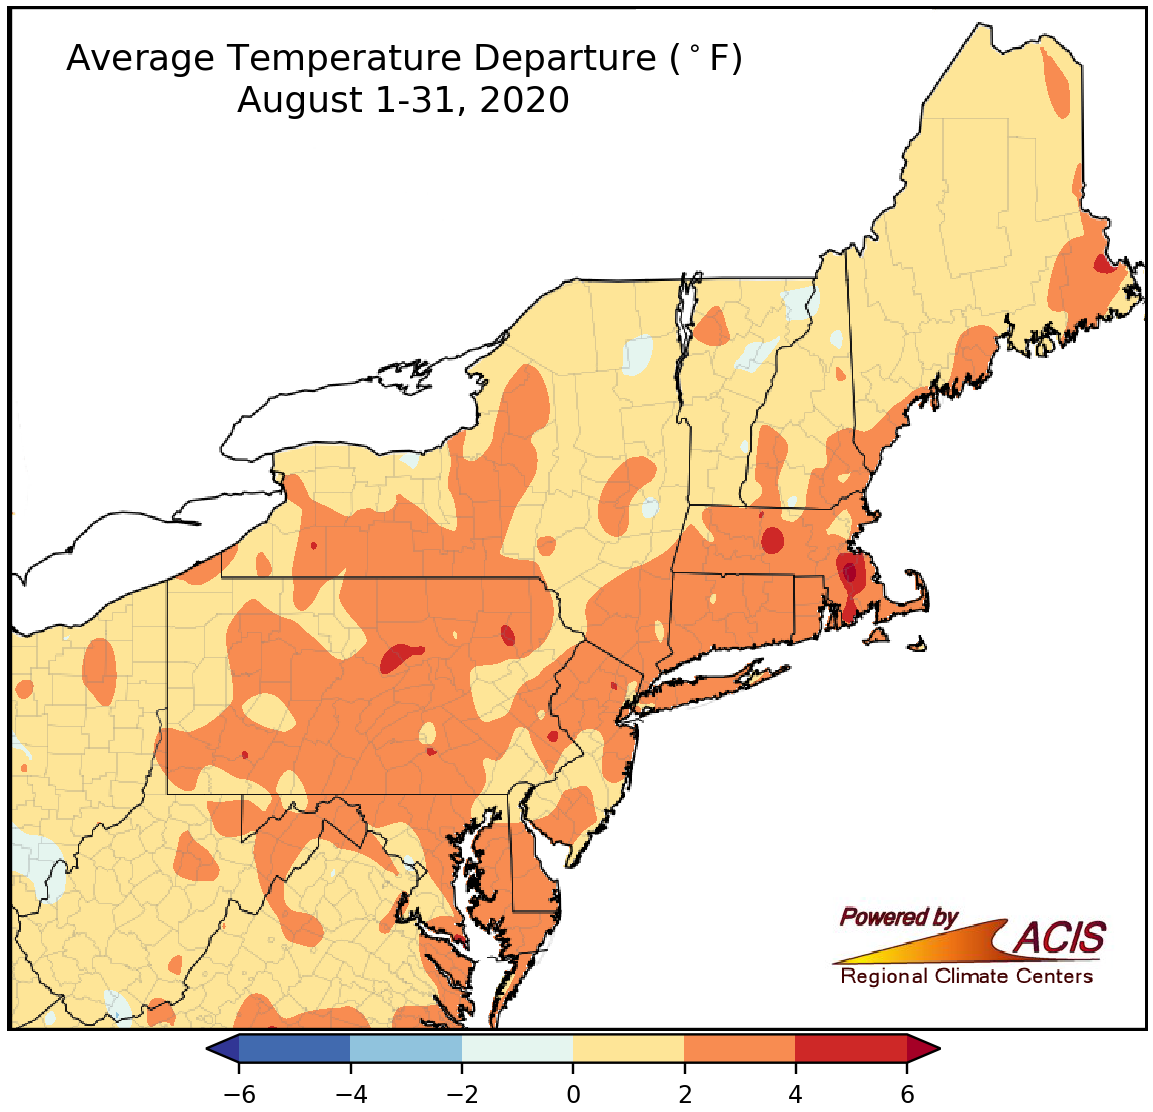
August average temperatures ranged from near normal to 6°F above normal.
August was another warmer-than-normal month in the Northeast, with average temperatures as much as 6°F above normal. Twenty-seven major climate sites ranked this August among their 20 warmest on record. Portland, ME, recorded six days with a high of at least 90°F this August, tying its August record.
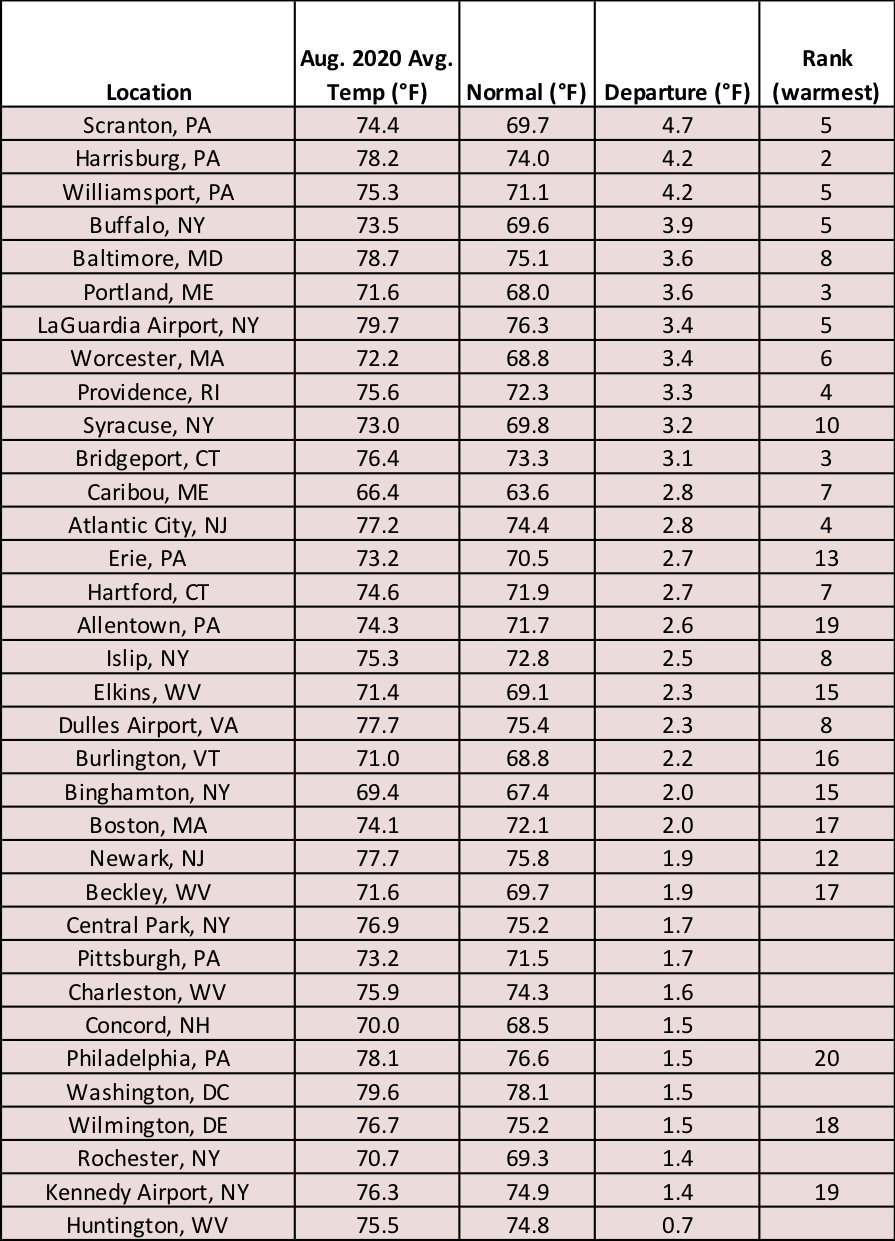
This August was among the 10 warmest on record for 16 major climate sites.
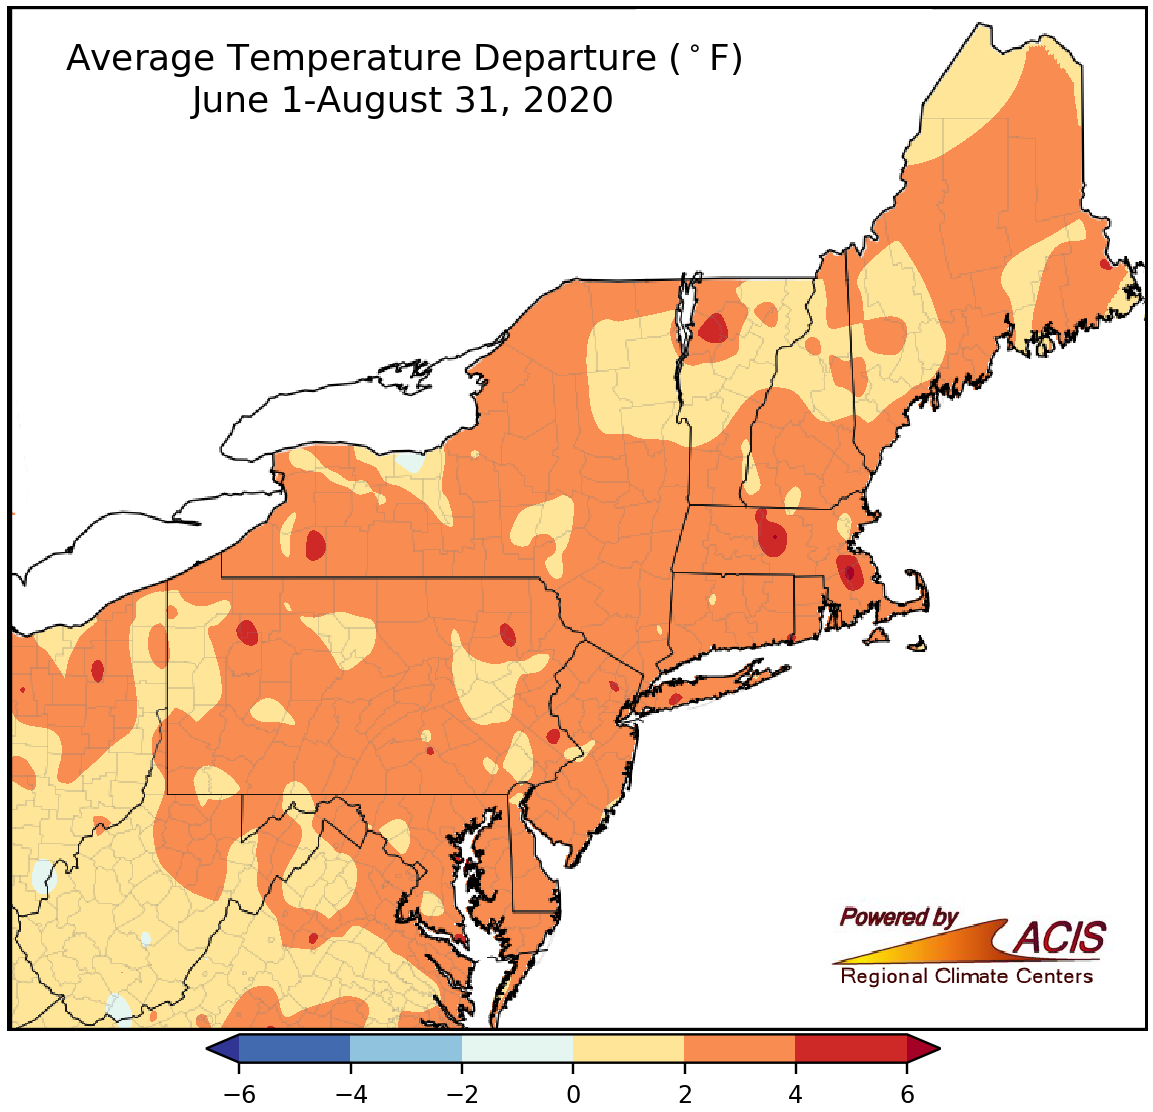
Summer average temperatures were up to 6°F warmer than normal.
With a mild June, an exceptionally hot July, and a warm August, summer 2020 went into the record books as the hottest summer on record for nine major climate sites and ranked among the 10 hottest summers on record for another 20 major climate sites. Overall, all 35 major climate sites were hotter than normal by as much as 4.7°F. Hartford, CT, had 39 days this summer with a high of at least 90°F, its greatest number on record for summer.
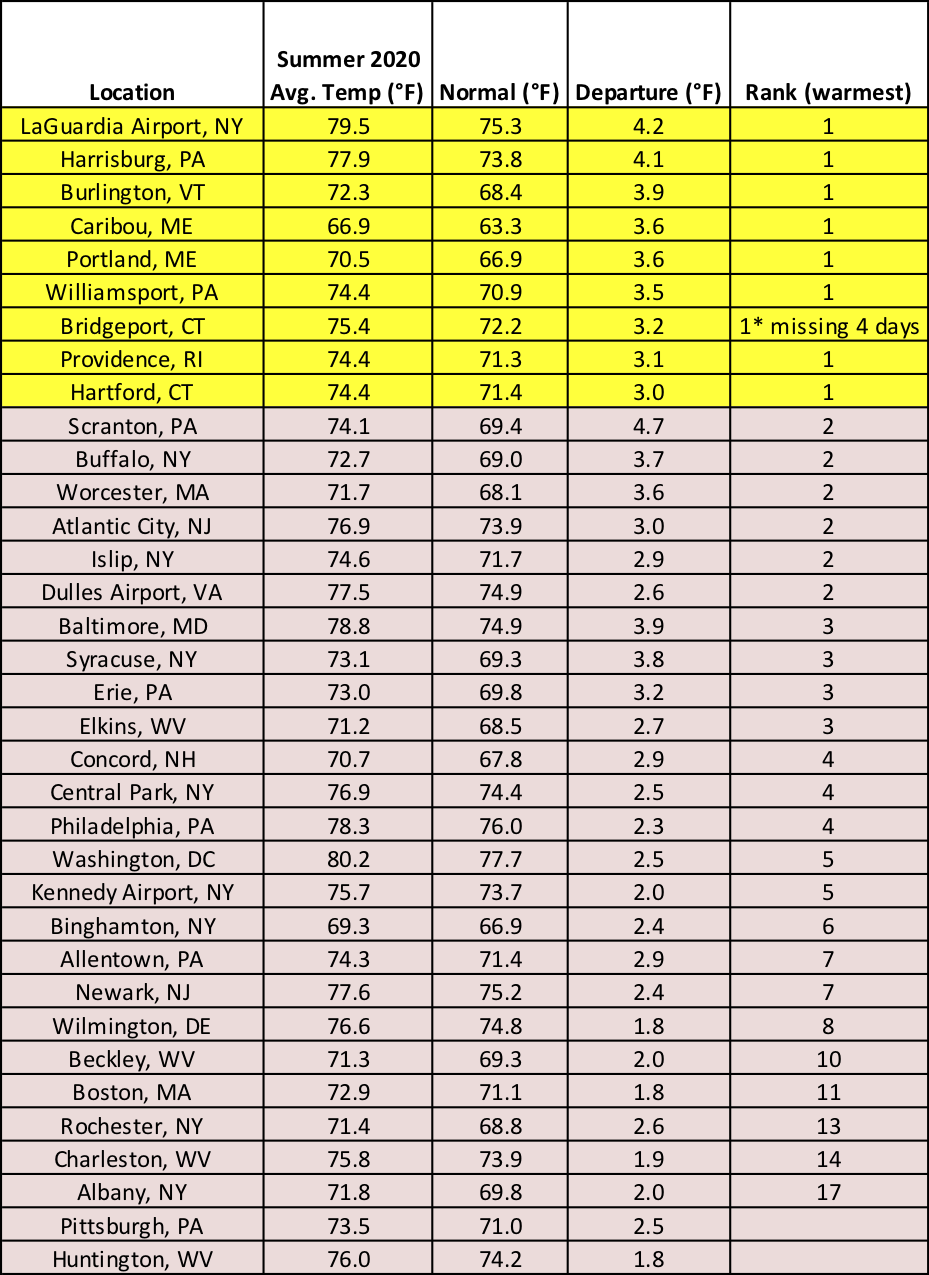
This summer was record hot at nine major climate sites.
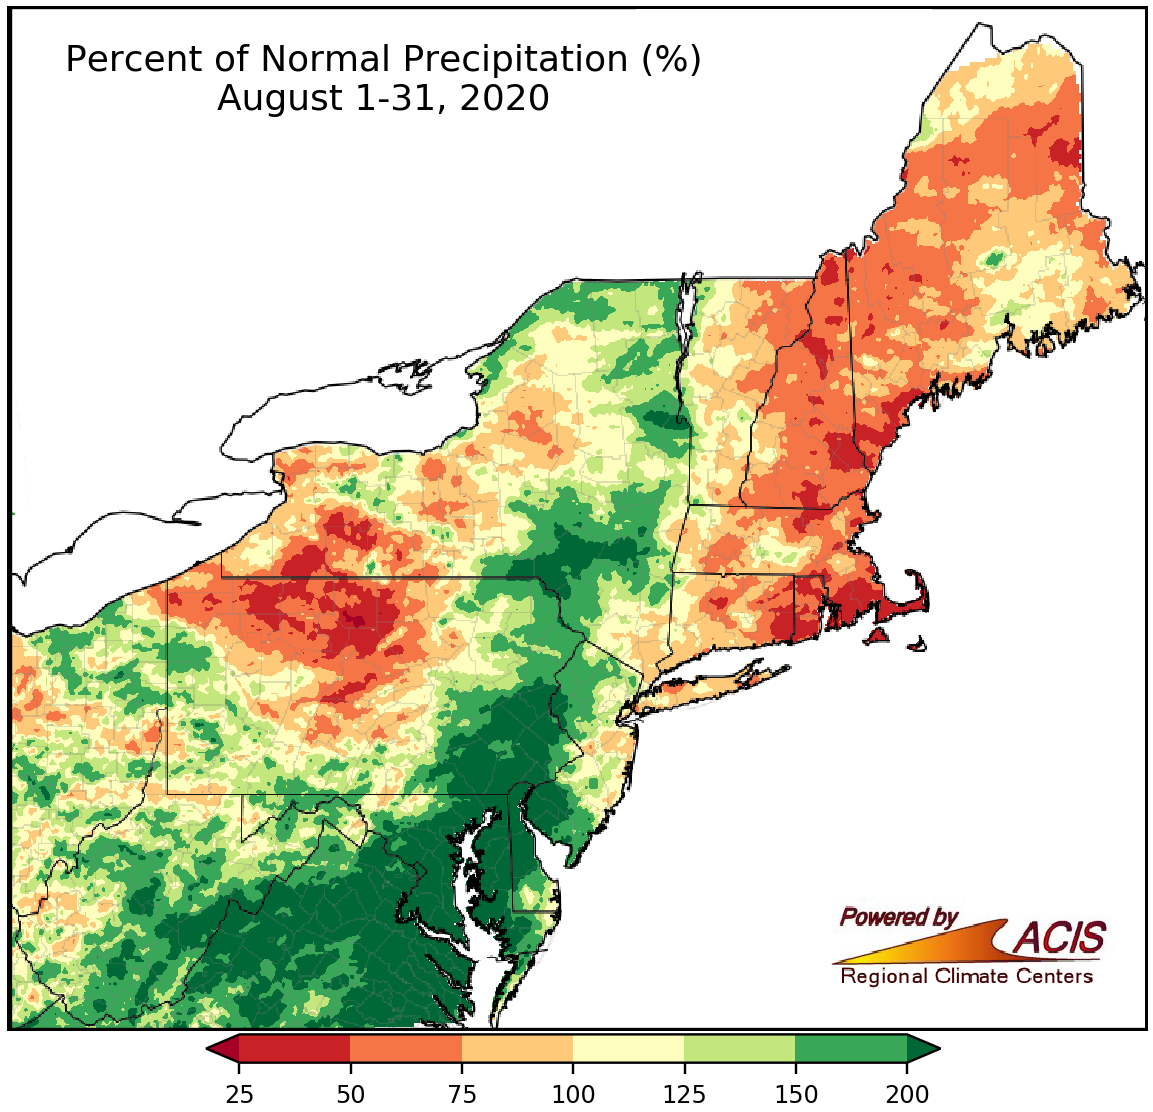
August precipitation ranged from 25% of normal to more than 200% of normal.
Precipitation was variable in August. Two of the 14 drier-than-normal major climate sites ranked this August among their driest on record. The driest locations, which were generally in New England, western New York, and northern Pennsylvania, saw as little as 25% of normal precipitation. During the month, drought and abnormally dry conditions expanded in several of these areas. Thirteen of the 21 wetter-than-normal major climate sites ranked this August among their 20 wettest on record. The wettest locations, which were generally in eastern West Virginia, the Mid-Atlantic, and eastern New York, saw more than 200% of normal precipitation. Several of these areas experienced repeated flash flooding.
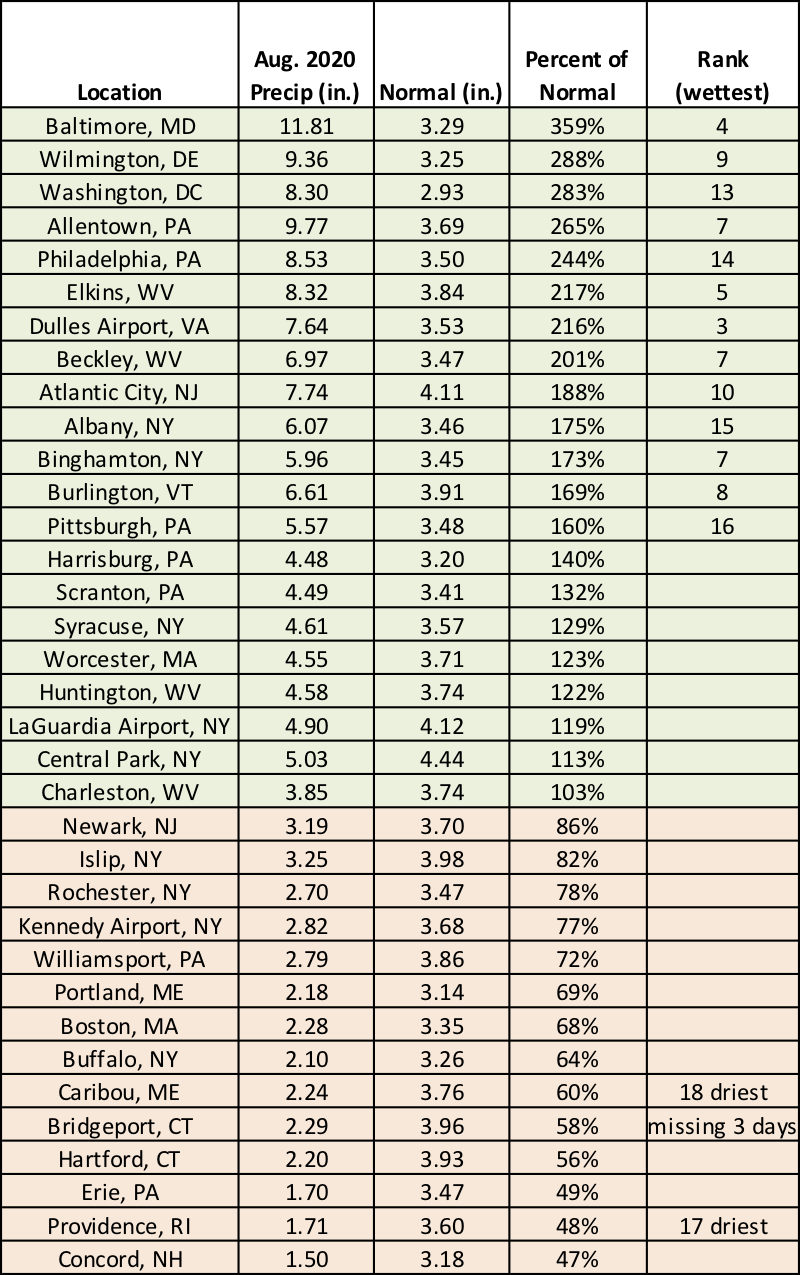
August precipitation ranged from 47% of normal in Concord, NH, to 359% of normal in Baltimore, MD.
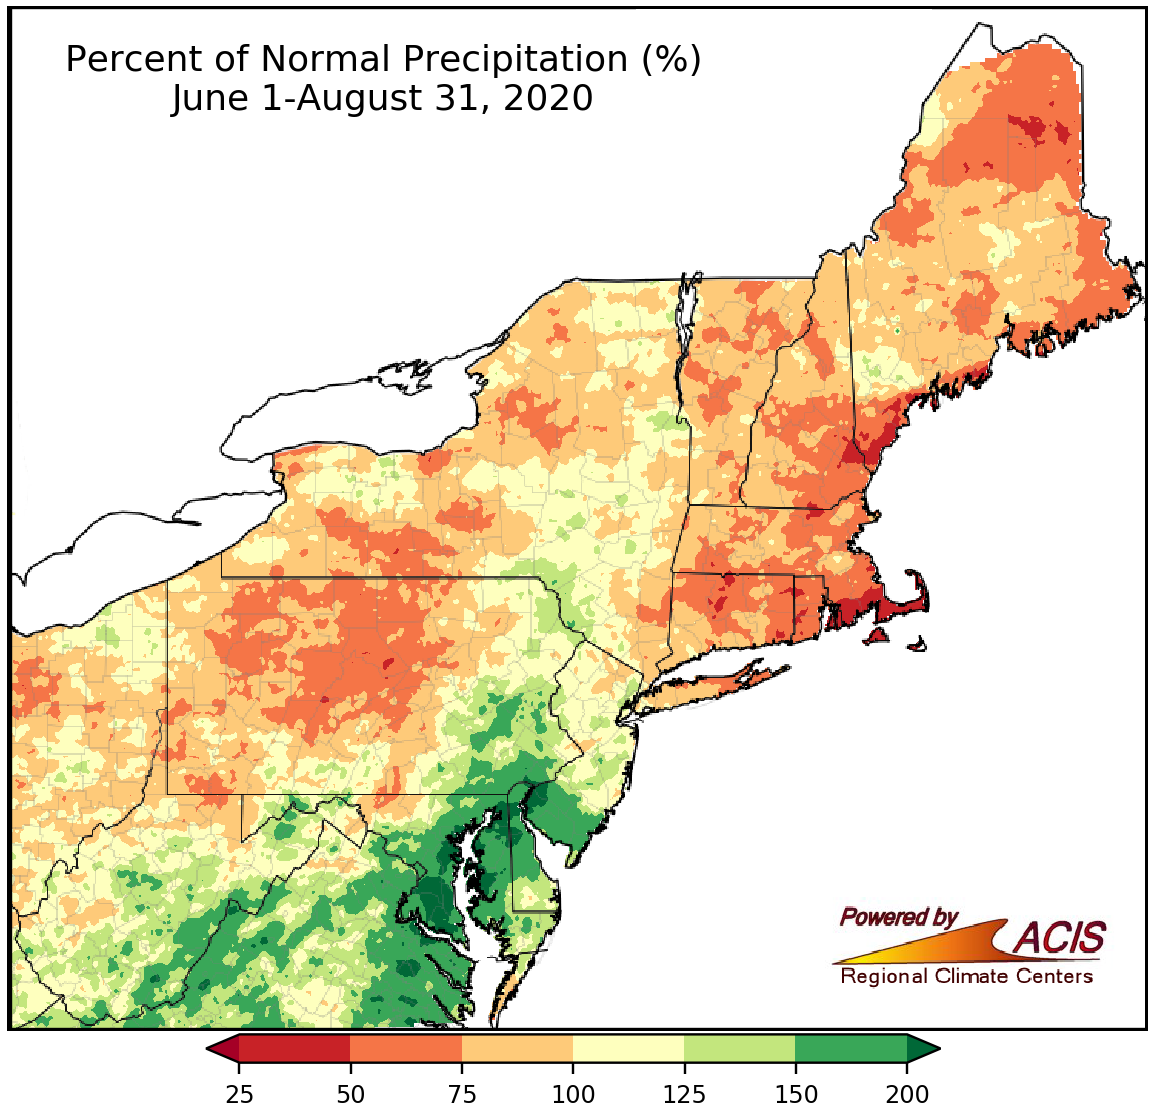
Summer precipitation ranged from 25% of normal to more than 200% of normal.
With a generally dry June and variable precipitation in July and August, summer precipitation ranged from 25% of normal in parts of New England to more than 200% of normal in parts of the Mid-Atlantic. Twenty-two major climate sites were drier than normal, with Hartford, CT, having its driest summer on record and four other sites ranking this summer among their 20 driest. On the flip side, 10 of the 13 wetter-than-normal major climate sites ranked this summer among their 20 wettest on record.
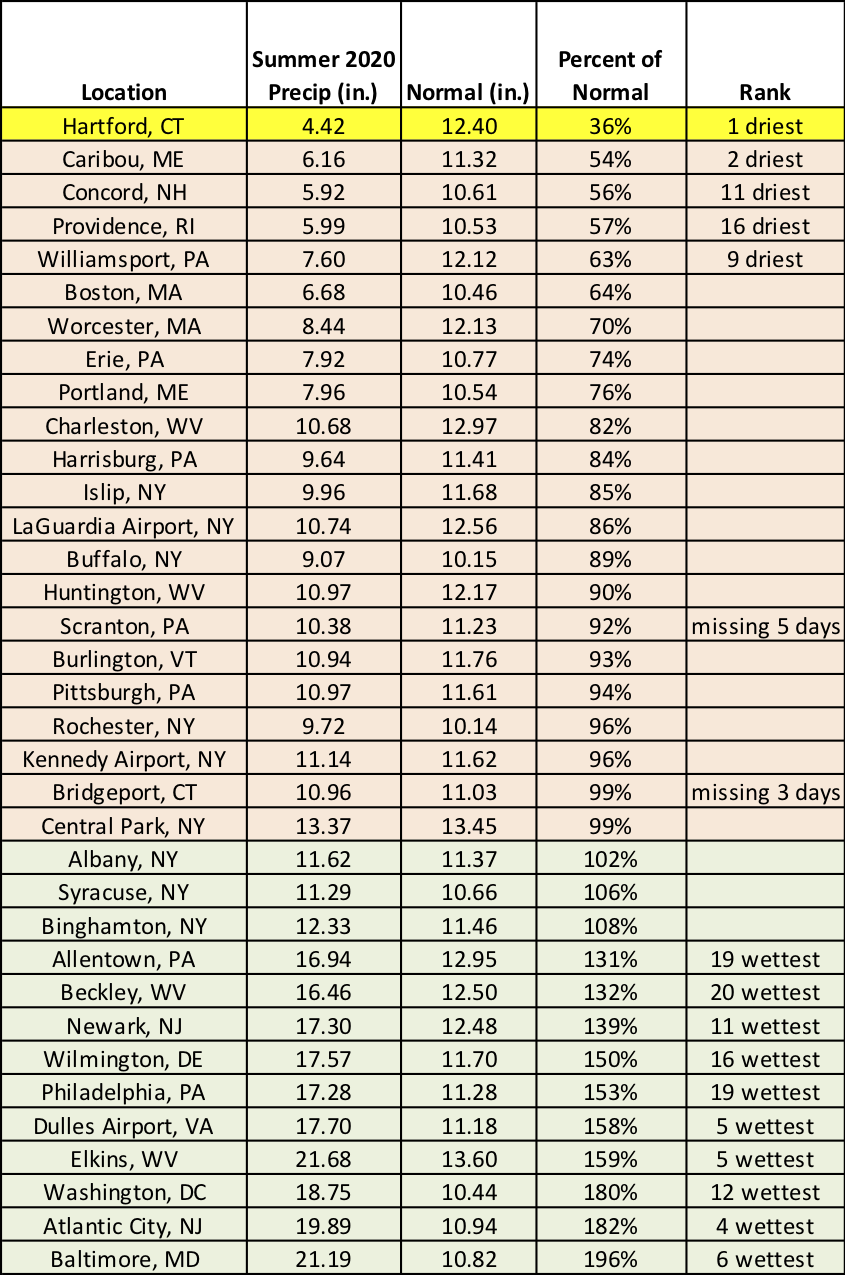
Hartford, CT, had its driest summer on record but several other major climate sites were quite wet.
For September, NOAA’s Climate Prediction Center indicates equal chances of below-, near-, or above-normal temperatures. There’s a slight tilt towards wetter-than-normal conditions for portions of West Virginia and the Mid-Atlantic, with equal chances predicted for the rest of the Northeast.
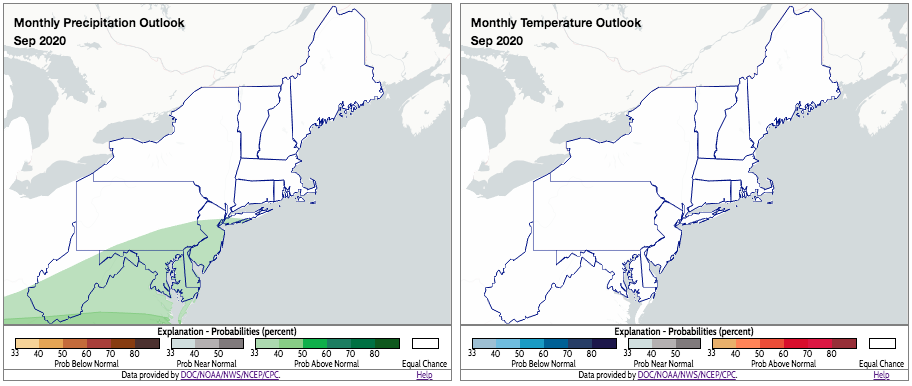
Much of the Northeast falls into the equal chances category for temperature and precipitation for September. Click to enlarge.