White Christmas Over the Generations
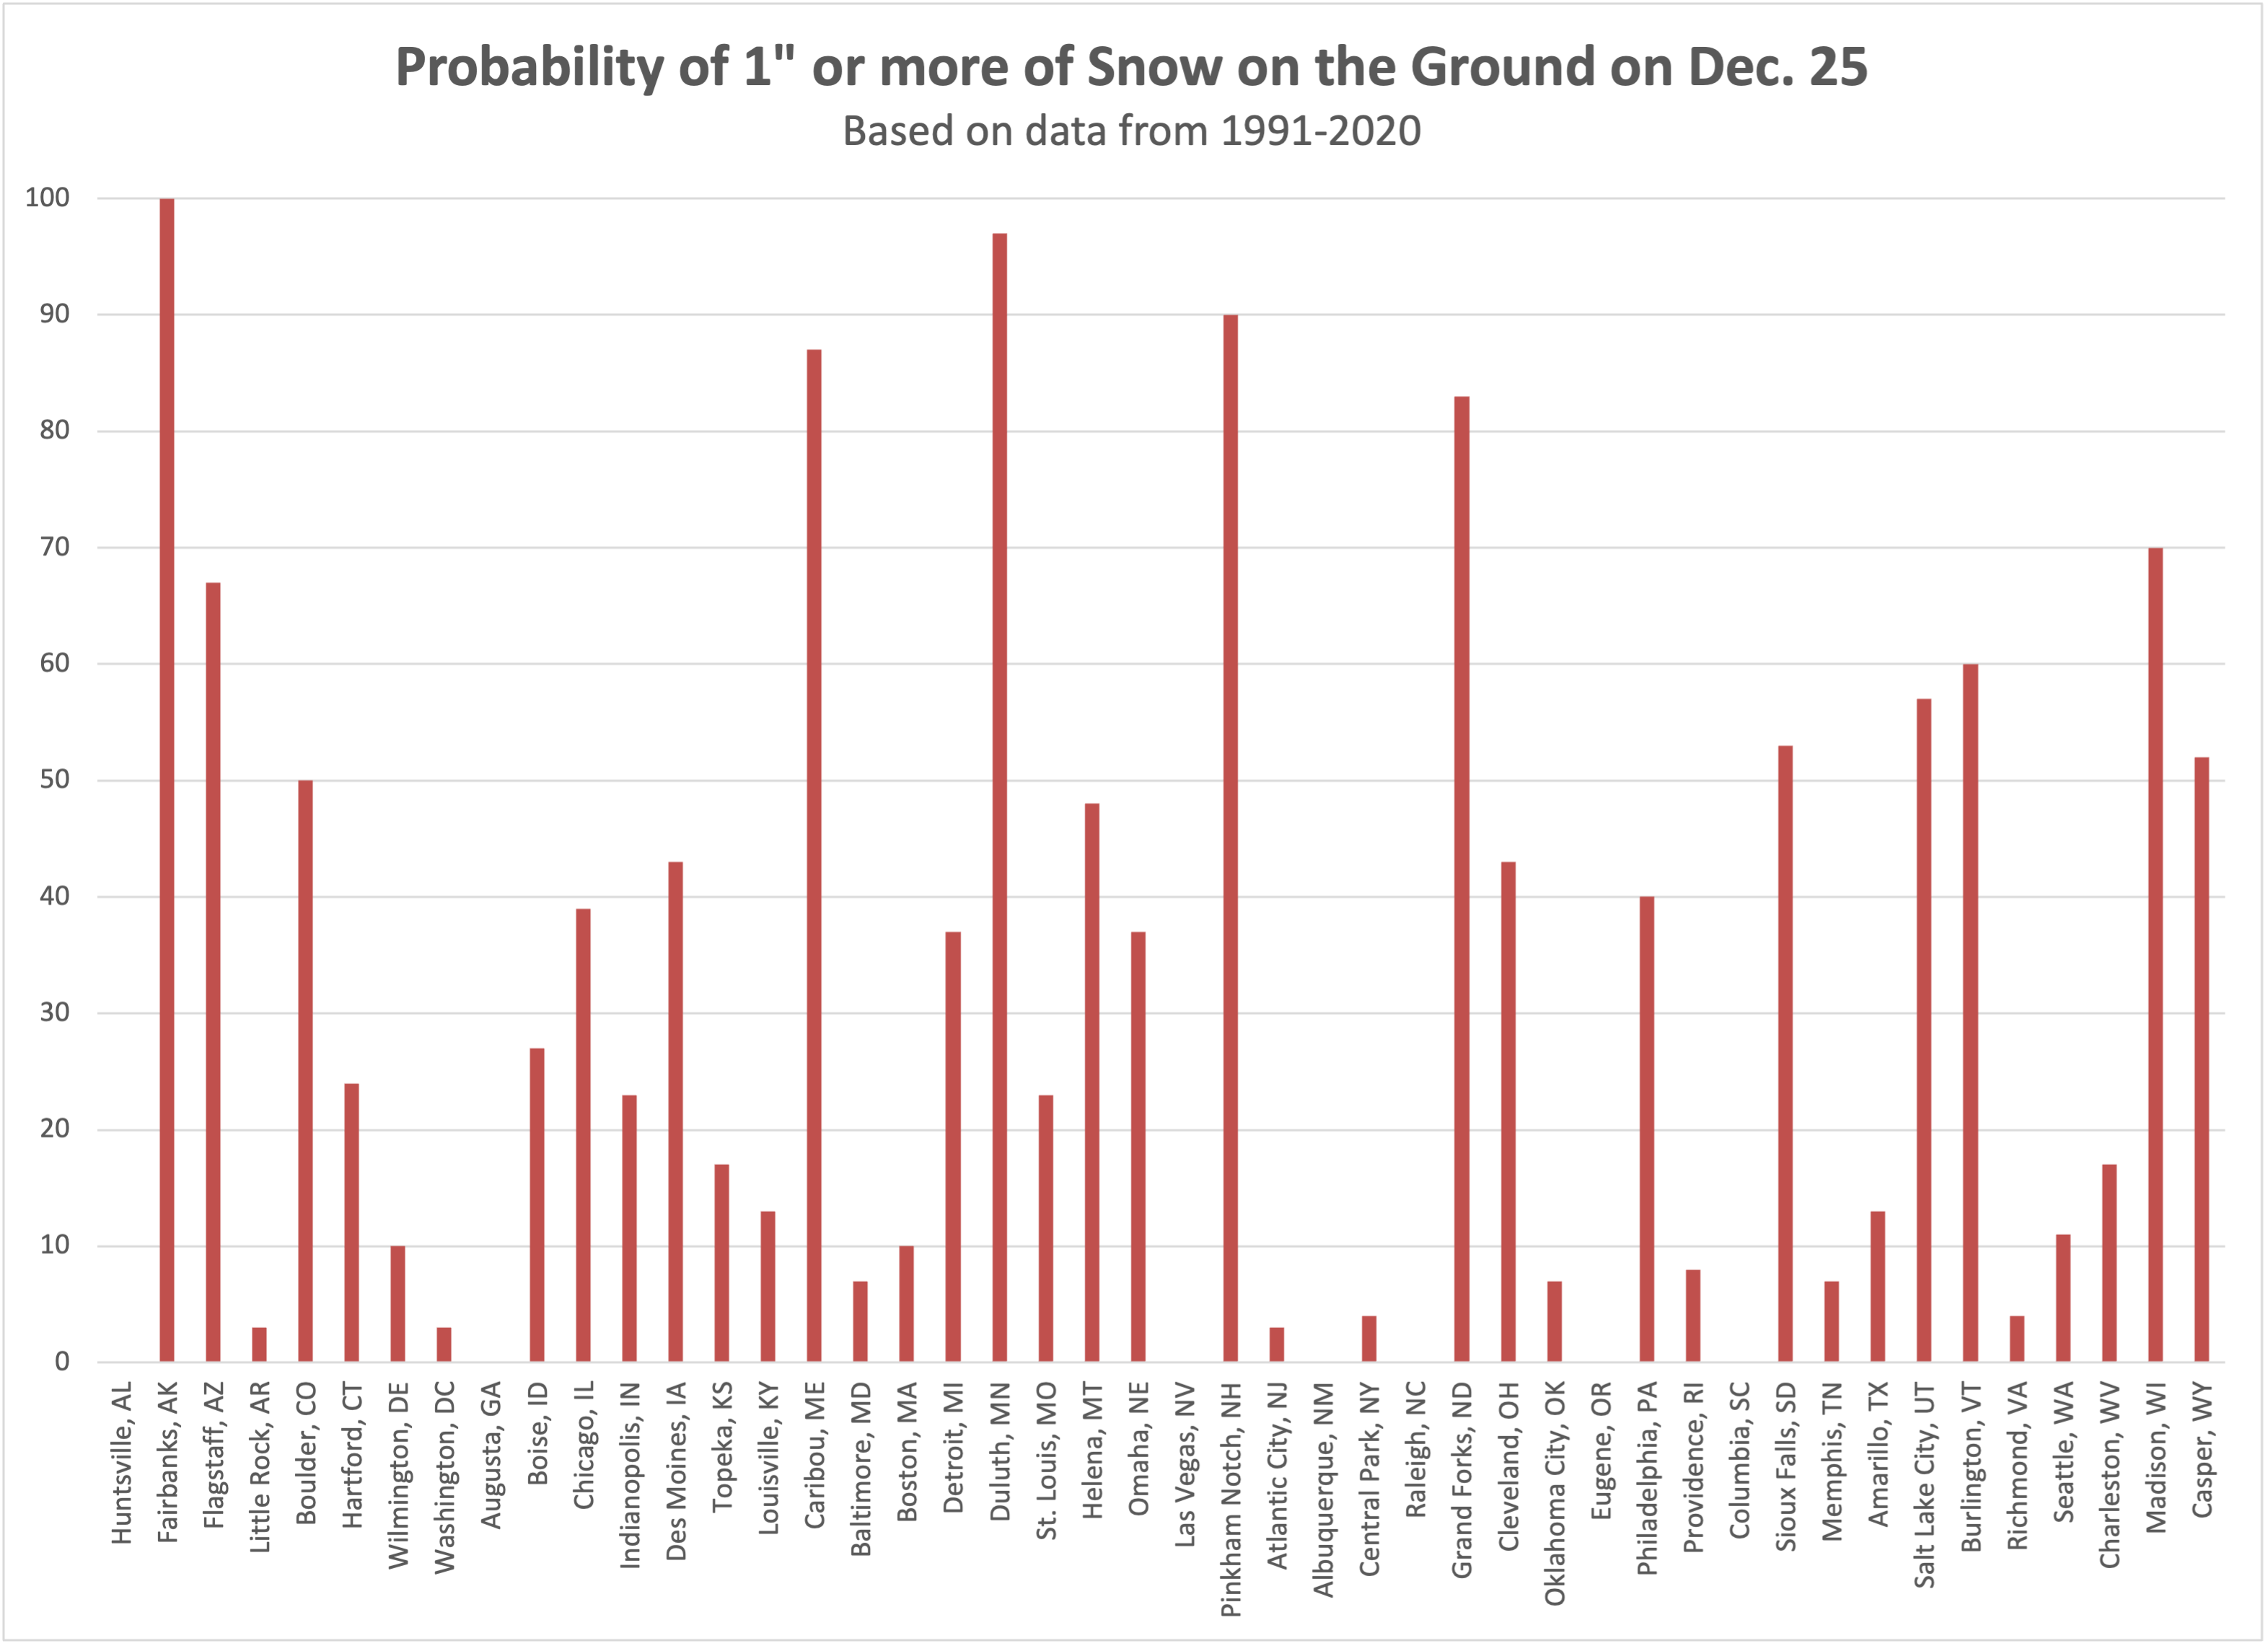
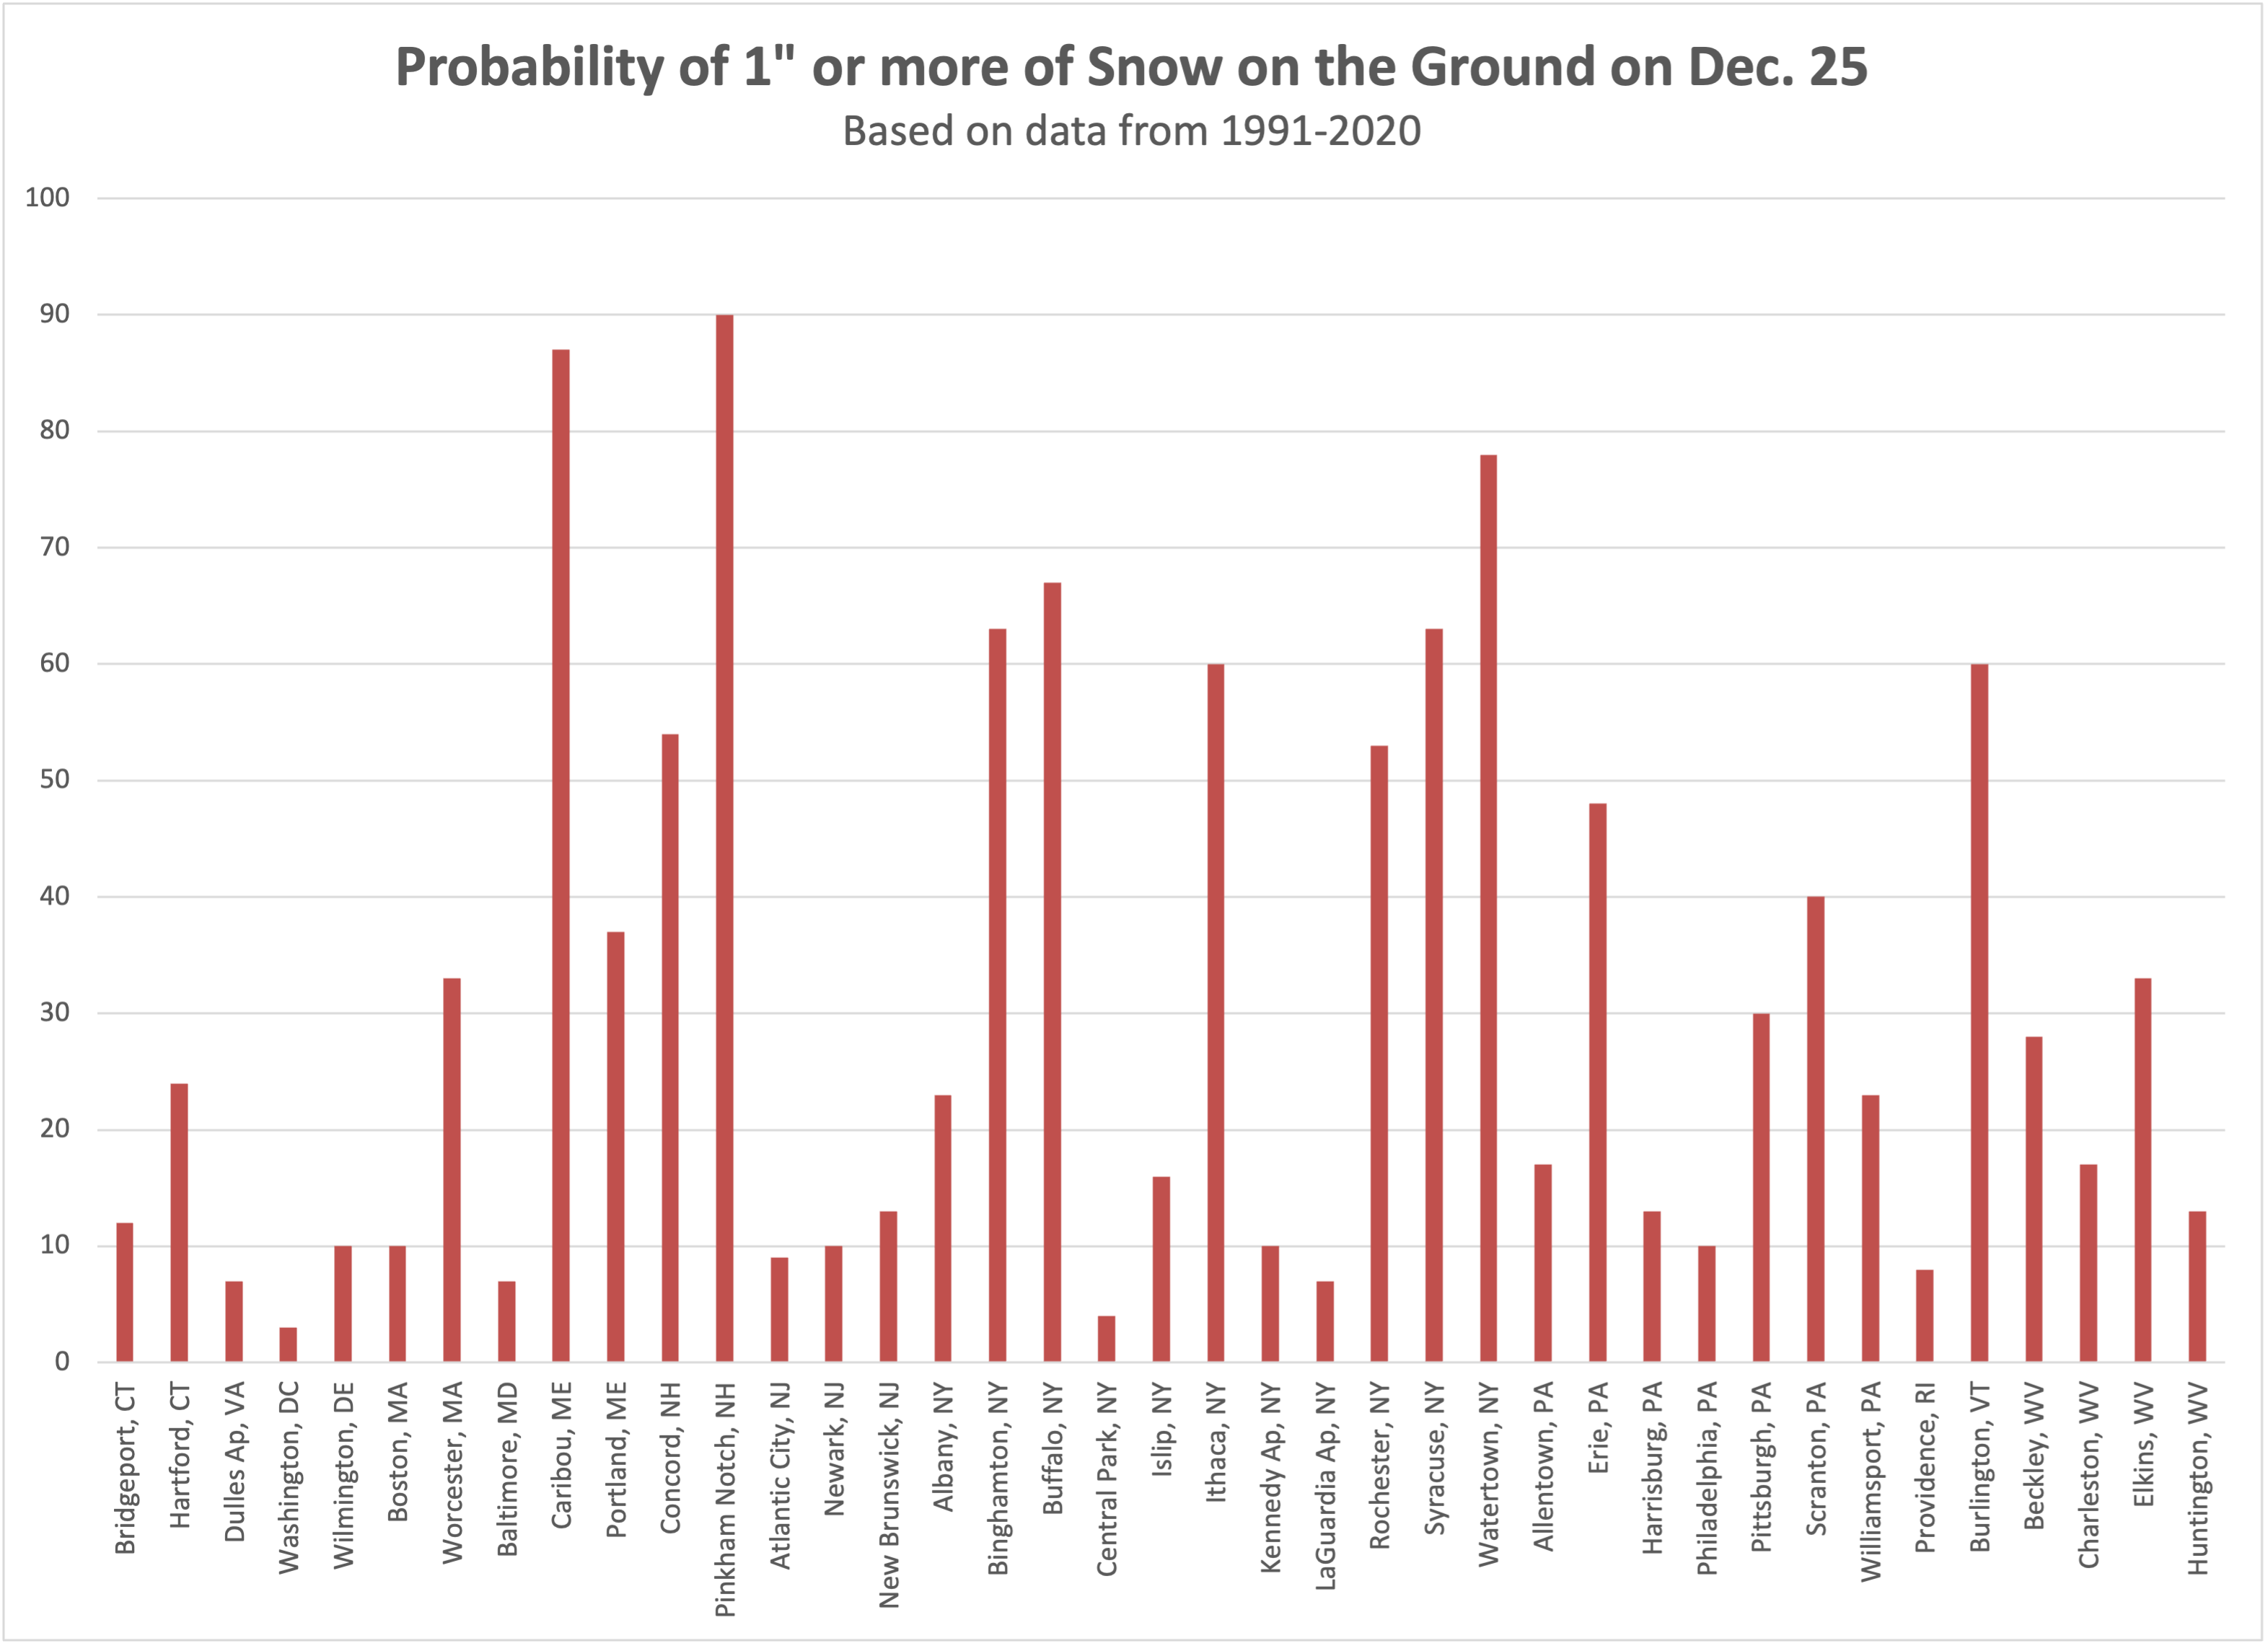
Probabilities of a white Christmas for select US and Northeast cities based on data from 1991-2020.
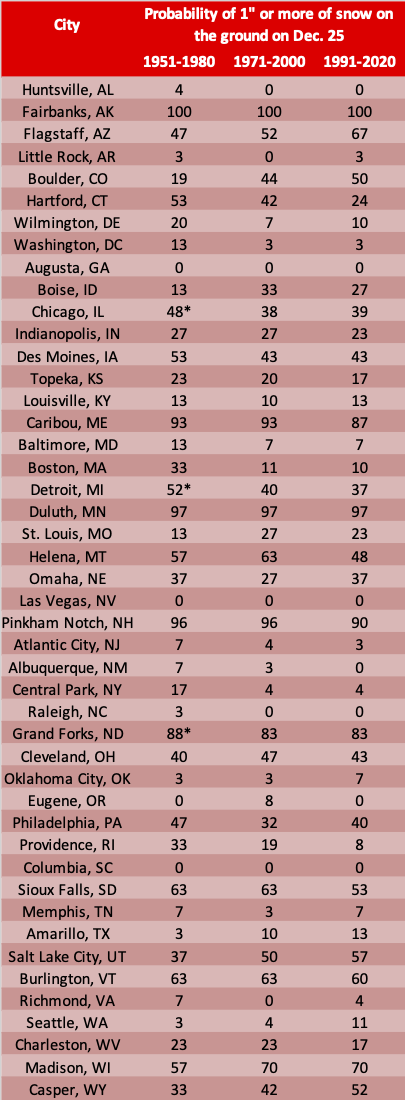
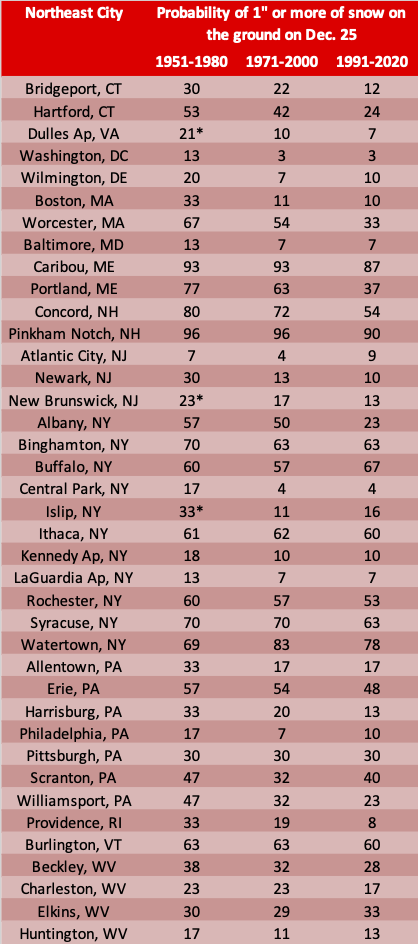
Have you noticed that Christmas snow cover was different during your childhood than it is now? You may be right! We’ve calculated the probabilities of an inch of snow on the ground on December 25th for select U.S. and Northeast cities for three different time periods. Maybe you’re in your 60s and grew up between 1951 and 1980, or maybe you’re in your 40s and grew up between 1971-2000, or maybe you grew up during the most recent period 1991-2020. Check out the different probabilities to see how the chance of a White Christmas has changed!
Probability of 1" or more snow on the ground on December 25th for three different 30-year periods. *Data began later than 1951 (Dulles Ap, VA: 1961; New Brunswick, NJ: 1968; Islip, NY: 1963; Chicago, IL: 1958; Detroit, MI: 1958; Grand Forks, ND: 1965)
Many cities in the Northeast have seen the probabilities decrease, such as Portland, ME and Worcester, MA. There have been a few cities, such as Boulder, CO, that have seen an increase in the likelihood of a white Christmas. And yet other cities have seen probabilities vary, going up and/or down between the three periods.
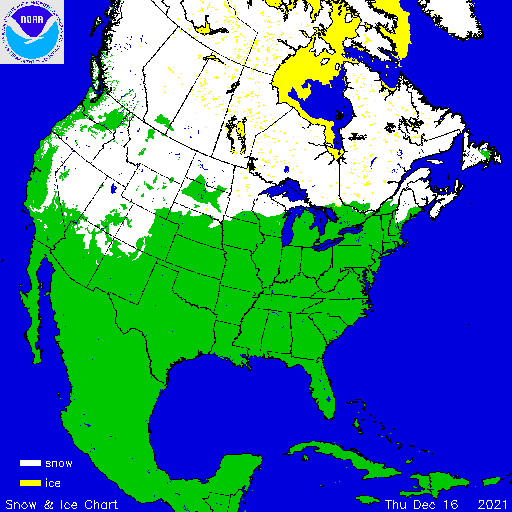
Snow cover as of December 16th, these maps were produced by the NOAA, National Operational Hydrologic Remote Sensing Center.
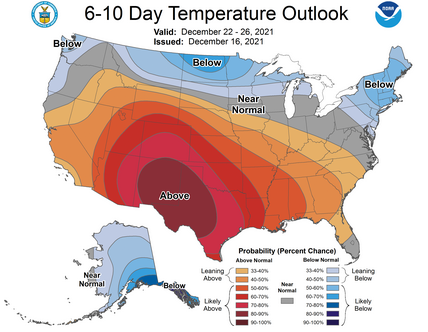
This year, a large part of the U.S. is looking pretty green. The Northeast region has had a warm and dry December that led to below-normal snowfall. NOAA’s Climate Prediction Center’s outlook for December 22-26 favors below-normal temperatures for much of the Northeast, as well as parts of the Pacific Northwest to the Great Lakes. A large portion of the U.S. is favored to have near- to above-normal temperatures.
Temperature outlook for December 22-26.
If you’re feeling nostalgic and dreaming of a white Christmas, you may have to travel north.

