A Stormy Spring Signs Off

Damage from an EF-1 tornado in Lackawanna County, PA, on May 28. Photo courtesy of National Weather Service Binghamton.
May was generally an even more active month for severe weather than April. Preliminary data indicates that 16 tornadoes touched down in Pennsylvania during May, bumping the state’s spring total to 30 (six times the average) and the year-to-date total to 31 (1 in January and 14 in April). In addition, there were three tornadoes in Maryland and one in New Jersey. Straight-line winds of up to 100 mph, softball-sized hail, and flash flooding also occurred in the region.
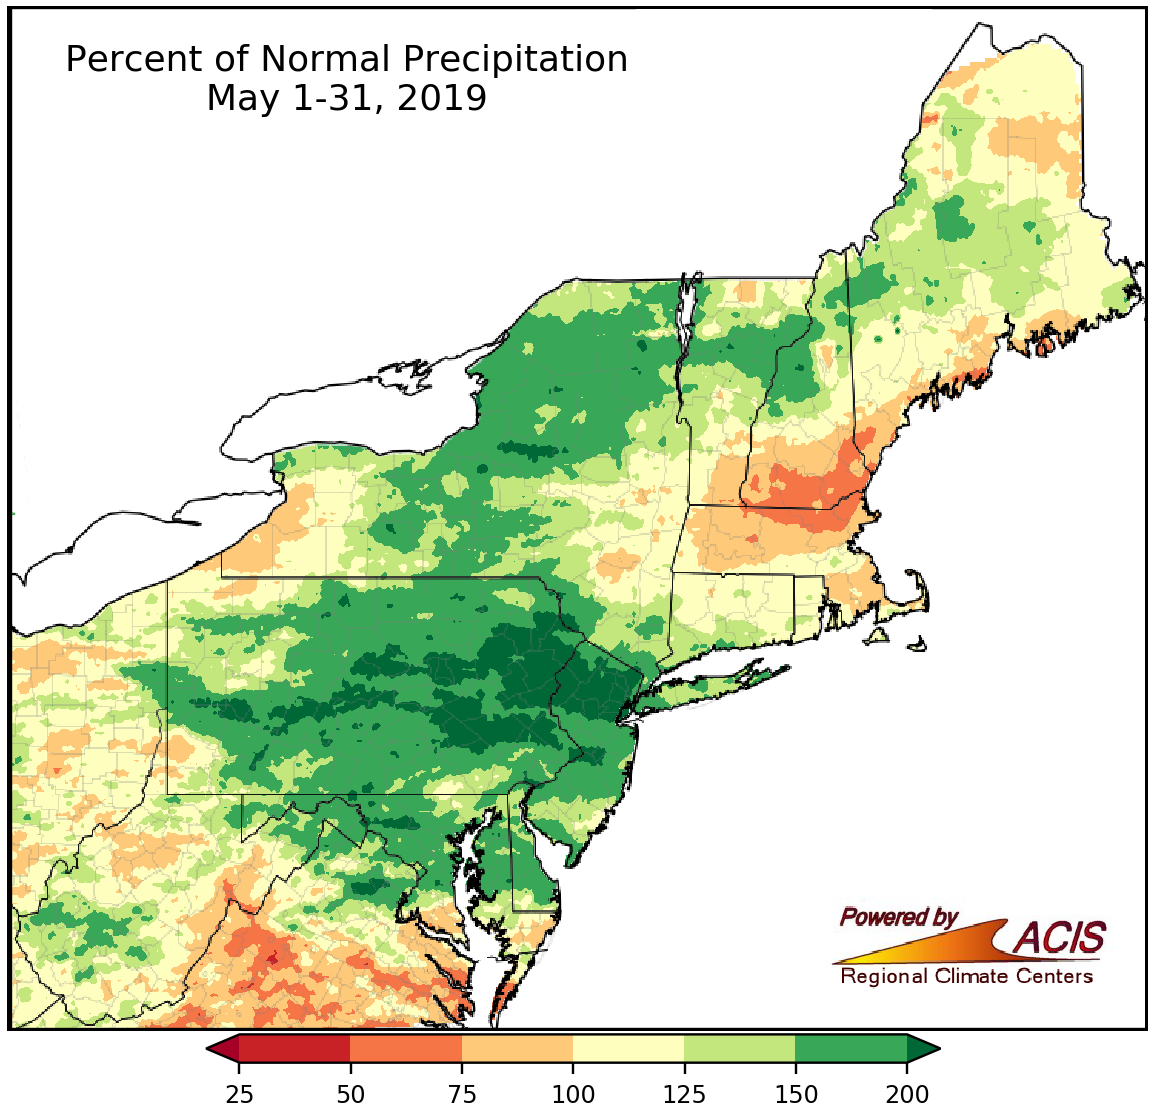
Much of the Northeast received between 100% and 200% of normal May precipitation.
Similar to April, it was persistently wet during May for much of the region. Seven major climate sites had their greatest number of May days with measurable precipitation (0.01 inches or greater). In fact, for Kennedy Airport, NY, and Harrisburg, PA, it was the greatest number for any month at 21 days. When the precipitation for the month was summed up, most areas received between 100% and 200% of normal, with some spots in Pennsylvania and New Jersey seeing more. Nine major climate sites ranked this May among their 10 wettest on record. With 8.72 inches of rain for the month, Charleston, WV, was only 0.04 inches away from tying their wettest May on record (set in 2001). However, there were some drier spots in New England, particularly in southern New Hampshire and northern Massachusetts, where less than 75% of normal precipitation fell.
Spring precipitation ranged from 75% of normal to 200% of normal, with many areas on the wet side of normal. Five major climate sites ranked this spring among their 10 wettest on record, while Providence, RI; Boston, MA; and Islip, NY, had their greatest number of spring days with measurable precipitation.
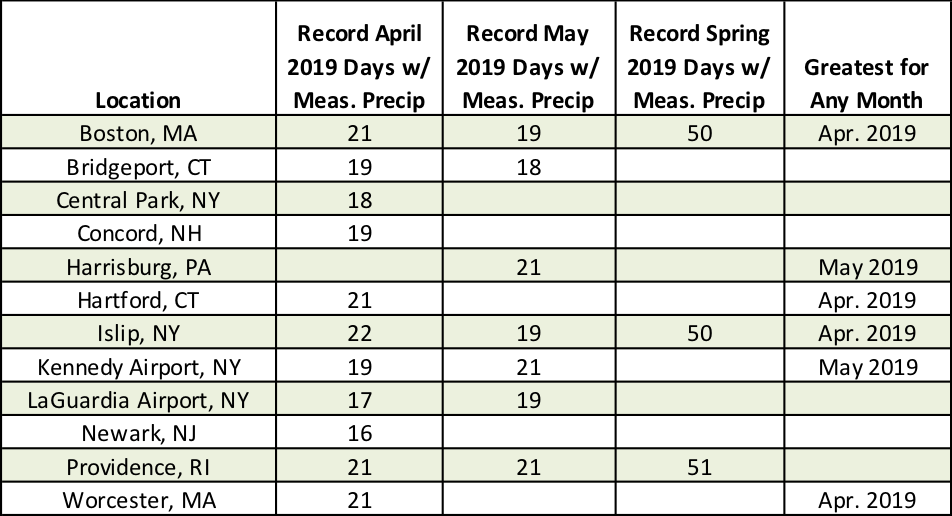
Several sites had their greatest number of days with measurable precipitation during April, May, and/or spring.
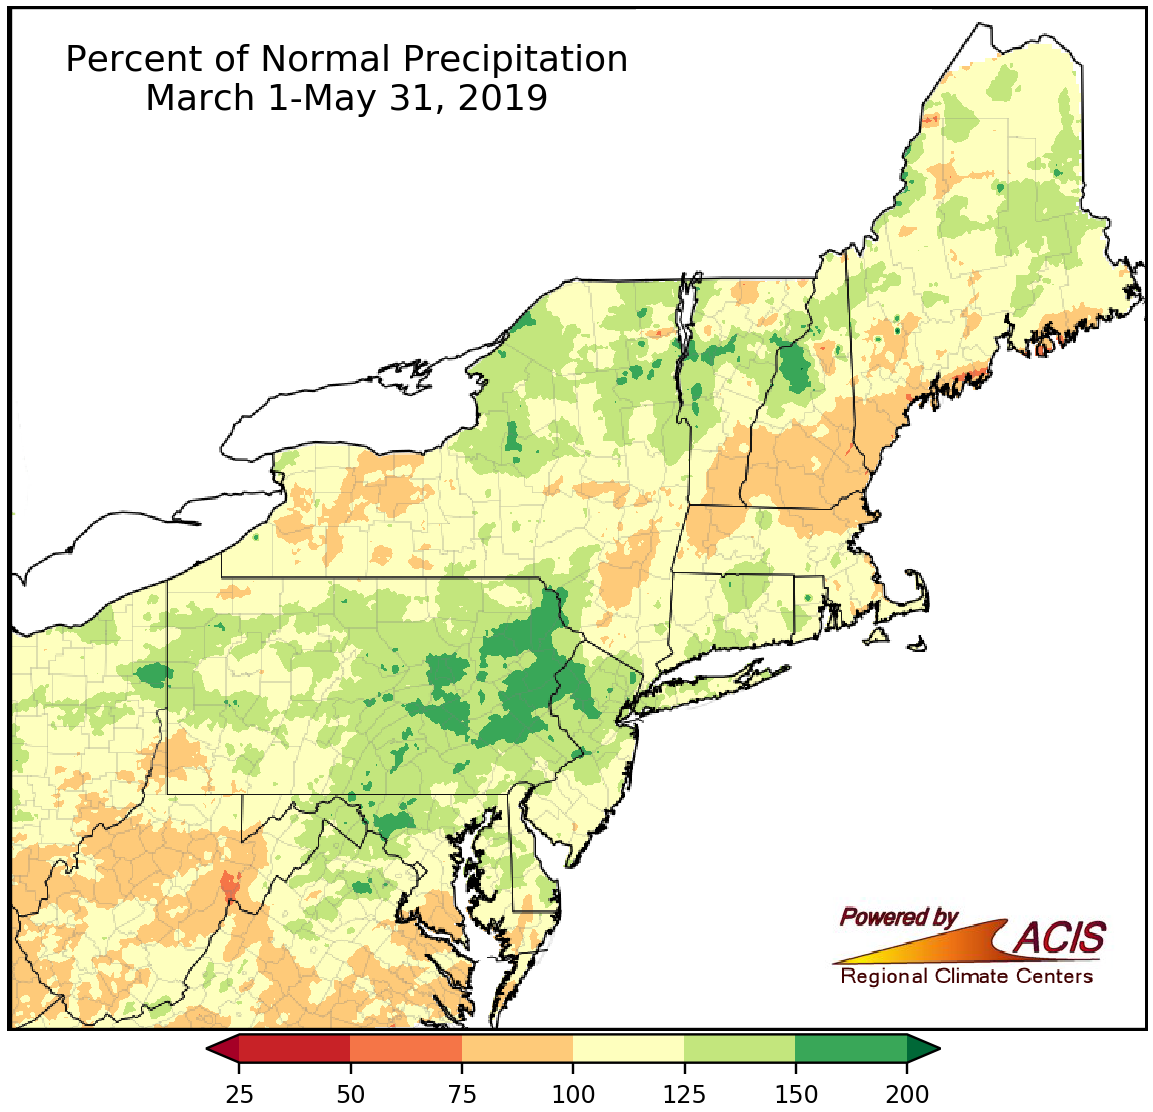
Spring averaged out to be wetter than normal for a large chunk of the Northeast.
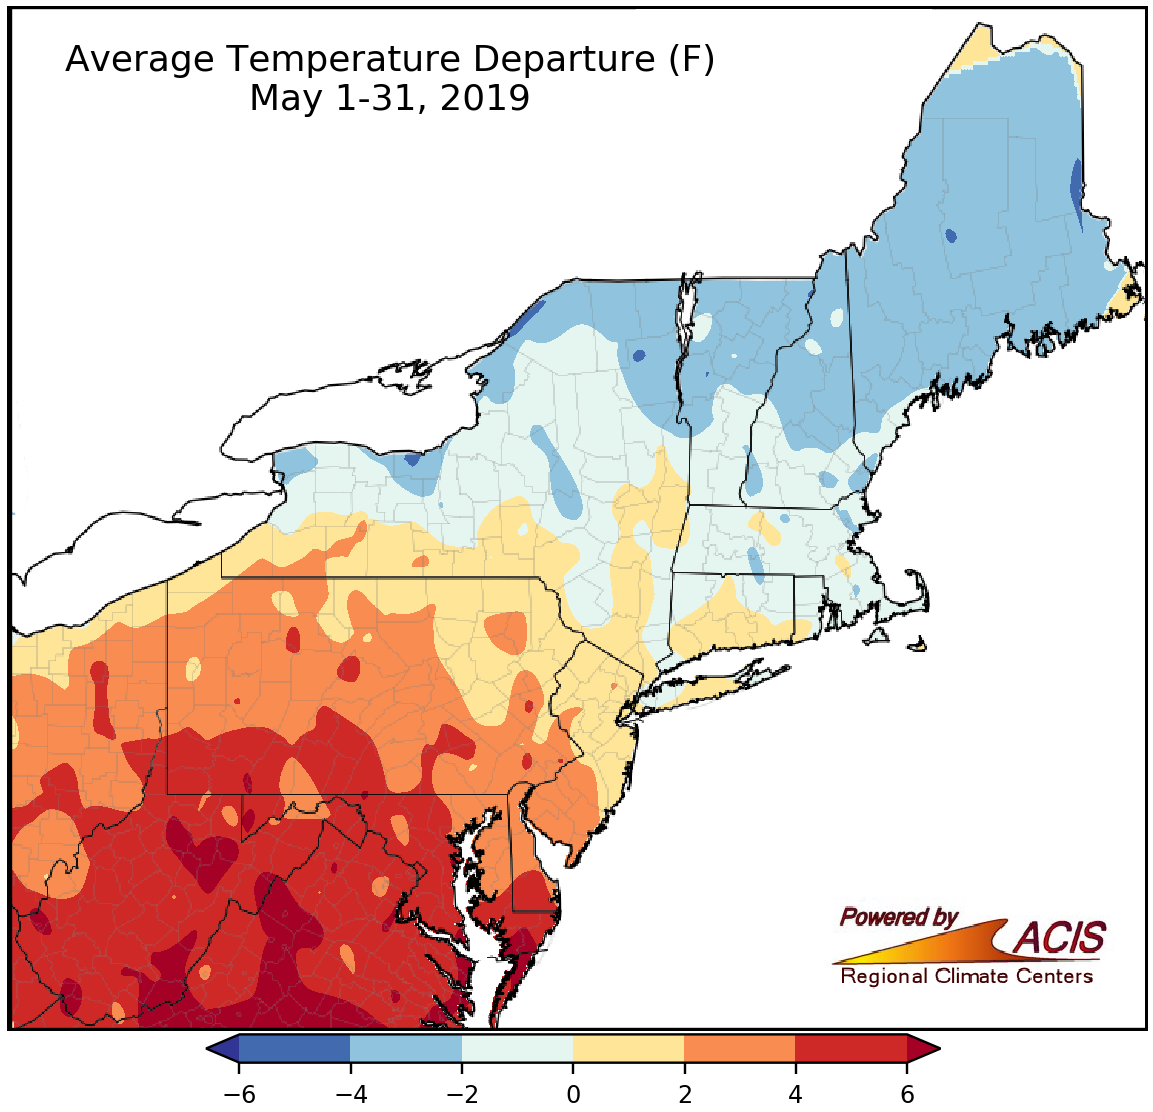
May temperatures ranged from 4°F below normal to more than 6°F above normal.
May temperatures were wide-ranging, from 4°F below normal to more than 6°F above normal. The dividing line between below-normal and above-normal temperatures generally hugged New York’s southern border, with areas to the north being colder and areas to the south being warmer. The coldest spots were in northern New York and northern New England, while the warmest spots were in West Virginia. Six major climate sites ranked this May among their 10 warmest on record.
The temperature pattern for spring was very similar to that of May (and to some extent April), with New York and New England generally colder than normal and the rest of the region warmer than normal. Overall, temperatures ranged from 4°F below normal to 4°F above normal. Nine major climate sites ranked this spring among their 10 warmest on record.
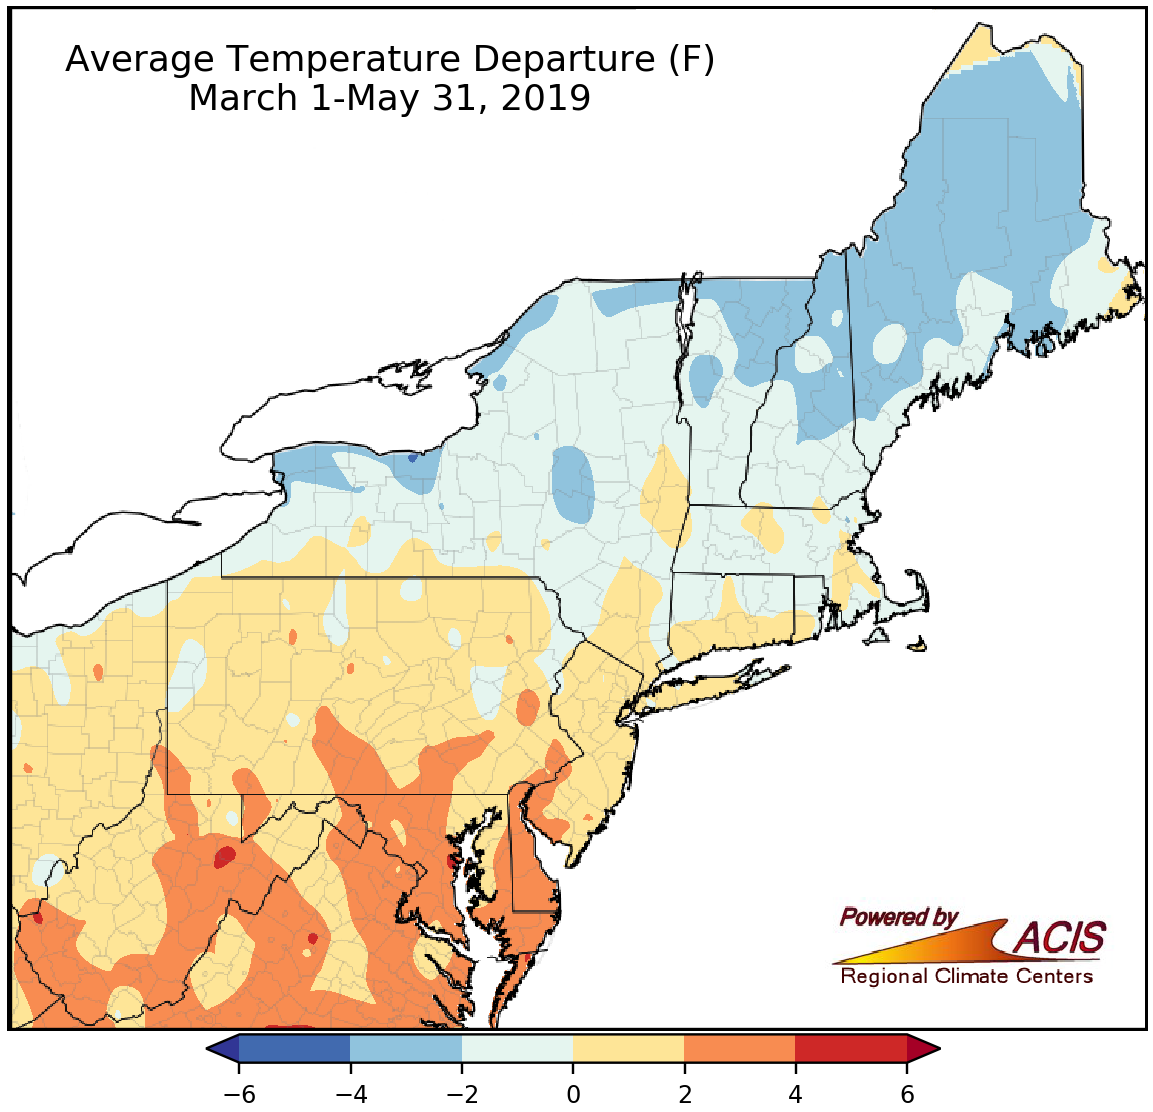
Spring temperatures ranged from 4°F below normal to 4°F above normal.
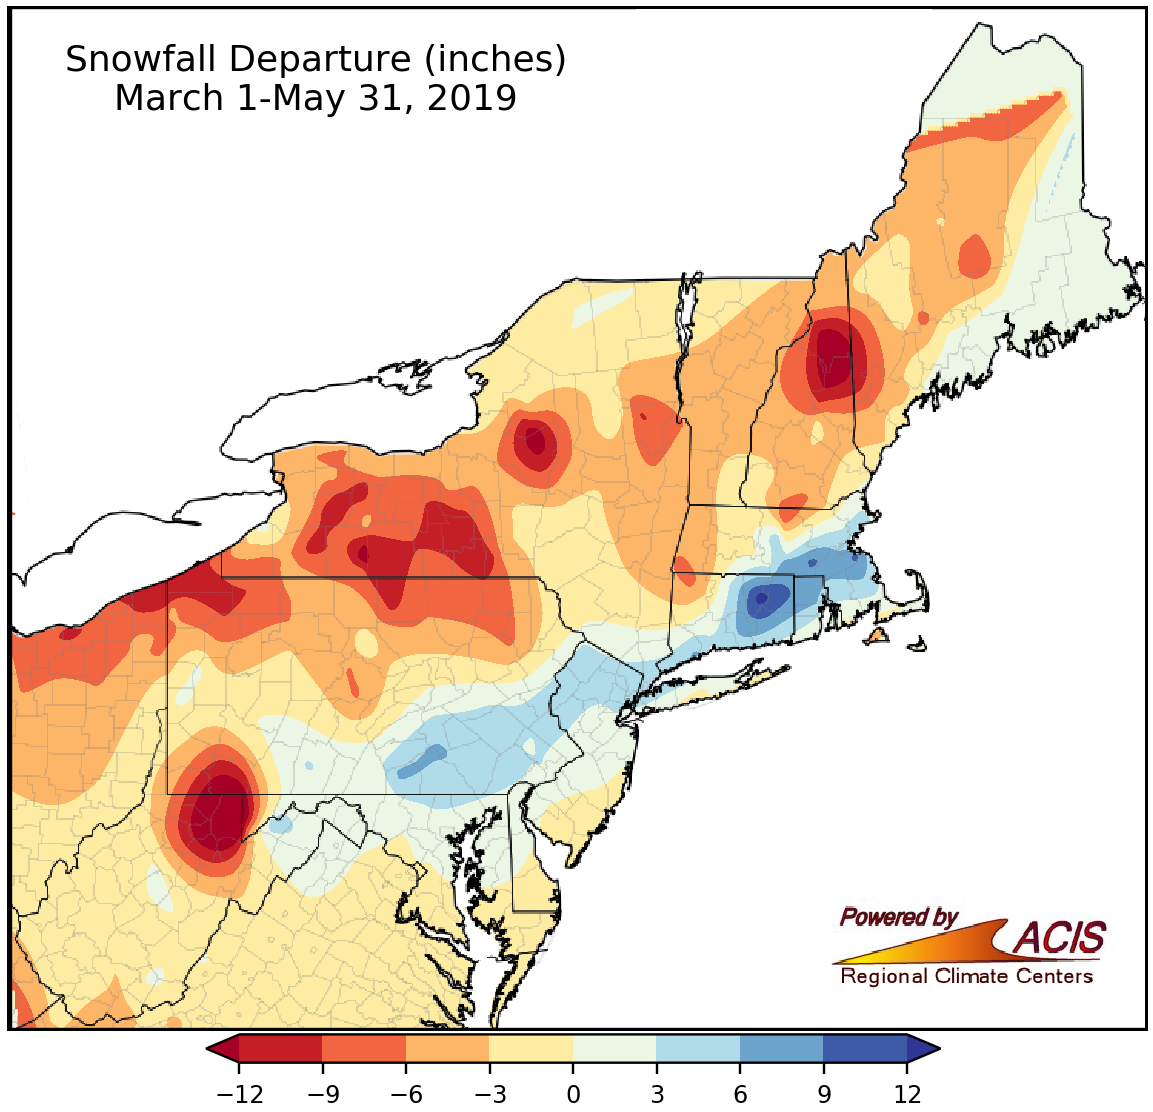
Spring snowfall was below normal for a large part of the Northeast.
For much of the Northeast, spring snowfall ranged from 12 inches below normal to near normal. Though, there were some larger deficits in northern West Virginia and northern New Hampshire. Snowfall surpluses were found in an area from the Eastern Panhandle of West Virginia northeast through eastern Massachusetts due to back-to-back snowstorms during the first half of March. For example, Bridgeport, CT, picked up more than double its normal snowfall for the season during those storms and made it the 10th snowiest spring on record for the site.
For the snow season, which runs October through May, snowfall totals ranged from more than 24 inches below normal to more than 24 inches above normal. The higher elevations of West Virginia and western Pennsylvania were some of the areas with the largest deficits. Islip, NY’s snow deficit of 12 inches was enough to make it the ninth least snowy season on record for the site. On the other hand, some of the largest surpluses were found in parts of northern New England. For instance, Caribou, ME, and Burlington, VT, had one of their 10 snowiest seasons on record.
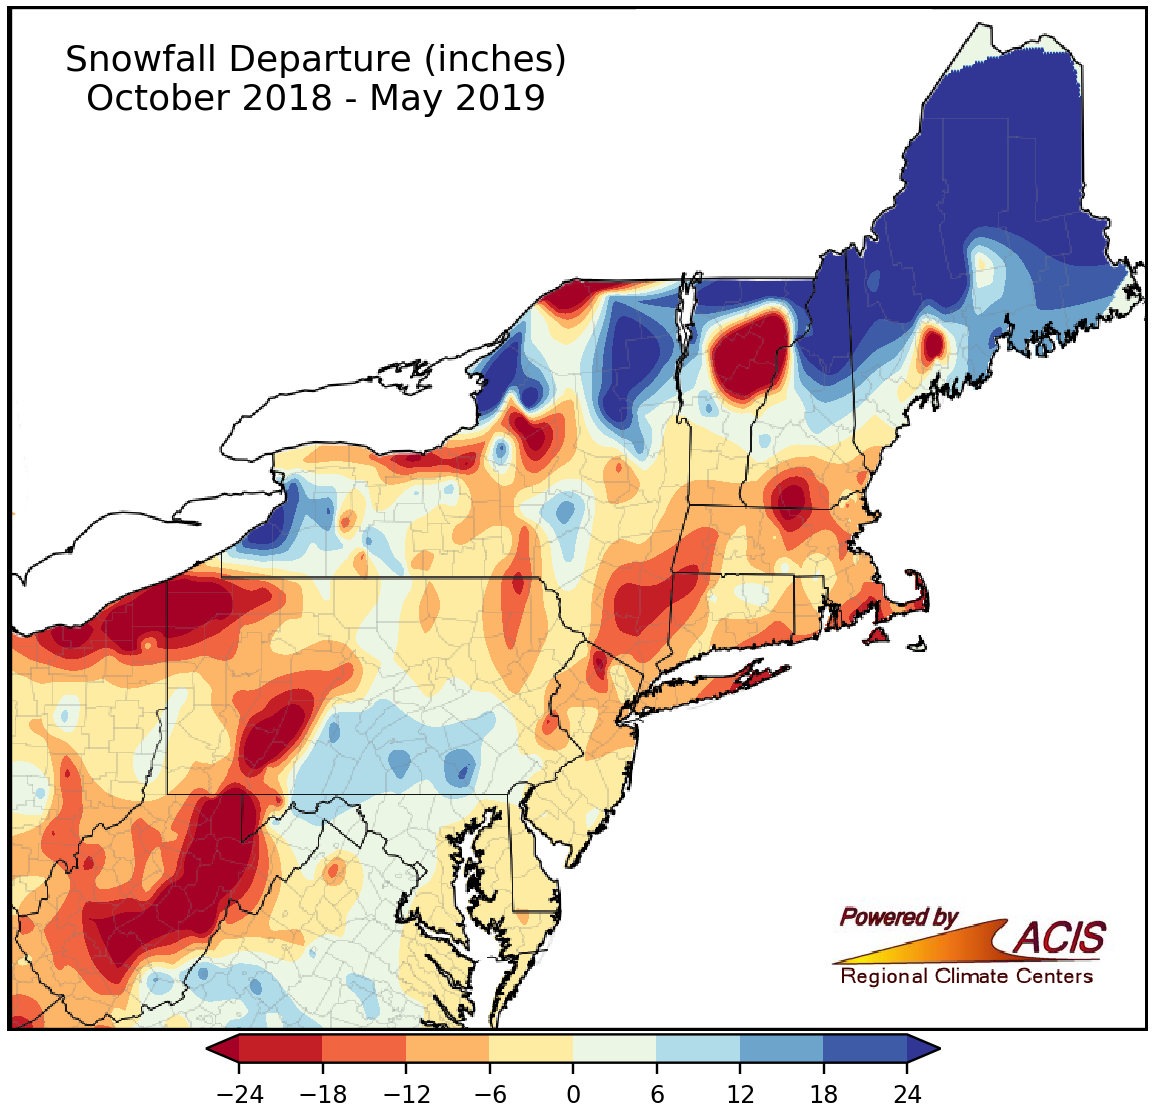
Snow season totals varied, with large deficits in southwestern areas and large surpluses in northeastern areas.
Now that meteorological spring has wrapped up, it’s time to look ahead to summer! There are increased odds that the season will average out to be warmer than normal for the whole Northeast, according to NOAA’s Climate Prediction Center. Summer could be wetter than normal in the Mid-Atlantic, with the rest of the region falling into the equal chances category.
Above-normal temperatures are favored for summer in the Northeast.
Above-normal precipitation is favored for summer in areas shaded green.