Mid-January Status Update
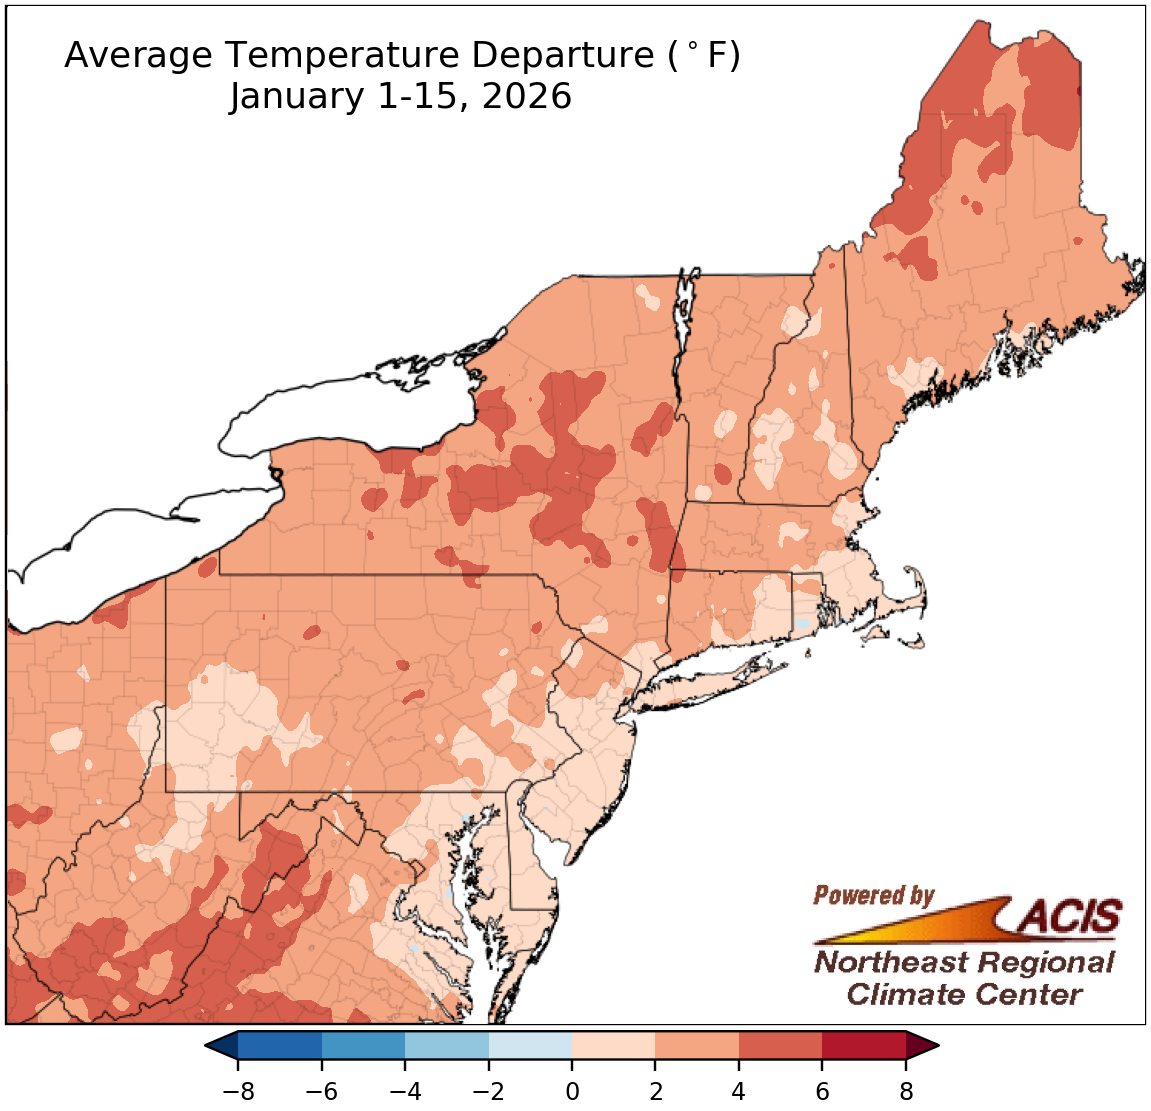
January 1-15 average temperatures ranged from near normal to 6°F above normal.
Average temperatures during the first half of January were up to 6°F warmer than normal for the Northeast, with the greatest departures above normal in places like northern Maine, central New York, and southeastern West Virginia. At the region’s 35 major sites, January 1-15 average temperatures ranged from 2.3°F above normal at LaGuardia Airport, NY, to 5.4°F above normal in Syracuse, NY. This first half of January ranked among the 20 warmest on record for five major sites.
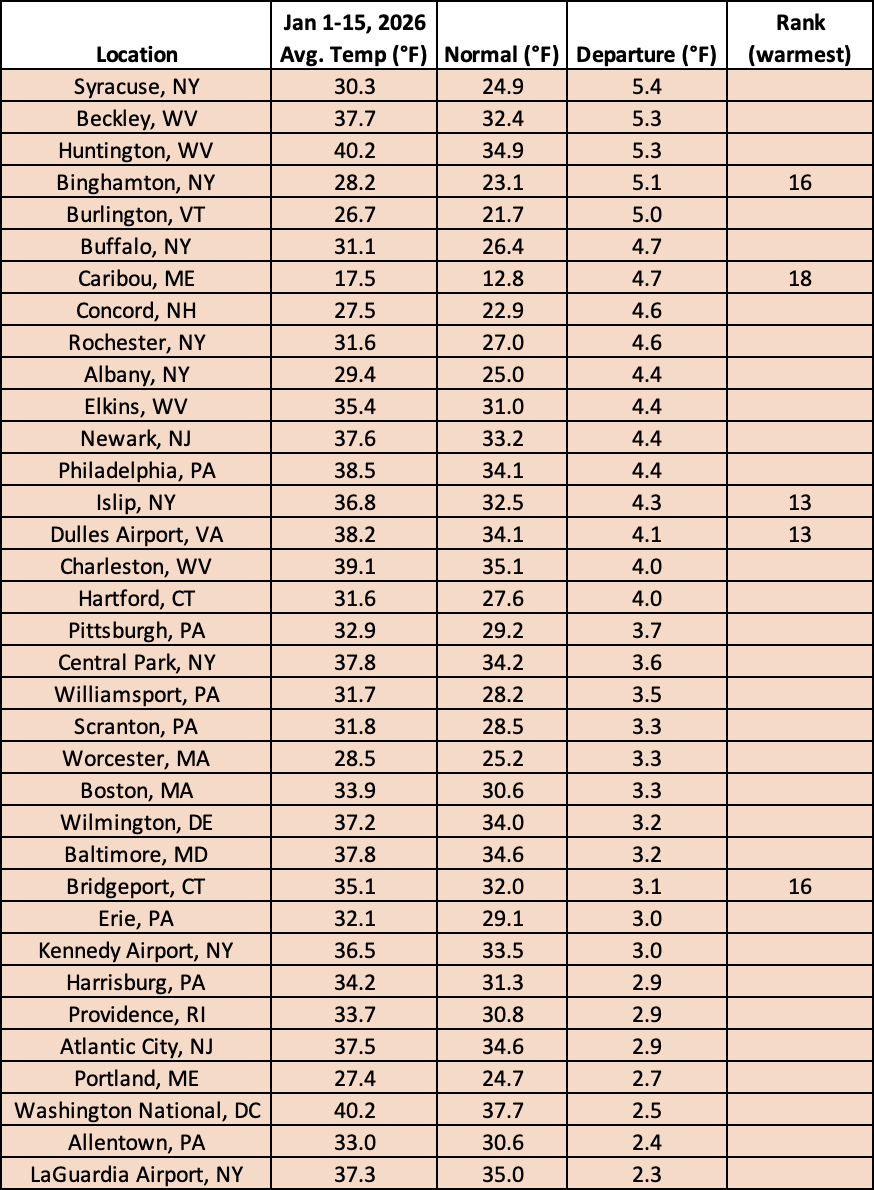
This January 1-15 period ranked among the 20 warmest on record for five major sites.
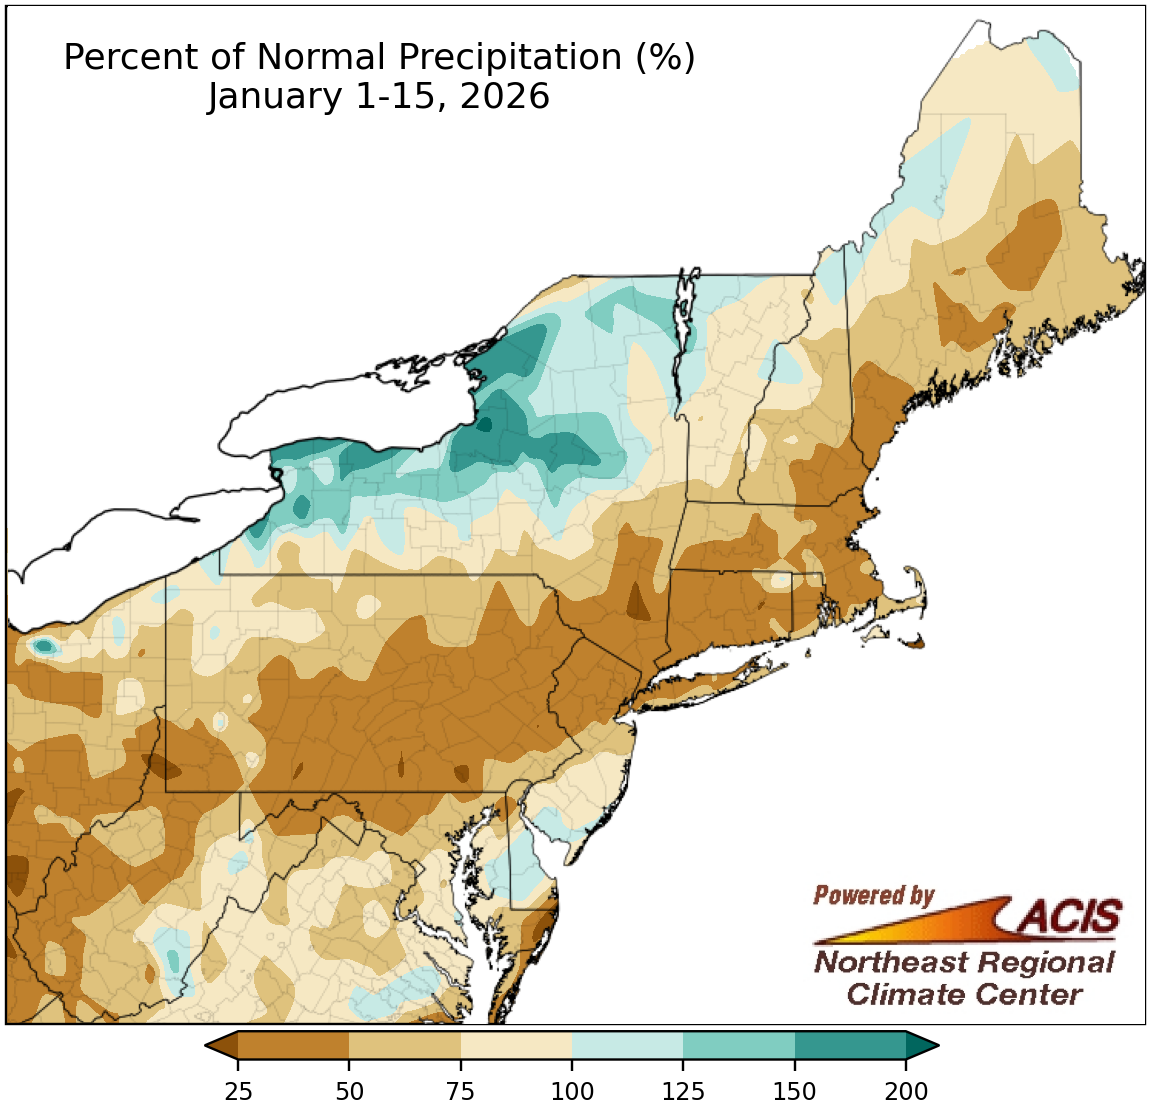
January 1-15 precipitation ranged from less than 25% of normal to 200% of normal.
While precipitation in the Northeast during the first half of January ranged from less than 25% of normal to 200% of normal, much of the region was on the dry side. A swath of the region stretching from western West Virginia up to coastal Maine saw 25% to 50% of normal precipitation. January 1-15 precipitation at the 35 major sites ranged from 24% of normal at Central Park, NY, to 148% of normal in Rochester, NY, with 30 of the sites being drier than normal. This period ranked among the 20 driest such periods on record for eight major sites.
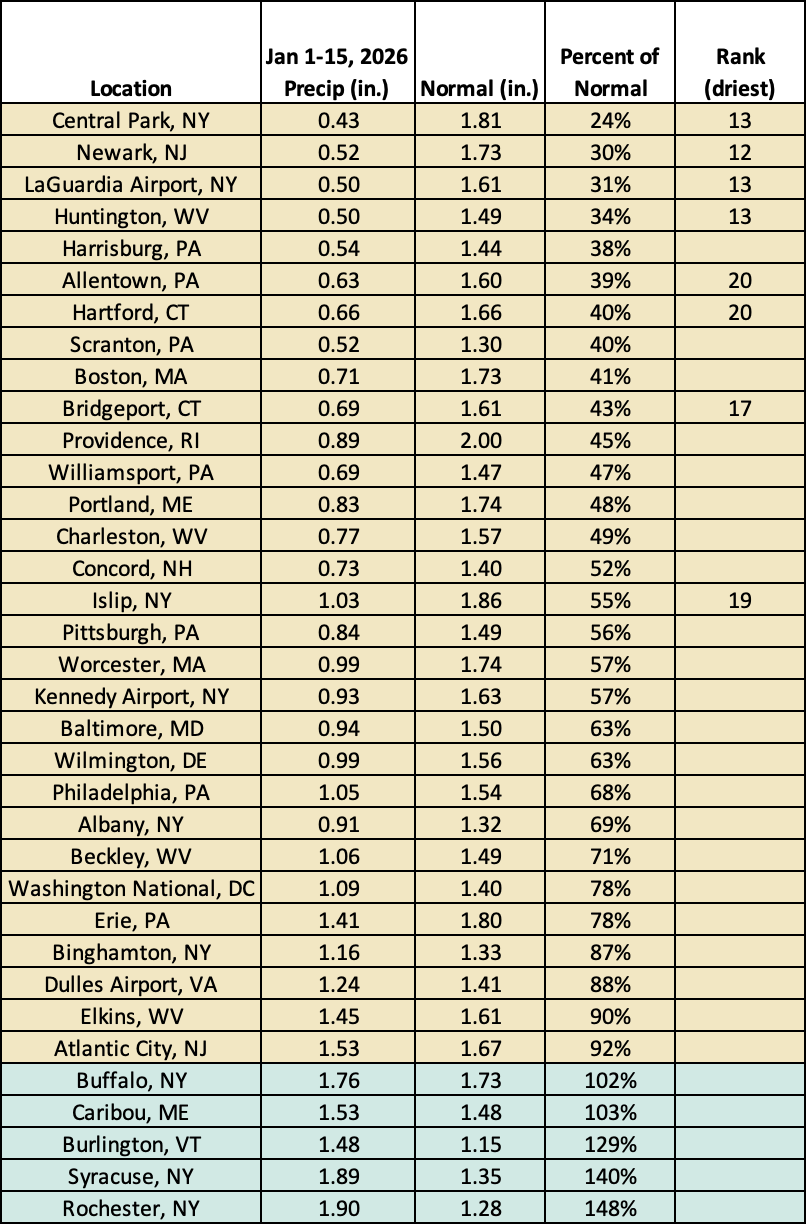
This January 1-15 period ranked among the 20 driest such periods on record for eight major sites.
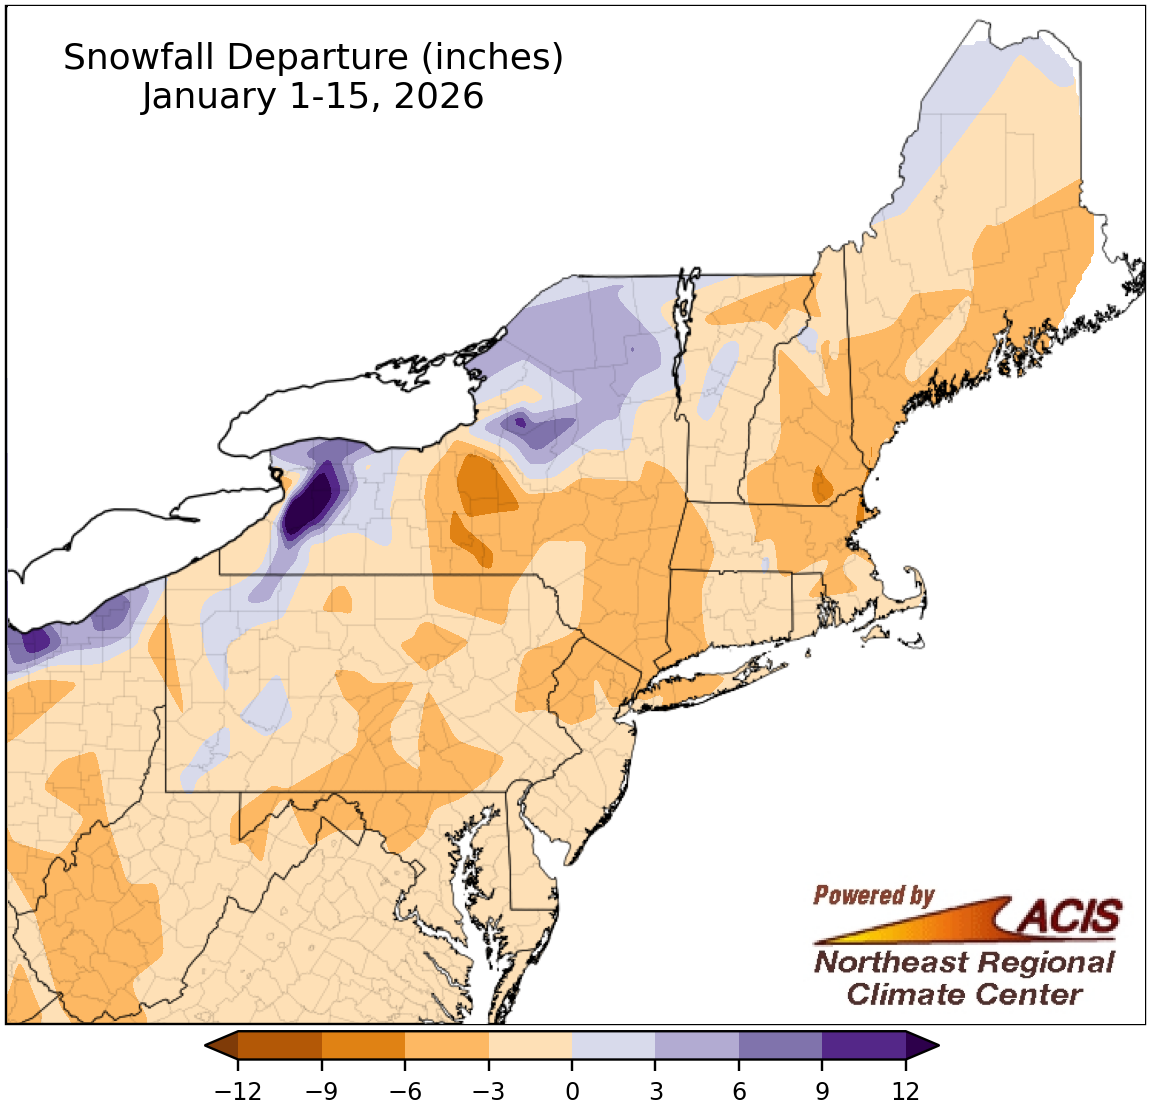
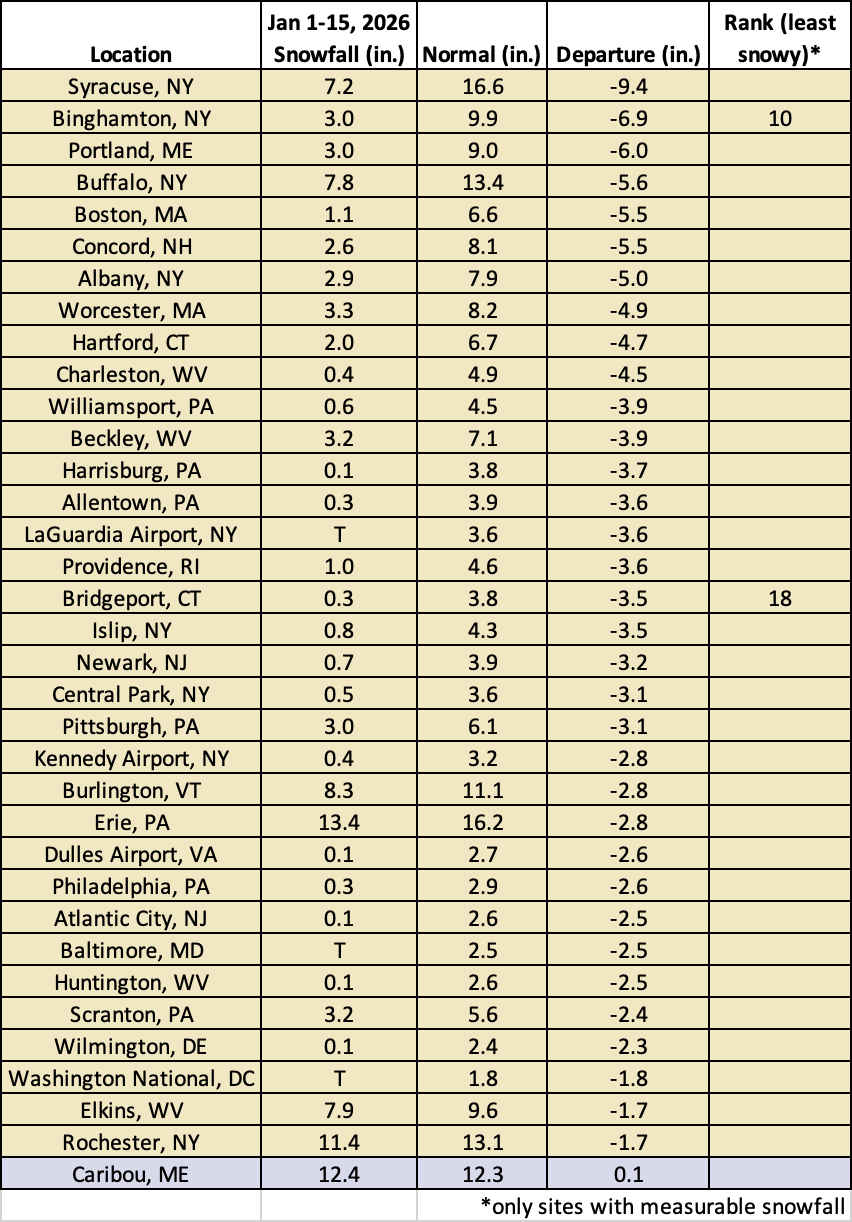
January 1-15 snowfall ranged from nine inches below normal to more than 12 inches above normal.
Much of the Northeast saw below-normal snowfall during the first half of January, with spots like central New York having a deficit of as much as nine inches. However, a few interior and northern locations saw above-normal snowfall, with the largest surplus of over 12 inches in lake-effect prone spots of western New York. At the region’s 35 major sites, January 1-15 snowfall ranged from 9.4 inches below normal in Syracuse, NY, to 0.1 inches above normal in Caribou, ME, the lone snowier-than-normal site. This January 1-15 period was the 10th least snowy for Binghamton, NY, and the 18th least snowy for Bridgeport, CT.
This January 1-15 period was among the 20 least snowy for two major sites.
In the short term, NOAA’s Weather Prediction Center indicates there’s a possibility of a major winter storm, especially in the Mid-Atlantic, from January 23 to 25. If this were to occur, it could swing January from a month with a snowfall deficit to a month with a snowfall surplus in some areas. In addition, NOAA’s Climate Prediction Center (CPC) shows that the rest of January is expected to colder than normal, a flip from the first half of the month.
The February precipitation outlook from CPC shows an increased likelihood of above-normal precipitation for an area stretching from West Virginia up to western Vermont. Equal chances of below-, near-, or above-normal precipitation were forecast for the remainder of the Northeast. For the February temperature outlook, the entire region falls into the equal chances category.
For February, there is a tilt toward above-normal precipitation for interior and northern locations shaded green.
Equal chances of below-, near-, or above-normal temperatures were forecast for February for the entire Northeast.