Variety is the Spice of…February (So Far)
February so far had a bit of everything–record warm, record cold, a lack of snow, abundant snow, continued dryness, and wet conditions.
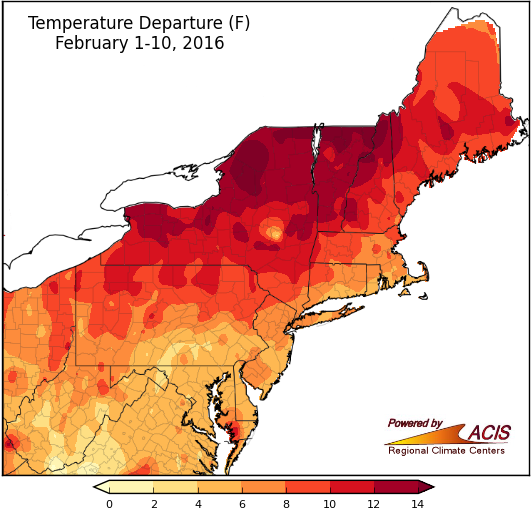
February started off much warmer than normal.
During the first ten days of February, average temperatures were generally 2°F to 14°F above normal. Numerous major airport climate sites ranked the period among their top 20 warmest. In fact, for Albany, NY, it was the warmest on record. However, Arctic air moved into the region Valentine’s weekend, bringing record-cold temperatures with it. Binghamton, NY; Bridgeport, CT; and Islip, NY each had their all-time coldest February temperature on record. Due to the Arctic blast, average temperatures dropped by more than 6°F over the course of a few days in many areas. Some spots even fell below normal. For the February 1-15 time period, average temperatures ranged from more than 3°F below normal in parts of West Virginia to more than 4°F above normal in parts of New York and New England. None of the airport climate sites ranked the period among their top 20 warmest.
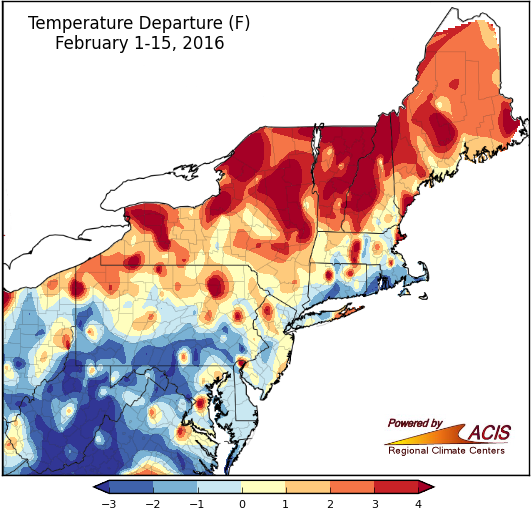
Southern areas were generally colder than normal, while northern areas were warmer.
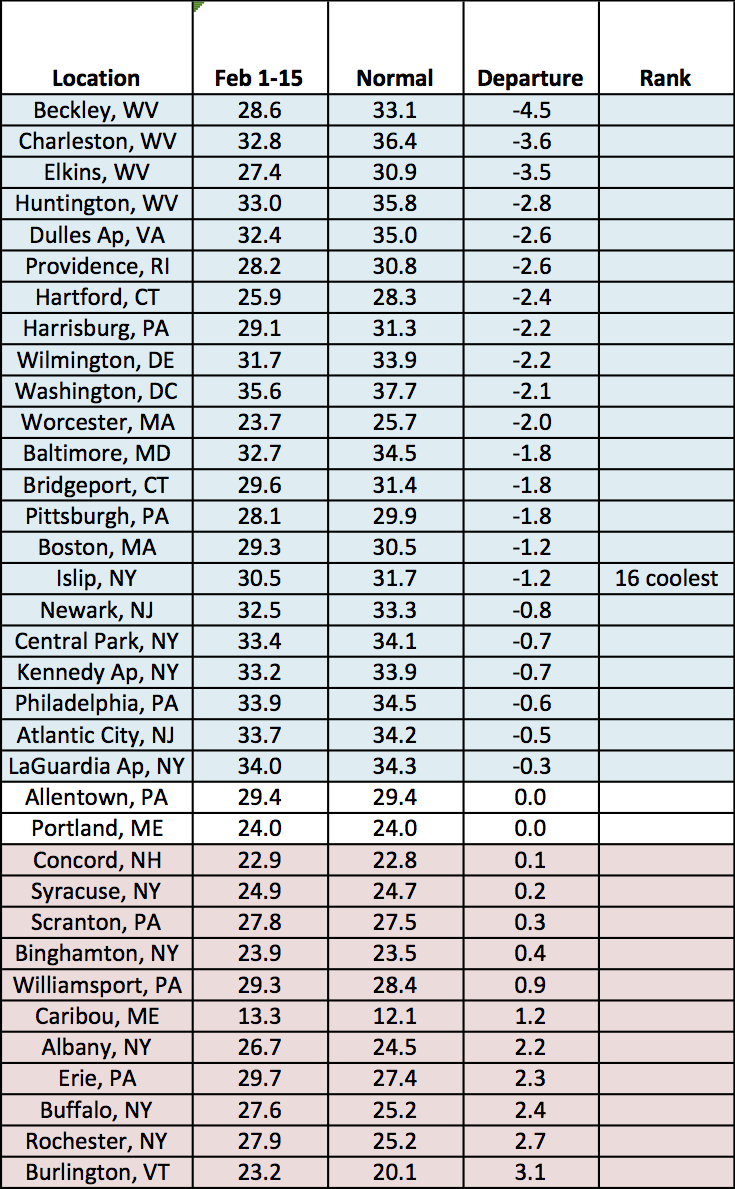
Twenty-two sites were colder than normal during the first half of February.
Precipitation for the first two weeks of February was variable, ranging from 25% of normal to more than 200% of normal. Northern Vermont and the Catskills of New York were some of the drier locations, seeing less than 50% of normal precipitation and a continuation of abnormally dry conditions. Long Island and coastal areas of southern New England were some of the wetter locations due to two storms moving along the coast during the first part of February. As for the airport climate sites, six ranked the period among their top 10 wettest.
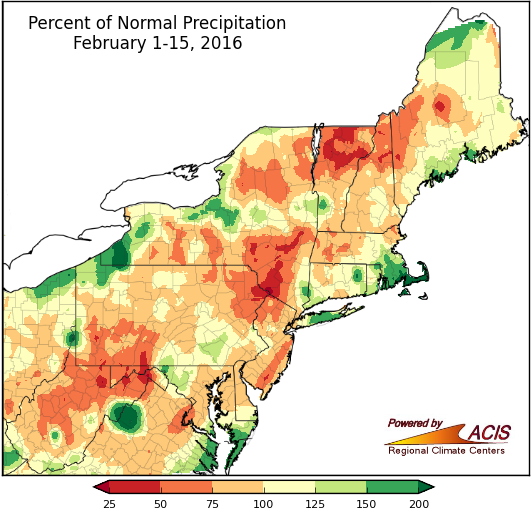
Most of the region saw 50% to 150% of normal precipitation from February 1-15.
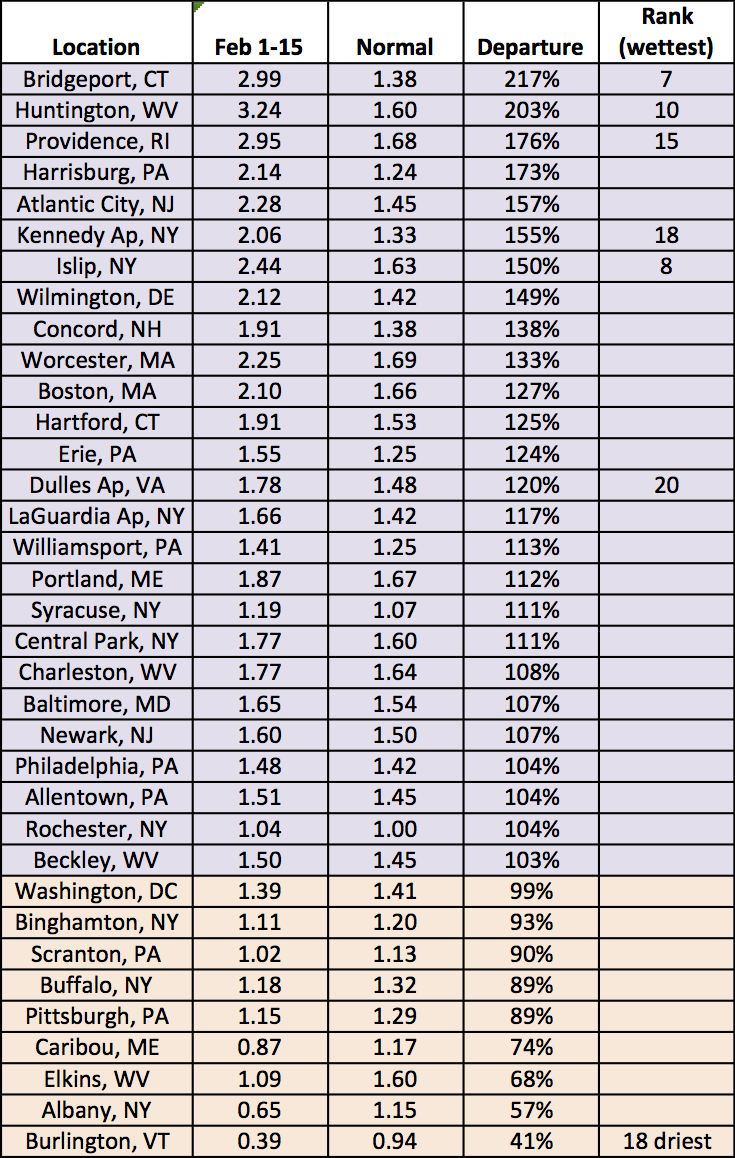
Twenty-six sites were wetter than normal during the first half of February.
Snowfall amounts also varied, from more than 6 inches below normal to more than 6 inches above normal. Northern New York and northern Vermont had the largest deficits, while coastal New England was snowier (due to the coastal storms). Twenty airport climate sites saw above-normal snowfall, with ten of them ranking the period among their top 20 snowiest.
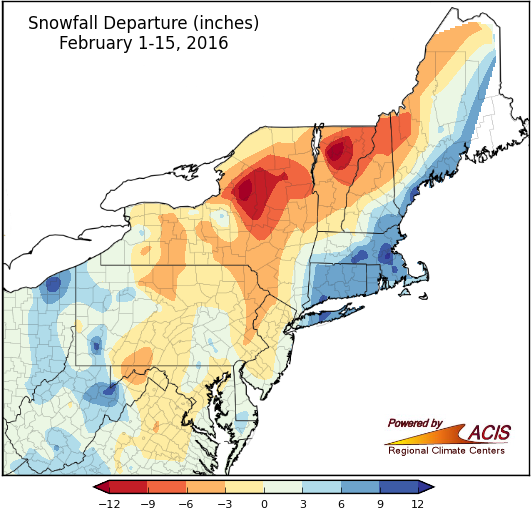
Snowfall was more than a foot below normal in parts of northern New York and northern Vermont, while snowfall in parts of New England was more than 9 inches above normal.
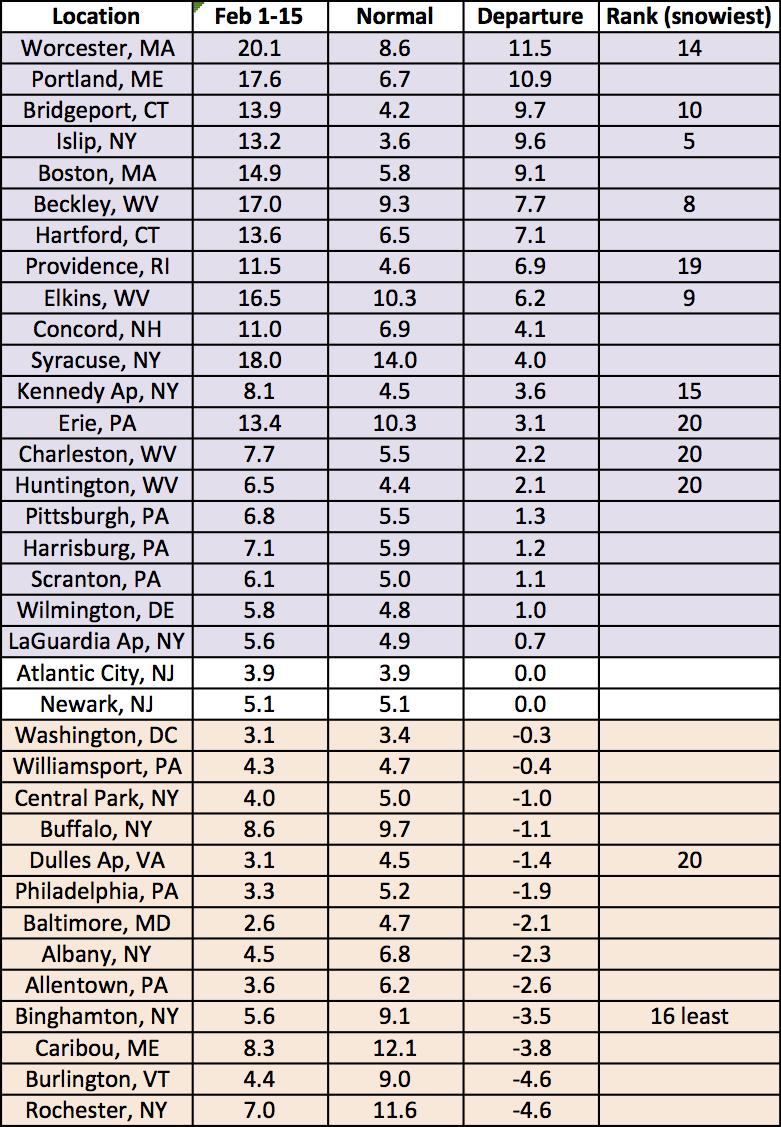
Snowfall at the airport climate sites ranged from 4.6 inches below normal in Rochester to 11.5 inches above normal in Worcester, MA.