Fall Ends on a Cool, Dry Note
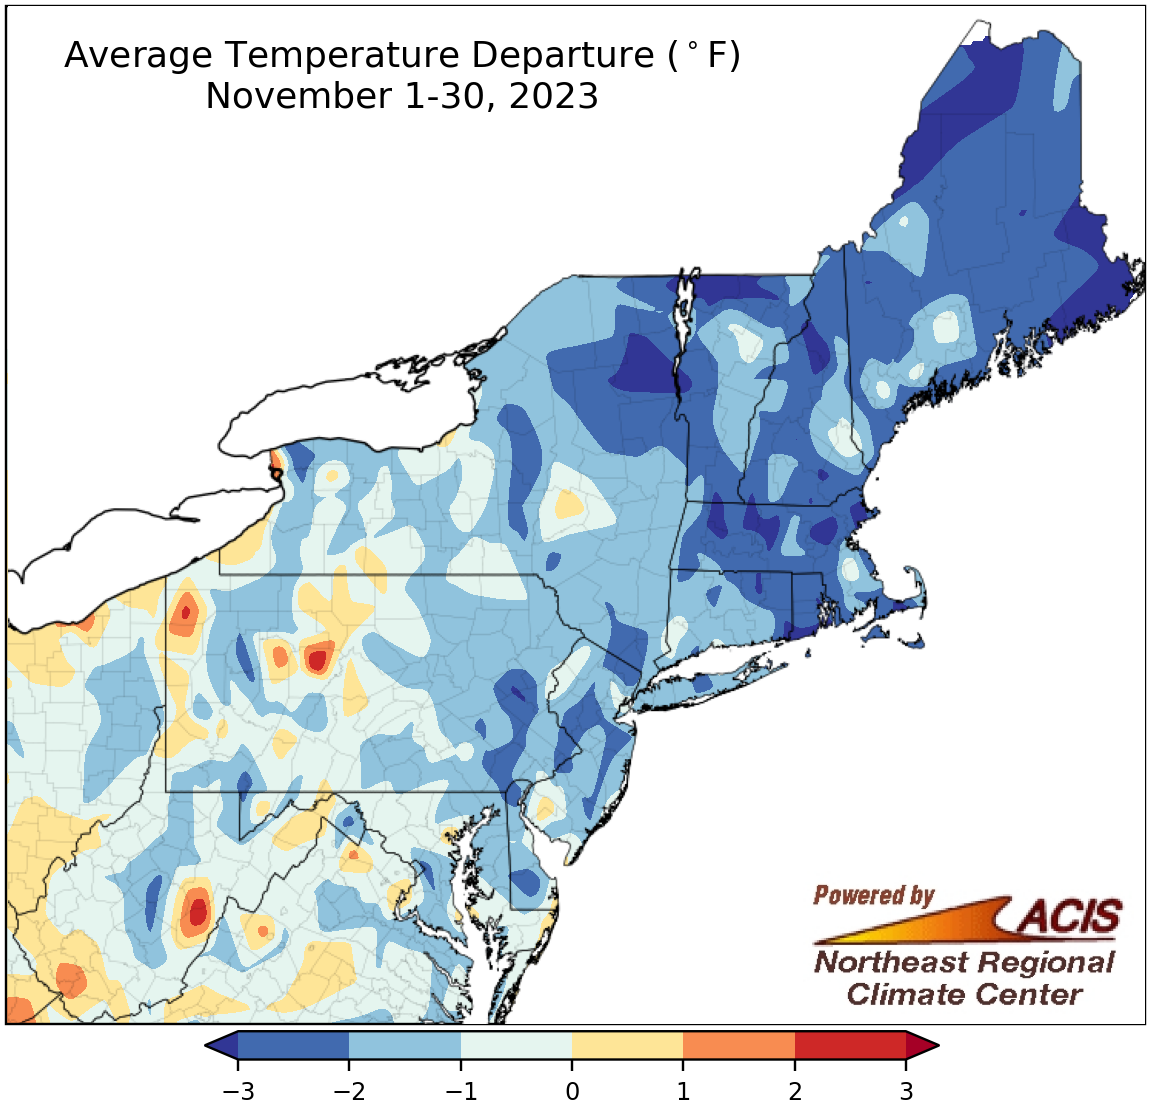
November average temperatures ranged from more than 3°F below normal to within 1°F of normal for most of the Northeast.
Much of the Northeast saw below- or near-normal temperatures during November, with average temperature departures generally ranging from more than 3°F below normal to 1°F above normal. The coolest locations were found in portions of New England and northern New York. Thirty-one of the Northeast’s 35 major climate sites also experienced a cooler-than-normal November, with the month ranking among the 20 coolest Novembers at three of the sites. Overall, November average temperatures ranged from 3.1°F below normal in Allentown, PA, and Providence, RI, to 1.1°F above normal in Huntington, WV.
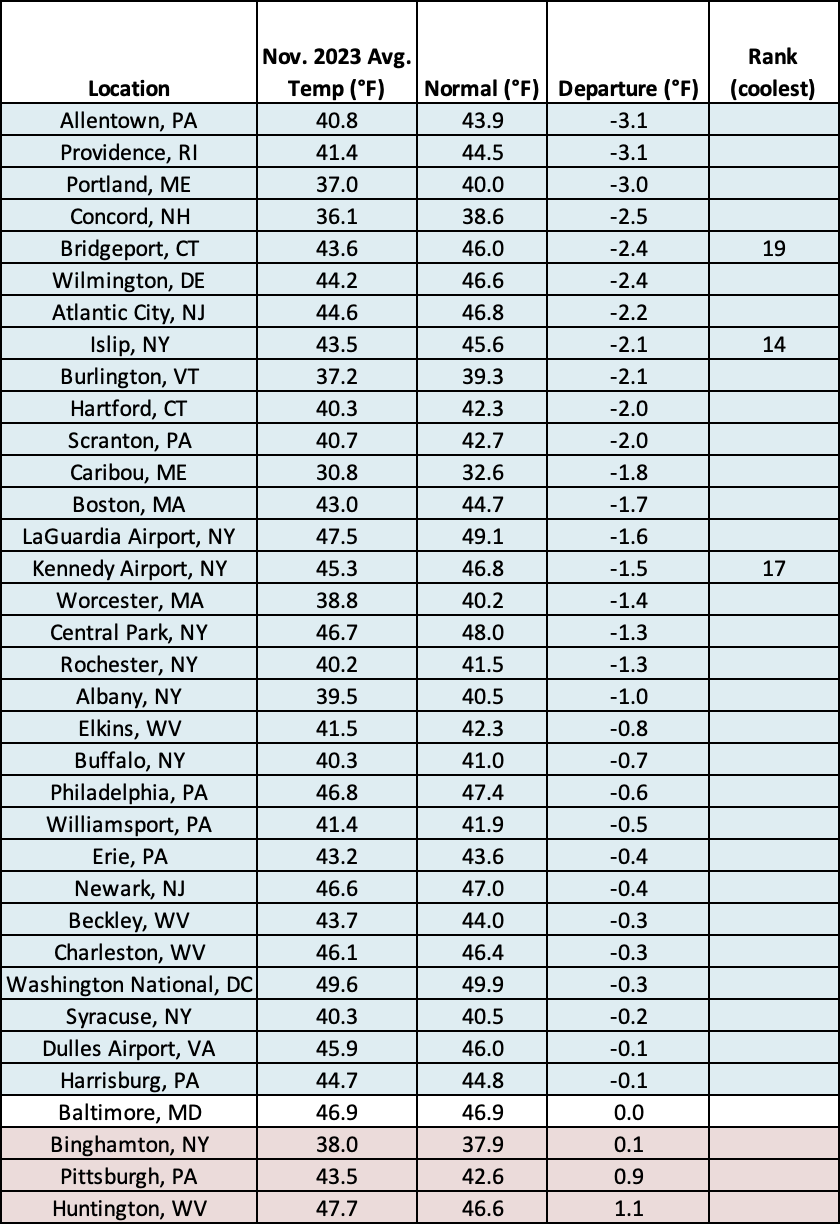
November 2023 was among the 20 coolest on record for three major climate sites.
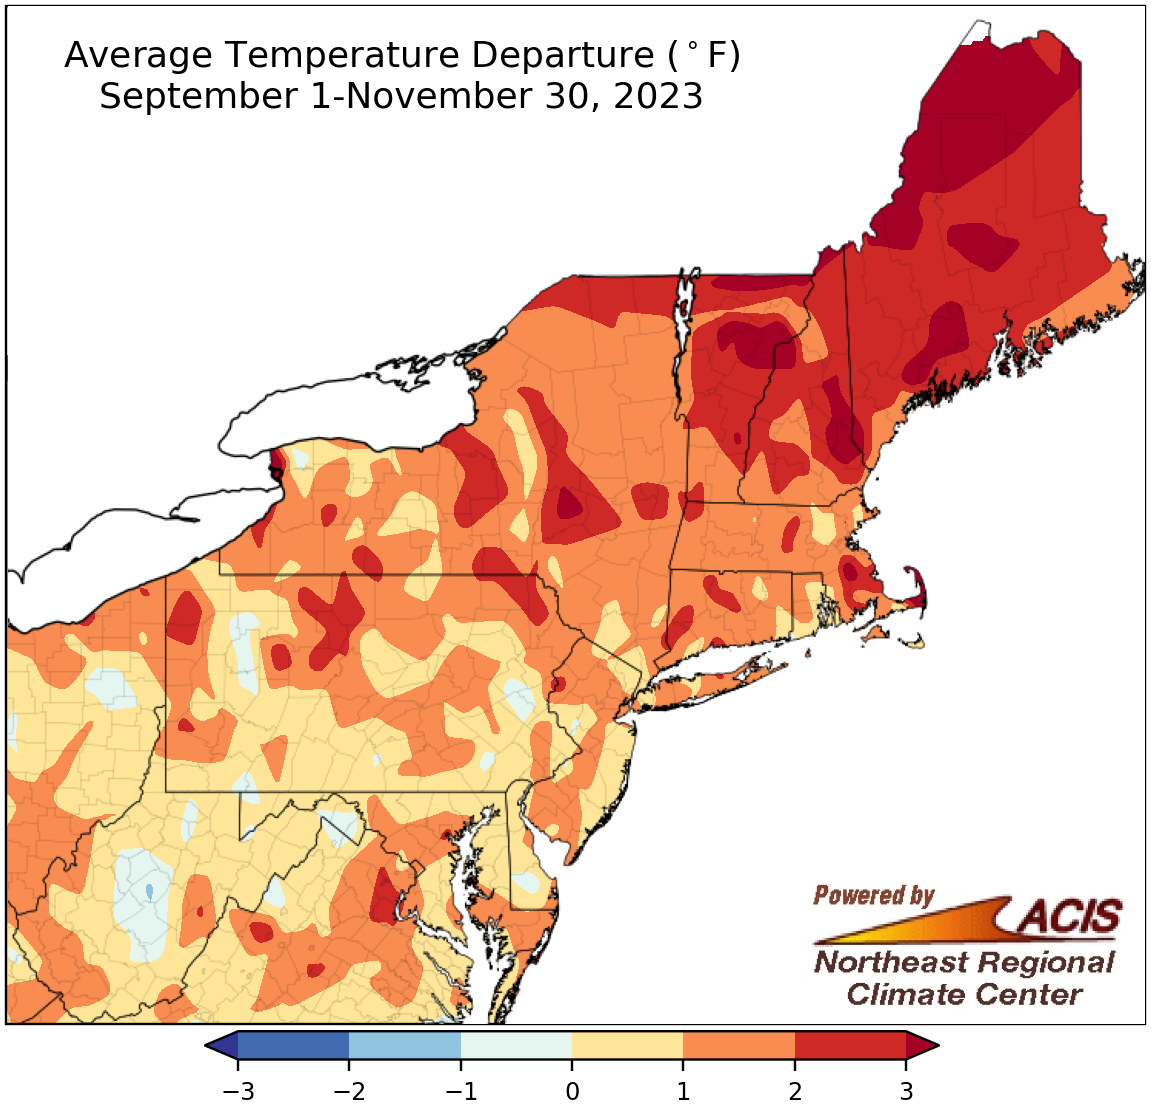
Fall average temperatures ranged from 1°F below normal to more than 3°F above normal.
November’s cooler-than-normal temperatures were in contrast to the warmer-than-normal conditions of September and October. As such, average temperatures for the fall season ranged from 1°F below normal to more than 3°F above normal, with most of the region on the warm side of normal. Fall average temperatures at the major climate sites ranged from 0.7°F below normal in Allentown, PA, to 3.0°F above normal in Caribou, ME. Of the 35 major climate sites, 32 were warmer than normal and 20 of those experienced one of their 20 warmest falls on record.
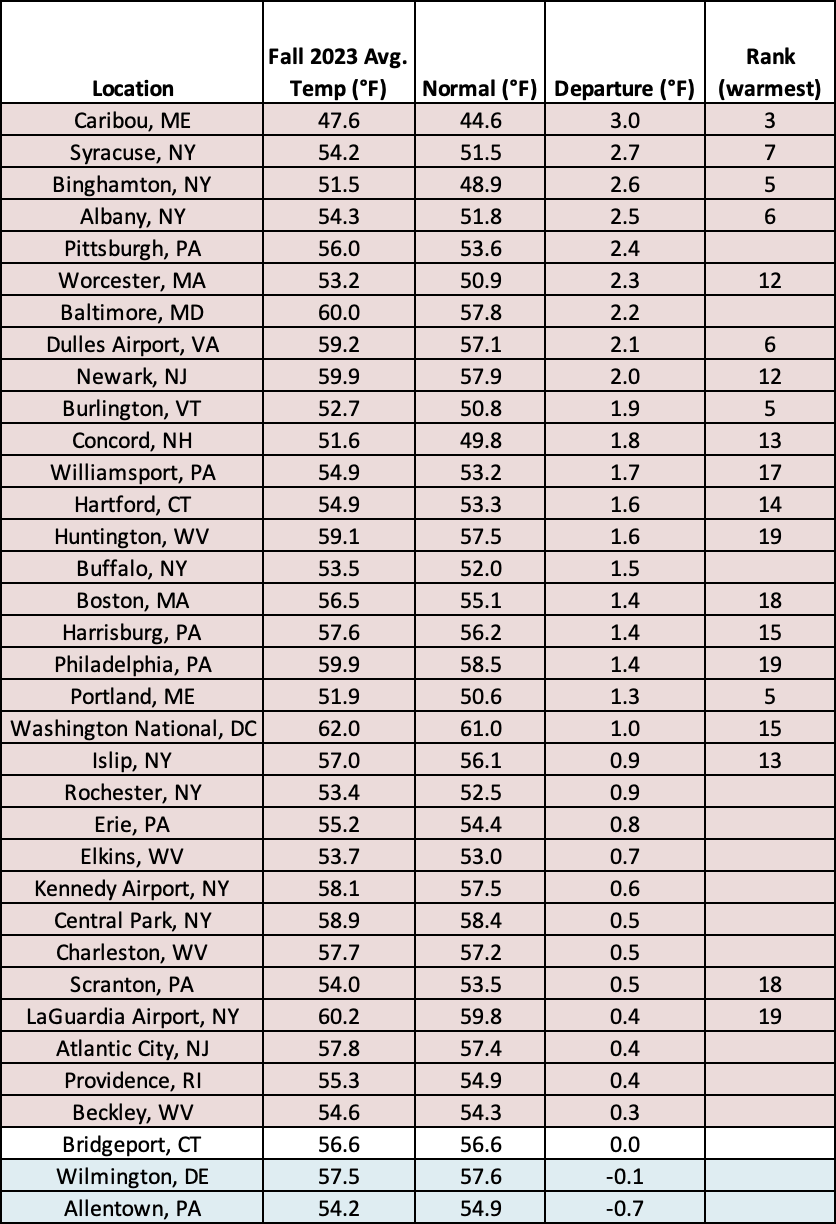
This fall ranked among the 20 warmest on record at 20 major climate sites.
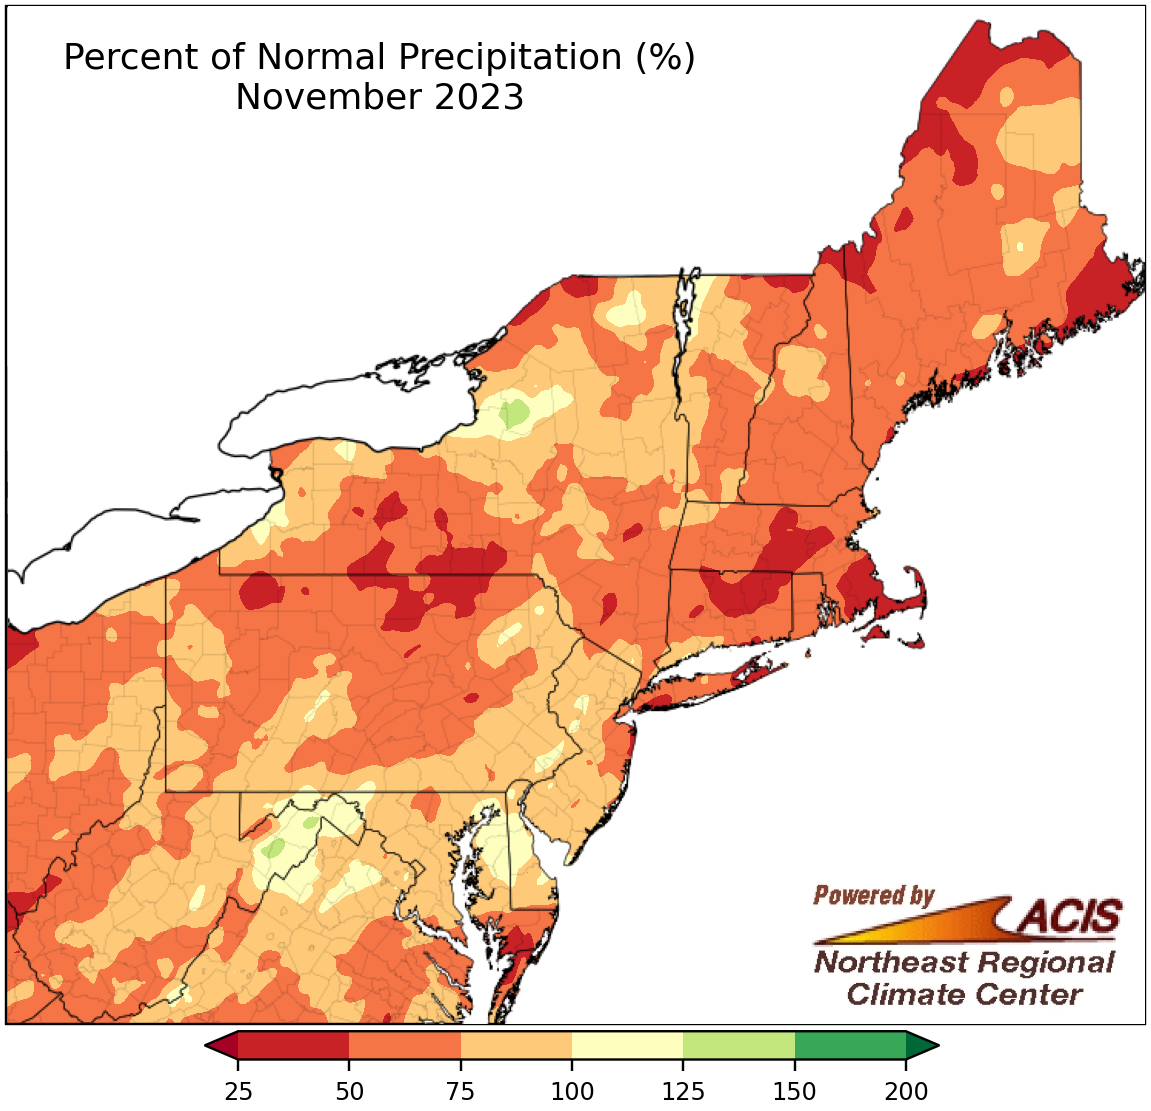
November precipitation ranged from 25% of normal to 150% of normal.
November was drier than normal for a majority of the Northeast, with the driest locations such as central New York and central Massachusetts seeing less than 50% of normal precipitation. However, a handful of locations like eastern West Virginia were wetter, seeing as much as 150% of normal precipitation. All but one of the 35 major climate sites saw below-normal November precipitation, with seven experiencing one of their 20 driest Novembers on record. November precipitation for all of the major climate sites ranged from 37% of normal in Worcester, MA, to 101% of normal in Wilmington, DE. The dry conditions allowed drought and abnormal dryness to persist or expand across the region during the month.
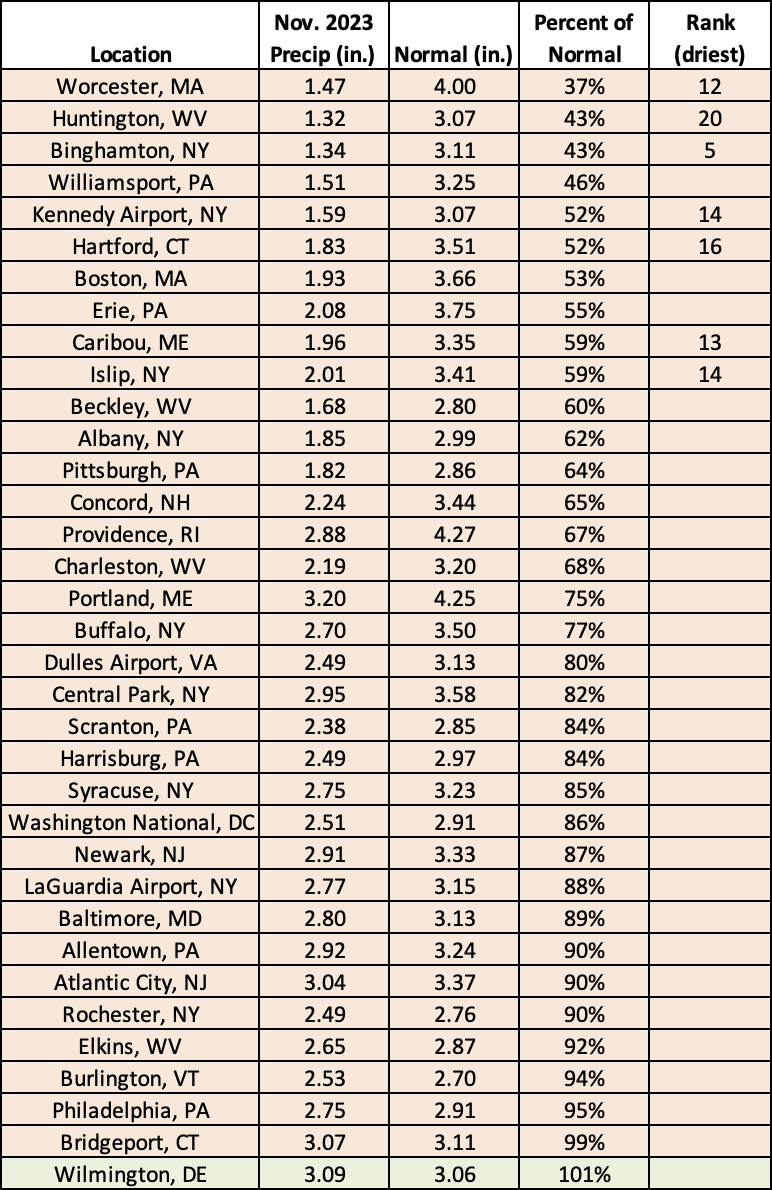
This November ranked among the 20 driest Novembers on record for seven major climate sites.
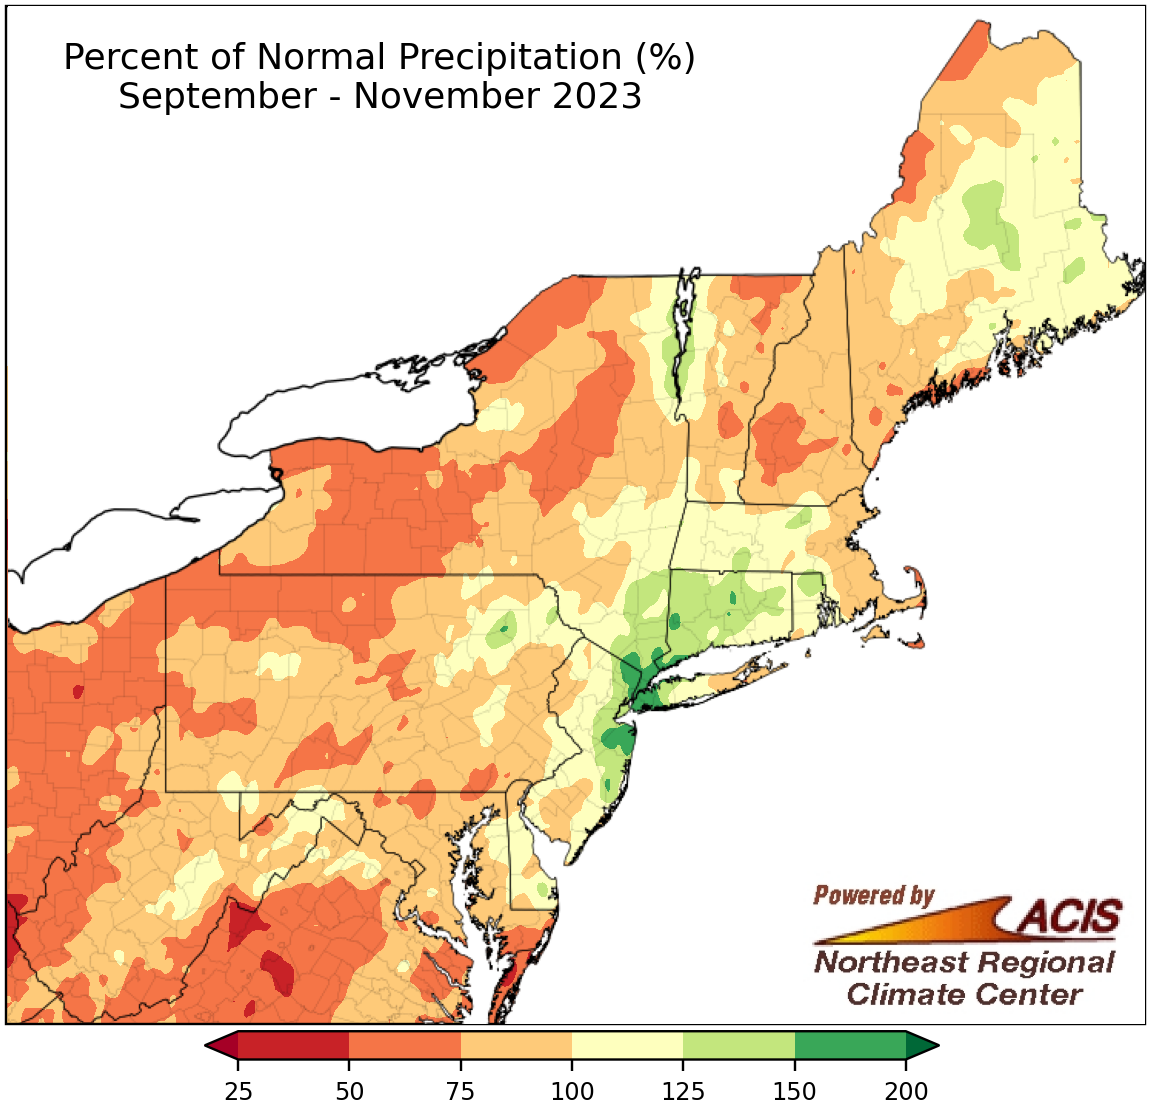
Fall precipitation ranged from 50% of normal to 200% of normal.
September featured precipitation extremes as interior locations were considerably dry and coastal locations were excessively wet. Meanwhile, in both October and November, large swaths of the region were drier than normal. This tilted fall to the dry side of normal for much of the Northeast, except where the extreme September precipitation won out. Overall, fall precipitation ranged from 50% of normal, particularly in interior areas from West Virginia to northern New York, up to 200% of normal in an area from coastal New Jersey to western Connecticut. At the 35 major climate sites, fall precipitation ranged from 51% of normal in Huntington, WV, to 182% of normal at LaGuardia Airport, NY, with 24 of the sites being drier than normal. Fall 2023 was record wet at LaGuardia and among the 20 wettest for another five sites but was Huntington’s eighth driest.
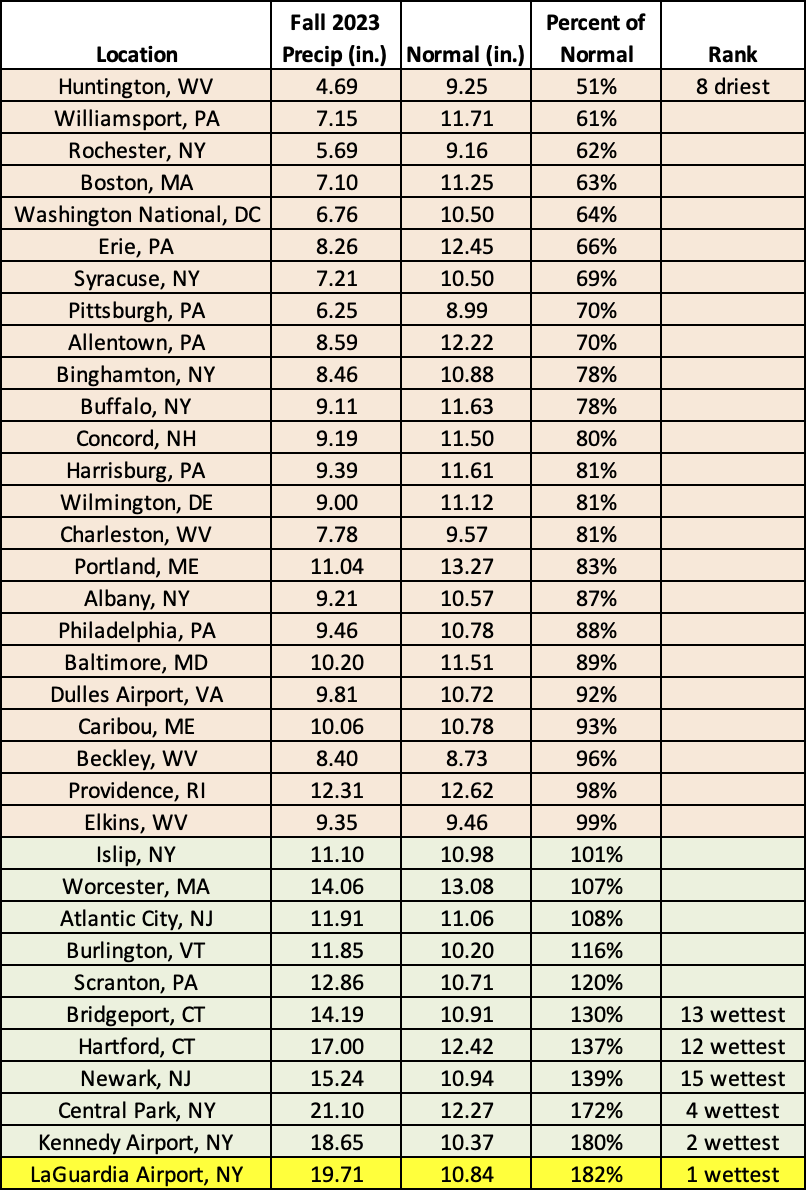
This fall was record wet for LaGuardia Airport, NY, and among the 20 wettest for another five major climate sites but ranked as the eighth driest for Huntington, WV.
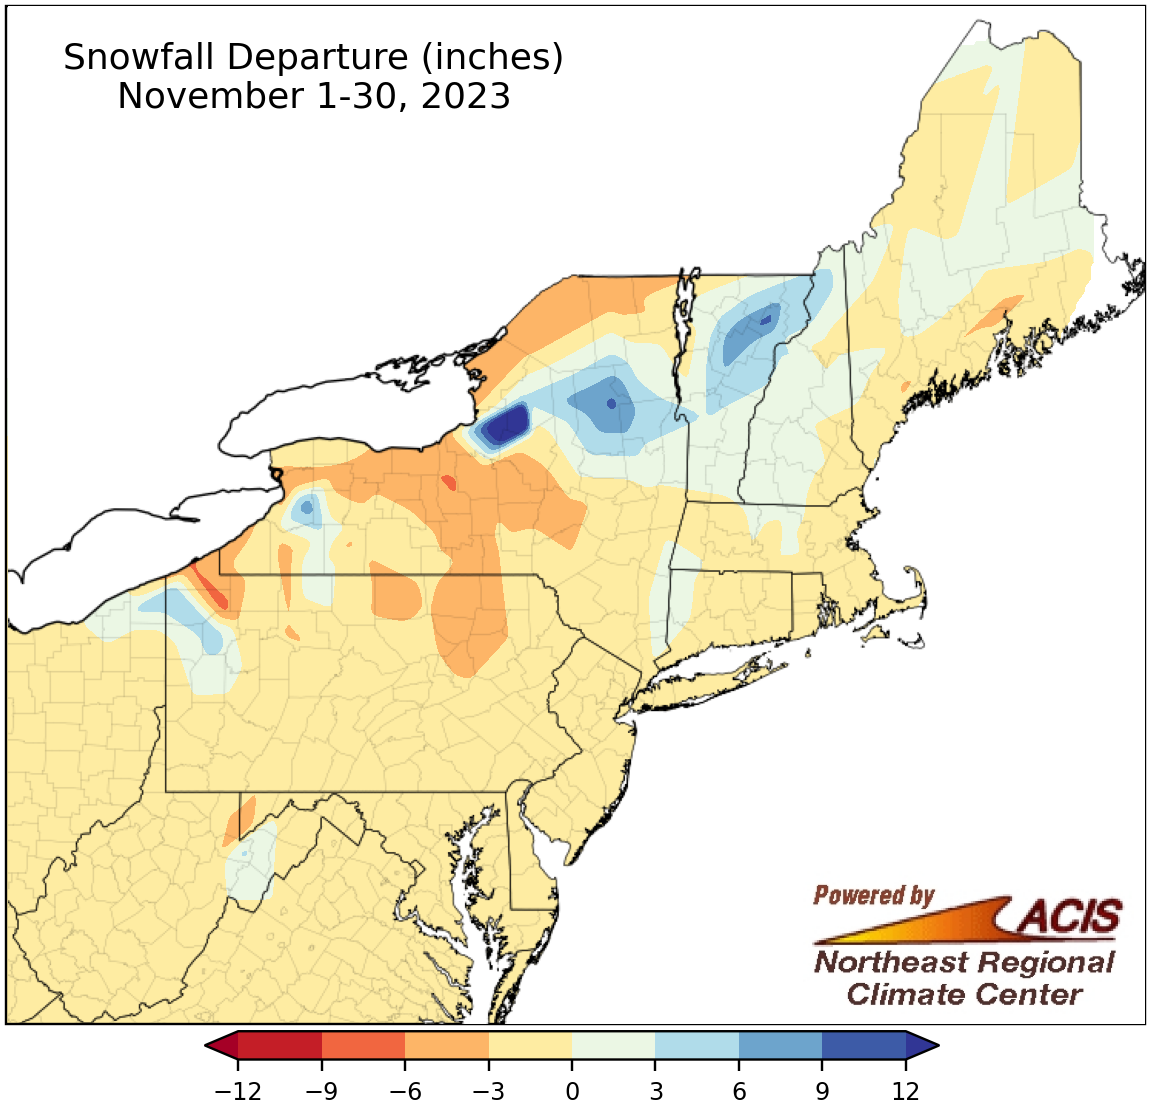
November snowfall generally ranged 6 inches below normal to more than 12 inches above normal.
During most Novembers, snowfall is generally limited. That was true for this November outside of a few areas, as much of the Northeast saw below- or near-normal snowfall. The snowiest spots were mostly in the lake-effect belts east of Lakes Erie and Ontario, as well as higher elevations of Vermont, all of which saw snowfall surpluses of over 6 inches. November snowfall at the 35 major climate sites ranged from 6.5 inches below normal in Erie, PA, to 1.4 inches above normal in Concord, NH, with 33 of the sites seeing below-normal snowfall and Binghamton, NY, having its 19th least snowiest November.
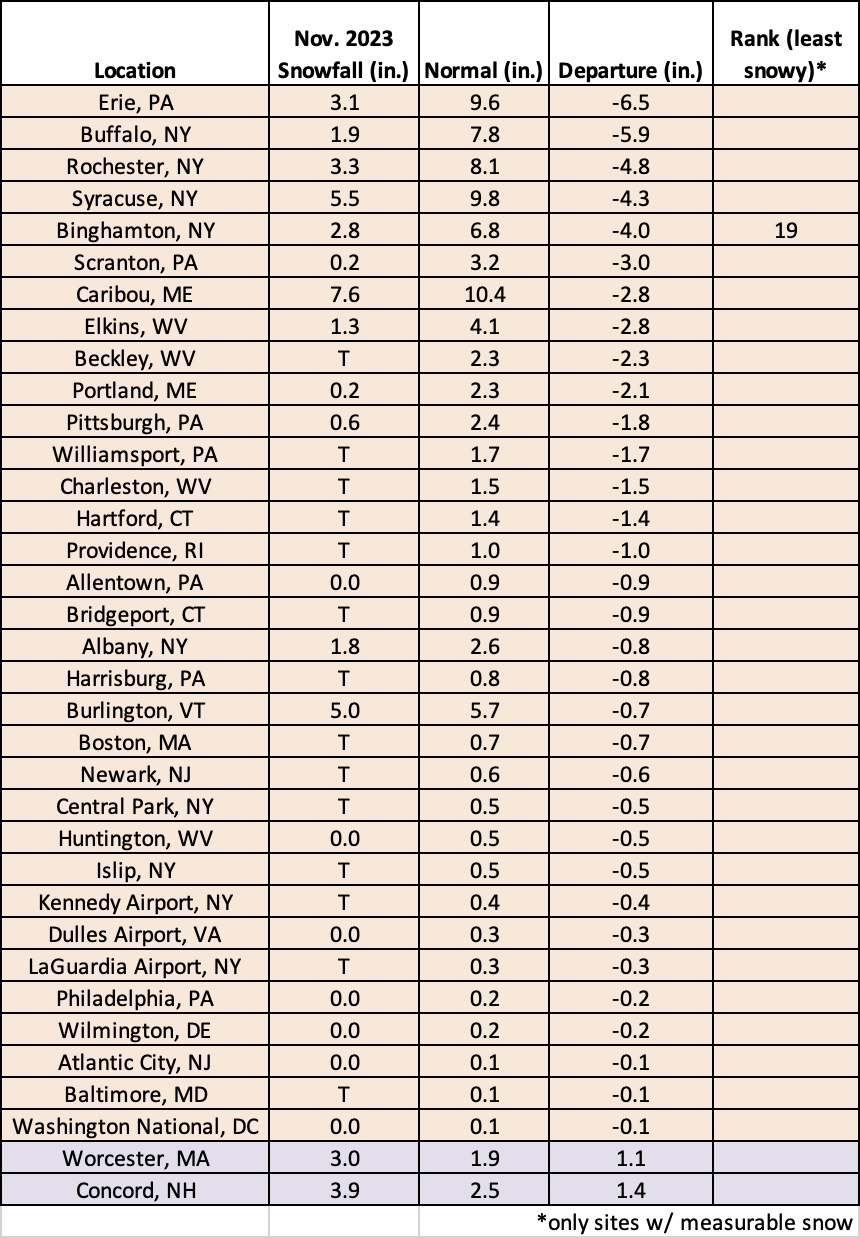
This November was the 19th least snowy in Binghamton, NY.
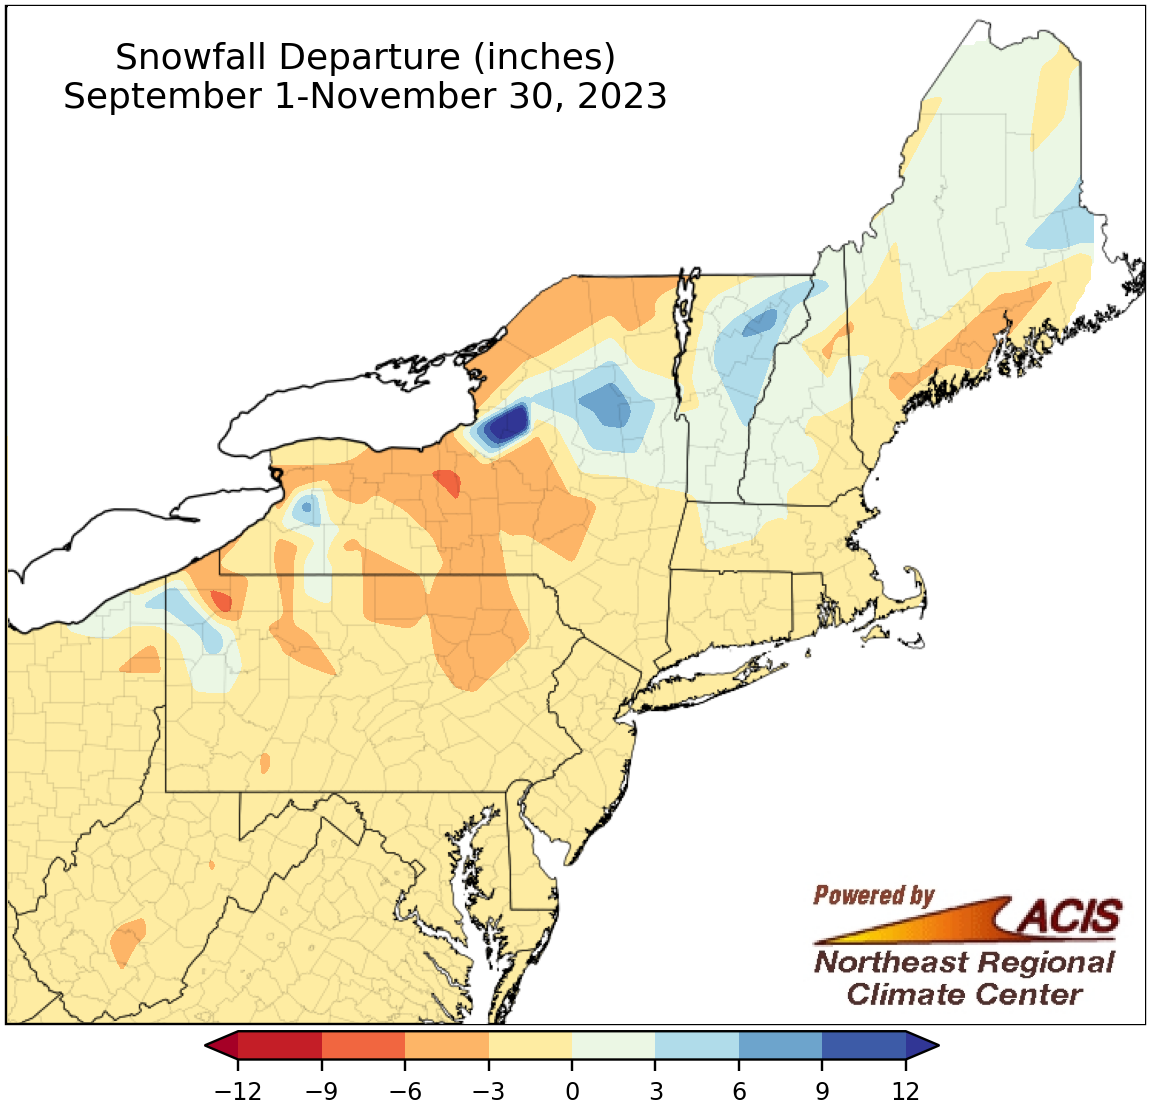
Fall snowfall also generally ranged 6 inches below normal to more than 12 inches above normal.
Since there was little snowfall during the other two months of fall, the season’s snowfall pattern was similar to that of November with a surplus of over 6 inches in some spots like lake-effect zones and northeastern Vermont and generally near- or below-normal snowfall elsewhere. Fall snowfall at the 35 major climate sites ranged from 6.4 inches below normal in Buffalo, NY, to 0.6 inches above normal in Concord, NH, with 33 of the sites seeing below-normal snowfall. This fall ranked among the 20 least snowy on record for two major climate sites.
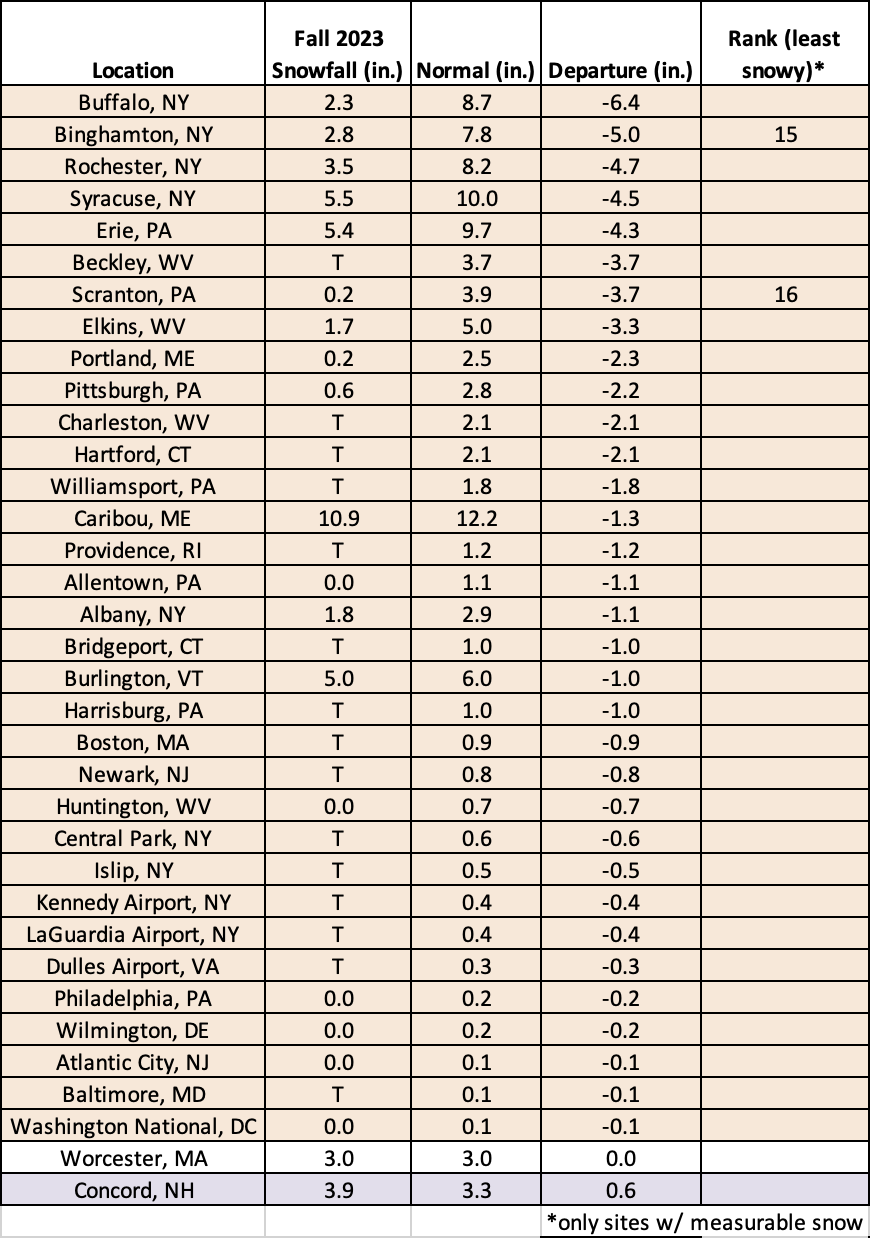
Fall 2023 ranked among the 20 least snowy on record for two major climate sites.
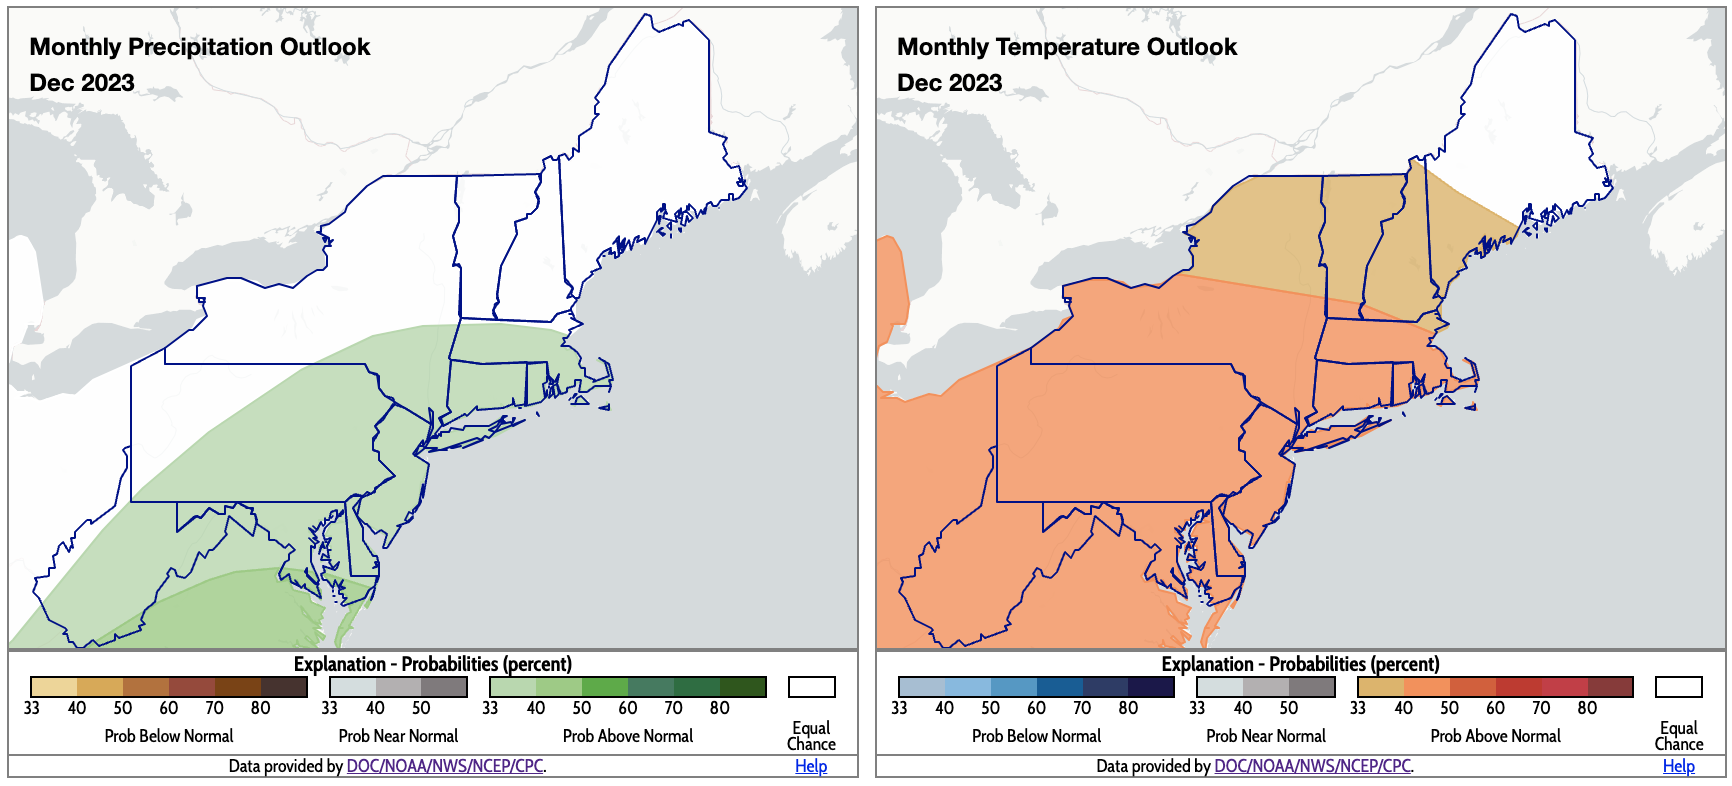
December is expected to be wetter than normal for some southern and coastal areas shaded green and warmer than normal for most of the Northeast, shaded orange. Click to enlarge.
According to NOAA’s Climate Prediction Center, there’s an increased likelihood of above-normal precipitation in December for an area stretching from West Virginia across much of the Mid-Atlantic into southeastern New York and southern New England. Equal chances of below-, near-, or above-normal precipitation were forecast elsewhere in the region. Above-normal temperatures are favored for December for the Northeast except in a chunk of Maine where equal chances were predicted.