Broken Records
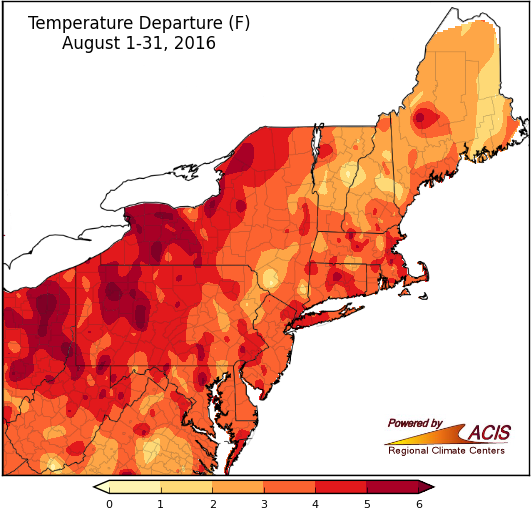
August was warmer than normal for the entire region.
Average temperatures for August ranged from 1°F to more than 6°F above normal, with most of the region 2°F to 6°F above normal. Fifteen of the region’s 35 major climate sites had a record warm August, while the other twenty sites ranked this August among their top ten warmest. Average temperatures at the major sites ranged from 3°F above normal in Caribou, ME to 6.6°F above normal in Rochester, NY. Not only was there a record number of 90°F days at some of these sites, 86 warm low temperature records were also set or tied.
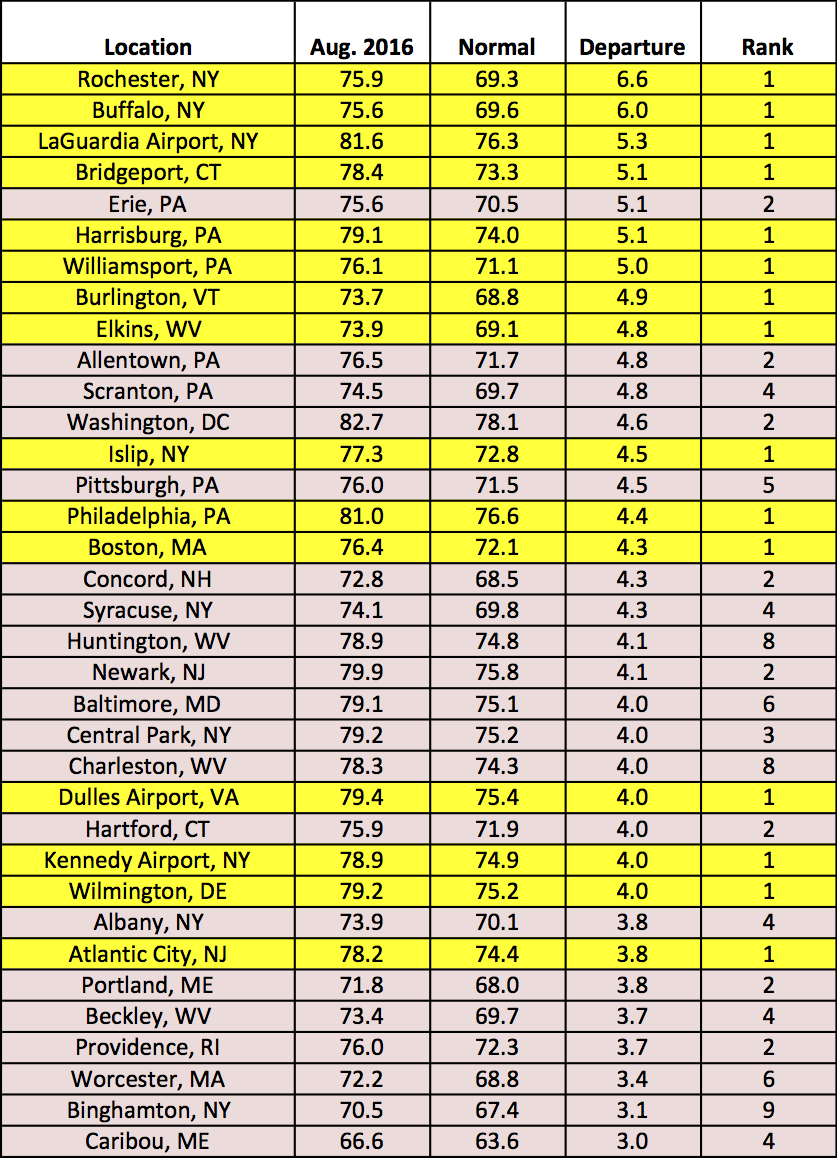
All 35 stations ranked this August among their top ten warmest, with fifteen being record warm.
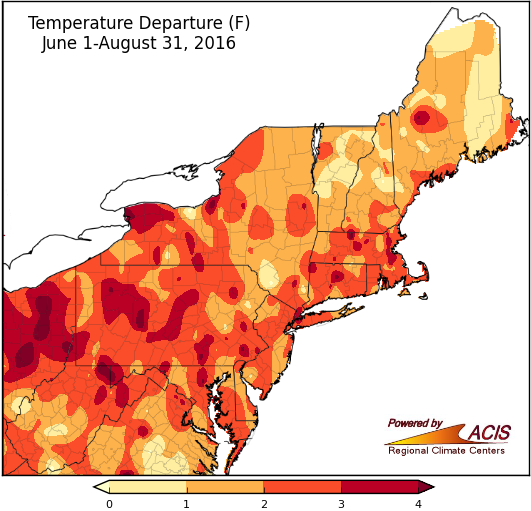
Summer also wrapped up on the warm side of normal.
For the summer season, average temperatures ranged from near normal to more than 4°F above normal, with most areas 1°F to 3°F above normal. Williamsport, PA and Bridgeport, CT had record warm summers, while the other 33 sites ranked this summer among their top fifteen warmest. Average temperatures ranged from 1.6°F above normal in Caribou, ME to 3.9°F above normal in Rochester, NY.
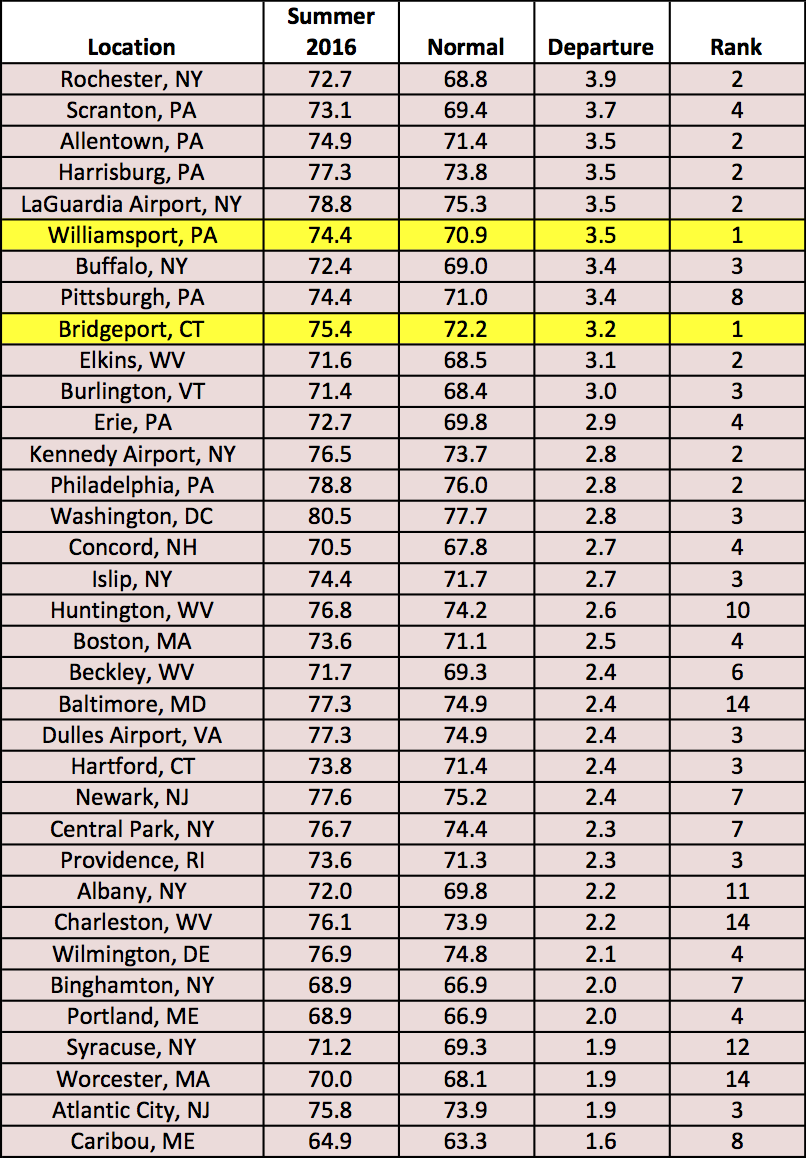
All 35 stations ranked this August among their top fifteen warmest, with two being record warm.
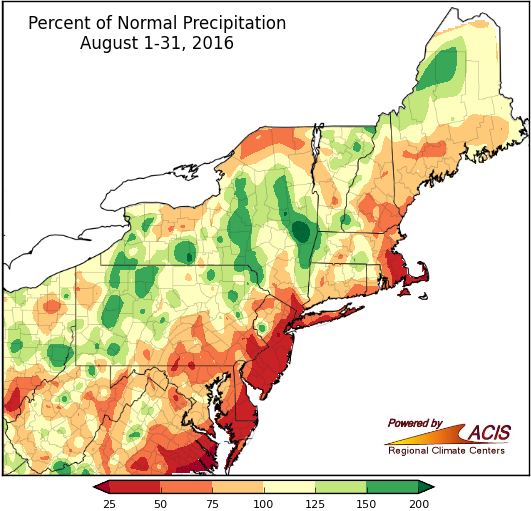
Precipitation was variable during August.
August precipitation ranged from 25% to more than 200% of normal. The driest spots stretched up the coast from southeastern Maryland to the New York City area, as well as southeastern Massachusetts. The wettest area was around the Capital Region of New York. Of the 35 major climate sites, 22 had a drier-than-normal August. Nine of those sites ranked this August among their top 20 driest. Conversely, of the thirteen wetter-than-normal sites, three had a top fifteen wet August.
Drought conditions persisted through summer for parts of the region. For more information, go to the Northeast Drought Update or view the August webinar.
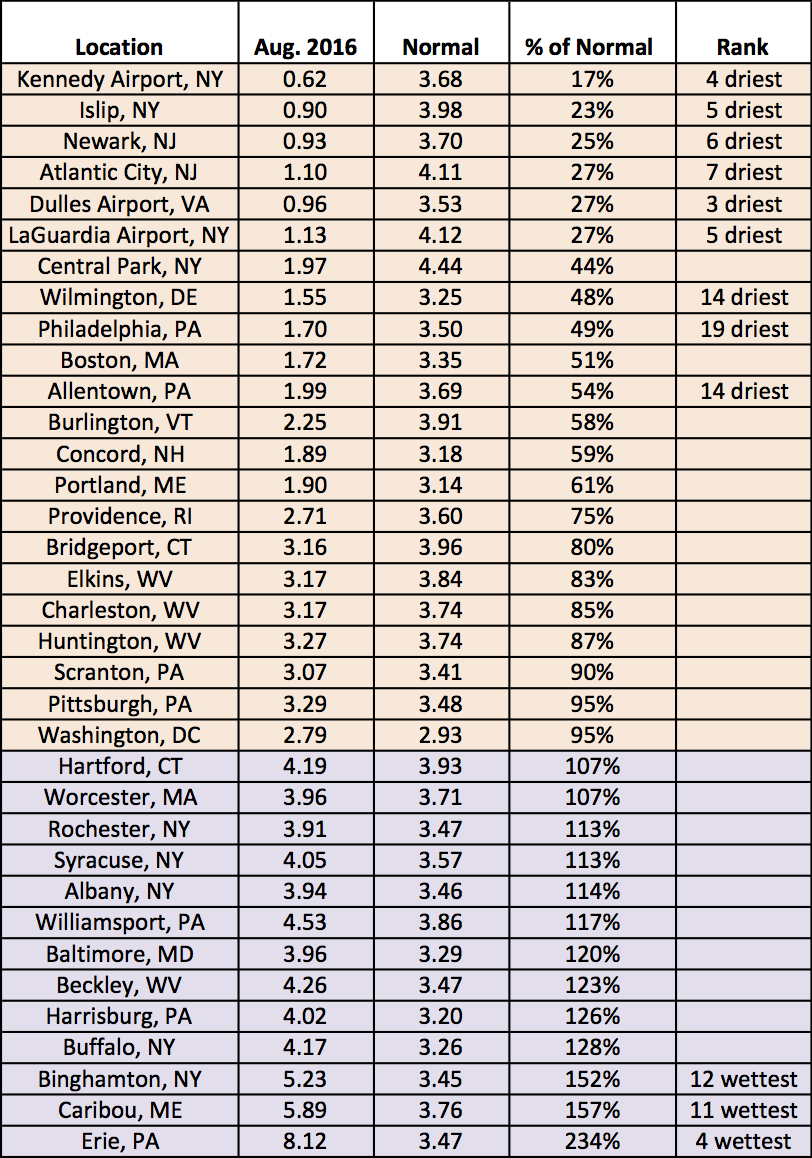
August precipitation ranged from 17% of normal at Kennedy Airport, NY to 234% of normal in Erie, PA.
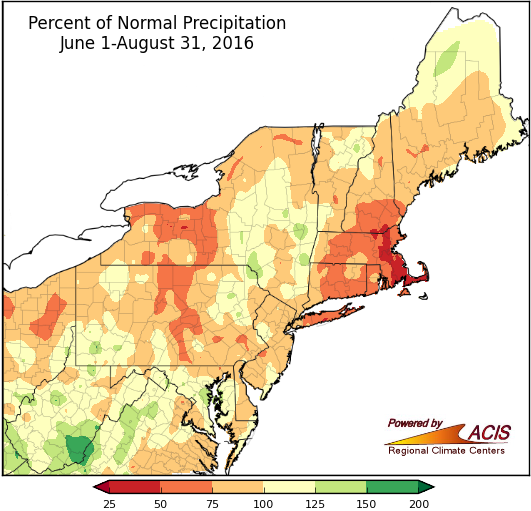
Summer precipitation was 125% of normal or less for most of the Northeast.
Precipitation during summer ranged from 25% to 200% of normal. The driest area was southeastern Massachusetts, while the wettest area was southeastern West Virginia. Twenty-six sites were drier than normal during summer. In fact, Boston, MA had its driest summer on record, and another eight sites ranked it among their top twenty driest summers. Of the eight wetter-than-normal sites, four ranked this summer among their top 15 wettest.
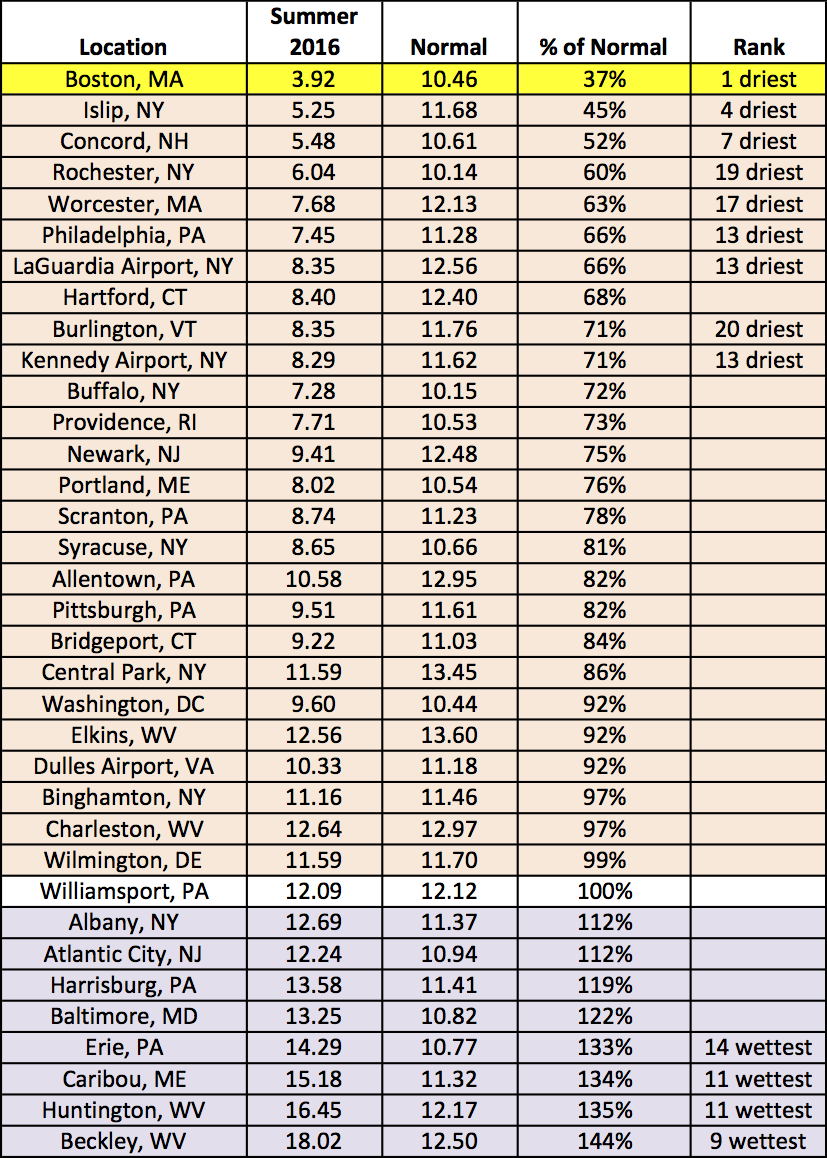
Summer precipitation ranged from 37% of normal at Boston, MA (record dry) to 144% of normal in Beckley, WV.