Into The Record Books
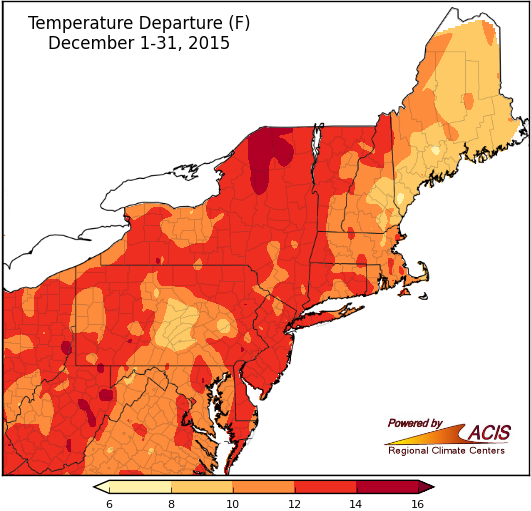
December average temperatures were 8°F to 16°F above normal.
December was an extremely mild month for the entire Northeast. Average temperatures ranged from 8°F above normal in parts of northern New England and central Pennsylvania to 16°F above normal in parts of West Virginia and northern New York. This December will likely rank as one of the warmest, if not the warmest, on record for the individual states and the region. All but one of the 35 major airport climate sites had a record warm December.
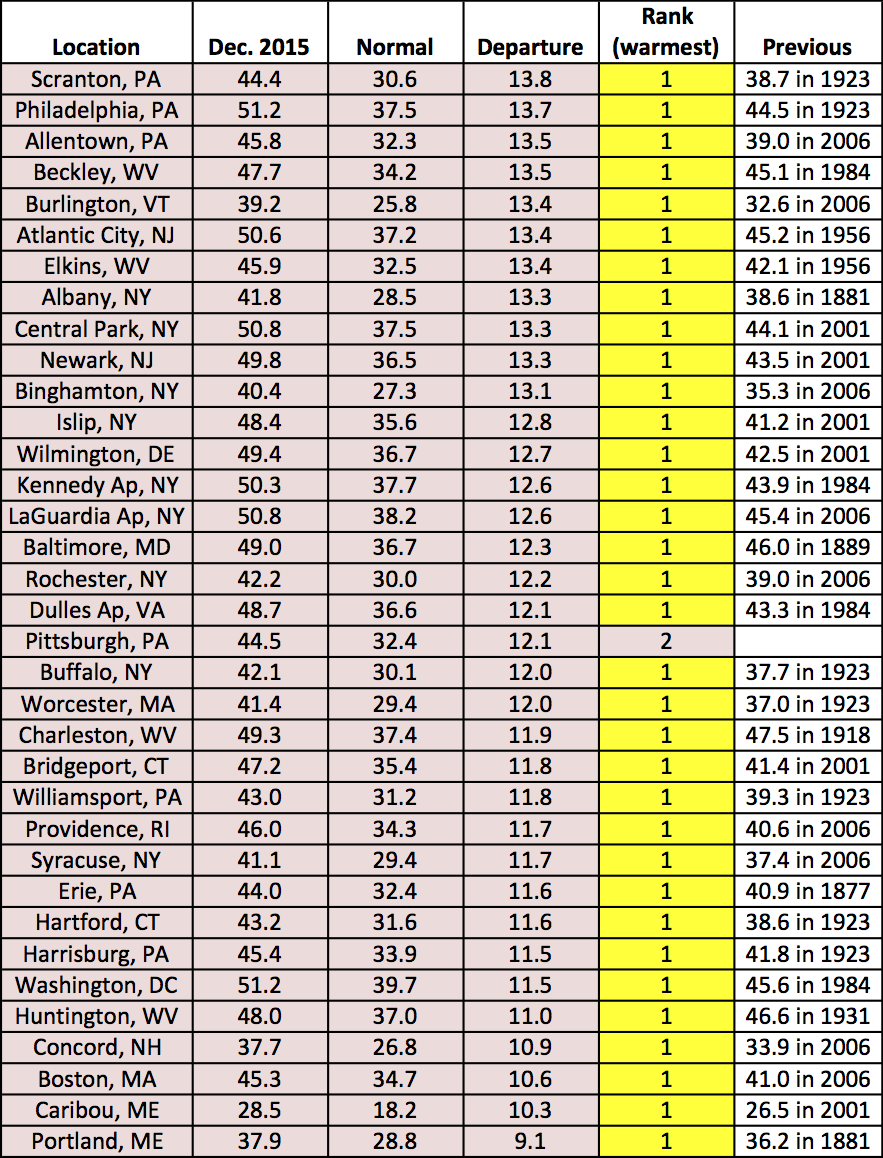
Many sites smashed their old records for warmest December by 3°F to 7°F.
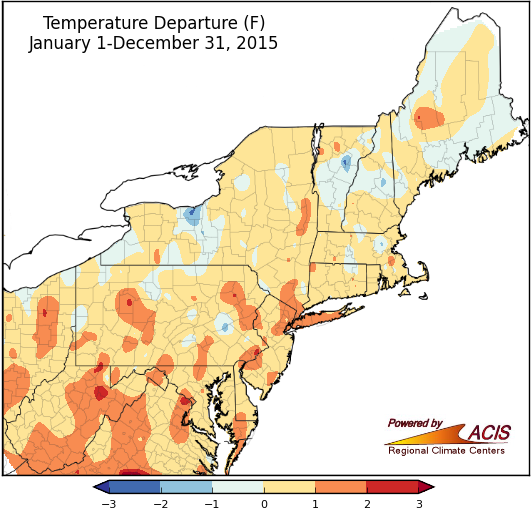
2015 average temperatures were within 1°F of normal for a large portion of the region.
While the year started with a brutally cold February, mild temperatures dominated May, September, November, and December. Average temperatures for 2015 generally ranged from 1°F below normal to 2°F above normal. Of the 35 airport climate sites, 34 were warmer than normal for the year.
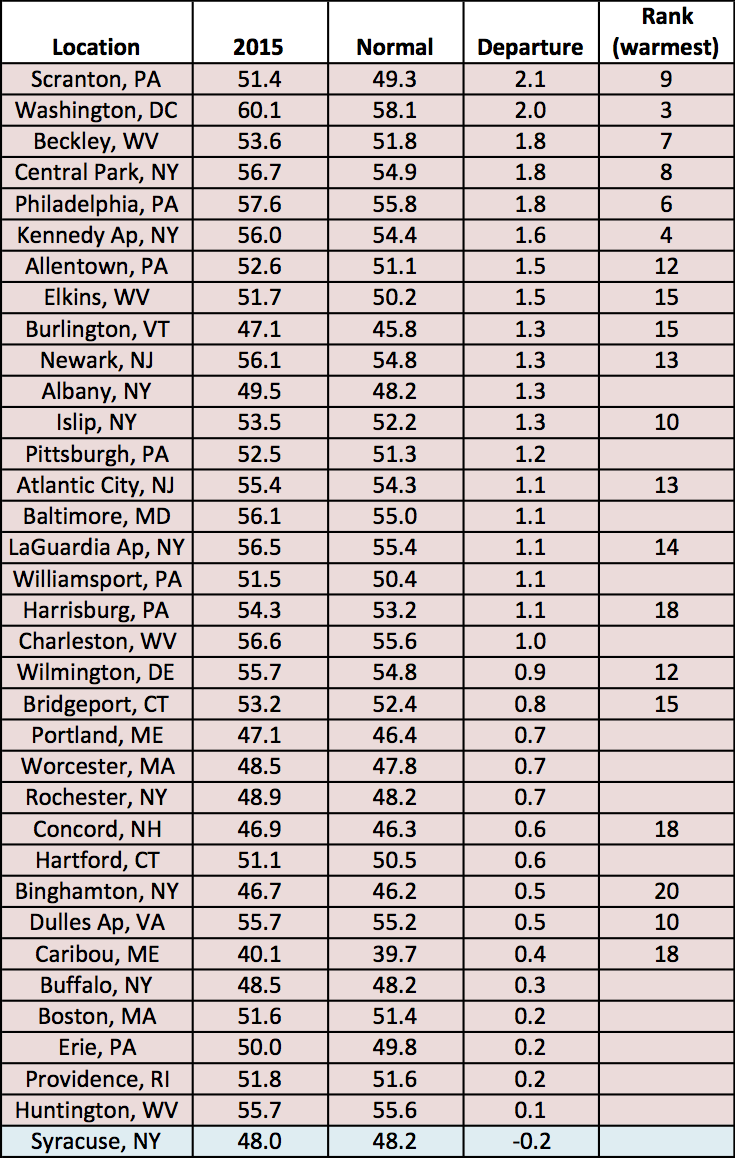
Twenty sites ranked 2015 among their top 20 warmest years on record.
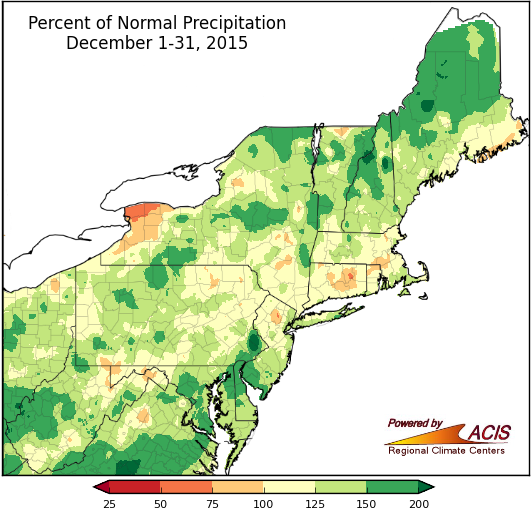
December was wetter than normal in most areas.
December precipitation ranged from 100% to 200% of normal for a majority of the Northeast. Western New York was a little drier, with Buffalo being one of two airport climate sites to see below-normal precipitation.
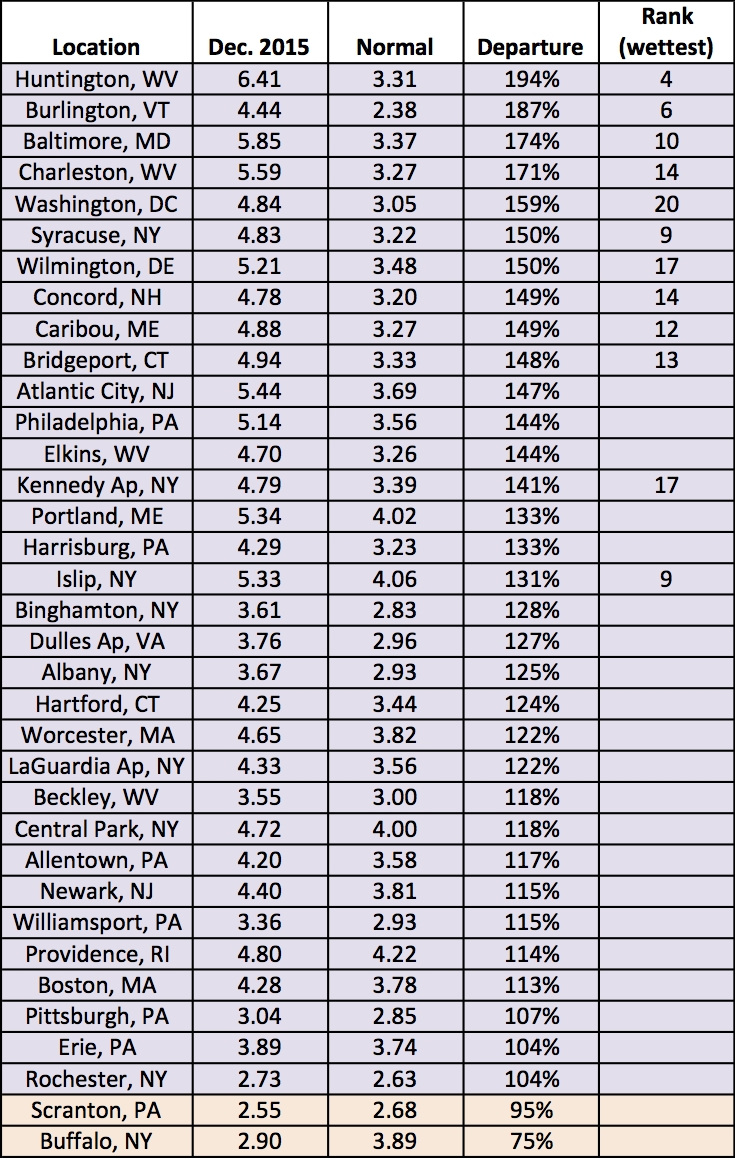
Twelve sites ranked the month among their top 20 wettest.
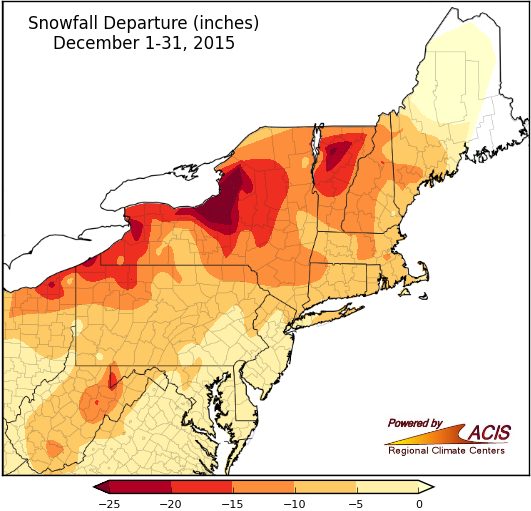
Snowfall in lake-effect areas and higher elevations was more than a foot below normal.
Despite plenty of precipitation, mild temperatures kept snow totals down across the region. Departures ranged from a few inches below normal to more than two feet below normal. Fourteen airport climate sites didn’t see measurable snow during the month.
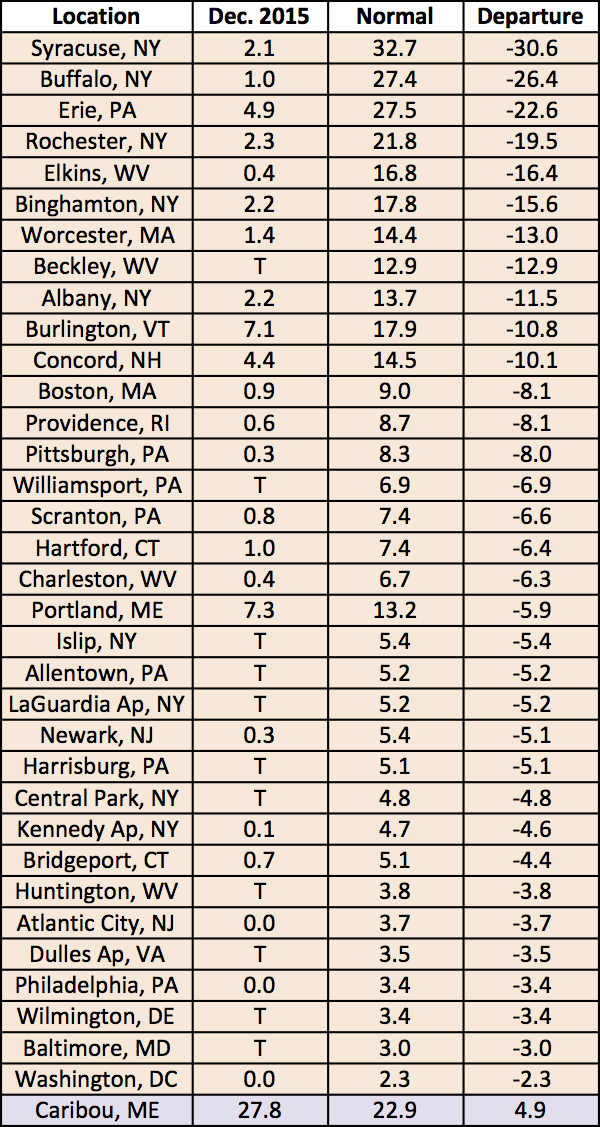
Caribou, ME was the only airport climate site to see above-normal snowfall in December.
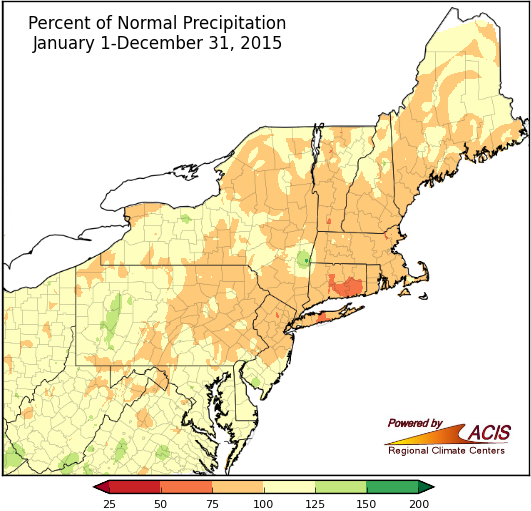
The majority of the Northeast saw 75% to 125% of normal precipitation for 2015.
2015 featured a notably dry May, a soggy June, and lingering areas of abnormal dryness and moderate drought. For the year, precipitation ranged from 50% of normal in central Connecticut and central Long Island to 150% of normal in western Pennsylvania and southern West Virginia. The year was drier than normal at 20 airport climate sites and wetter than normal at 15 sites.
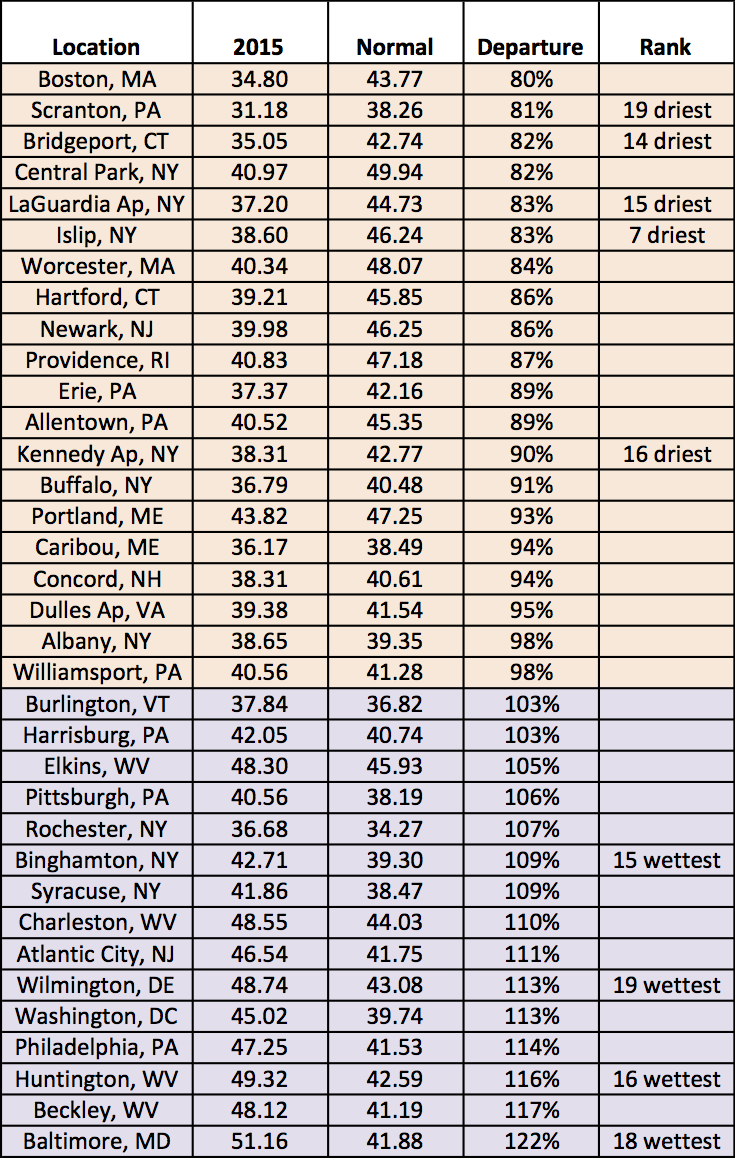
A few sites ranked the year among their top 20 driest or wettest.