Mid-January - A Lot of Warmth and Little Snow
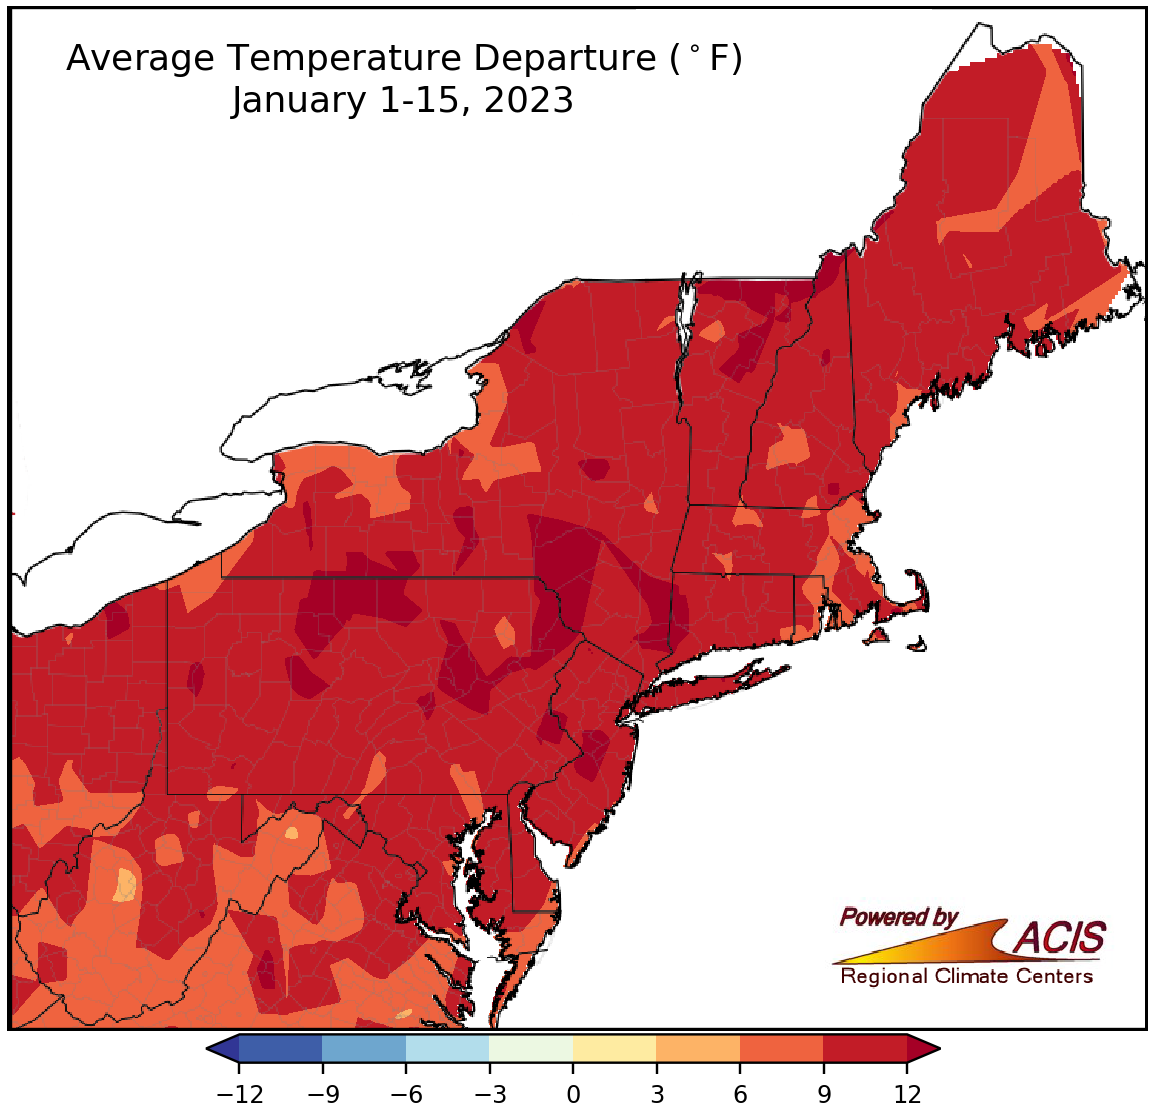
January 1-15 average temperatures ranged 6°F to 12°F above normal for the Northeast.
The first half of January was well above normal for the Northeast, with average temperatures ranging from 6°F to 12°F warmer than normal. This January 1-15 period ranked among the 20 warmest on record at all 35 major climate sites, with average temperatures ranging from 6.3°F above normal in Erie, PA, to 12.0°F above normal in Newark, NJ.
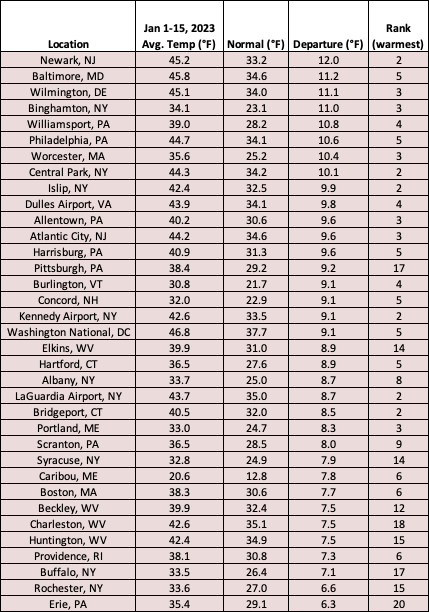
This January 1-15 period ranked among the 20 warmest on record at all 35 major climate sites.
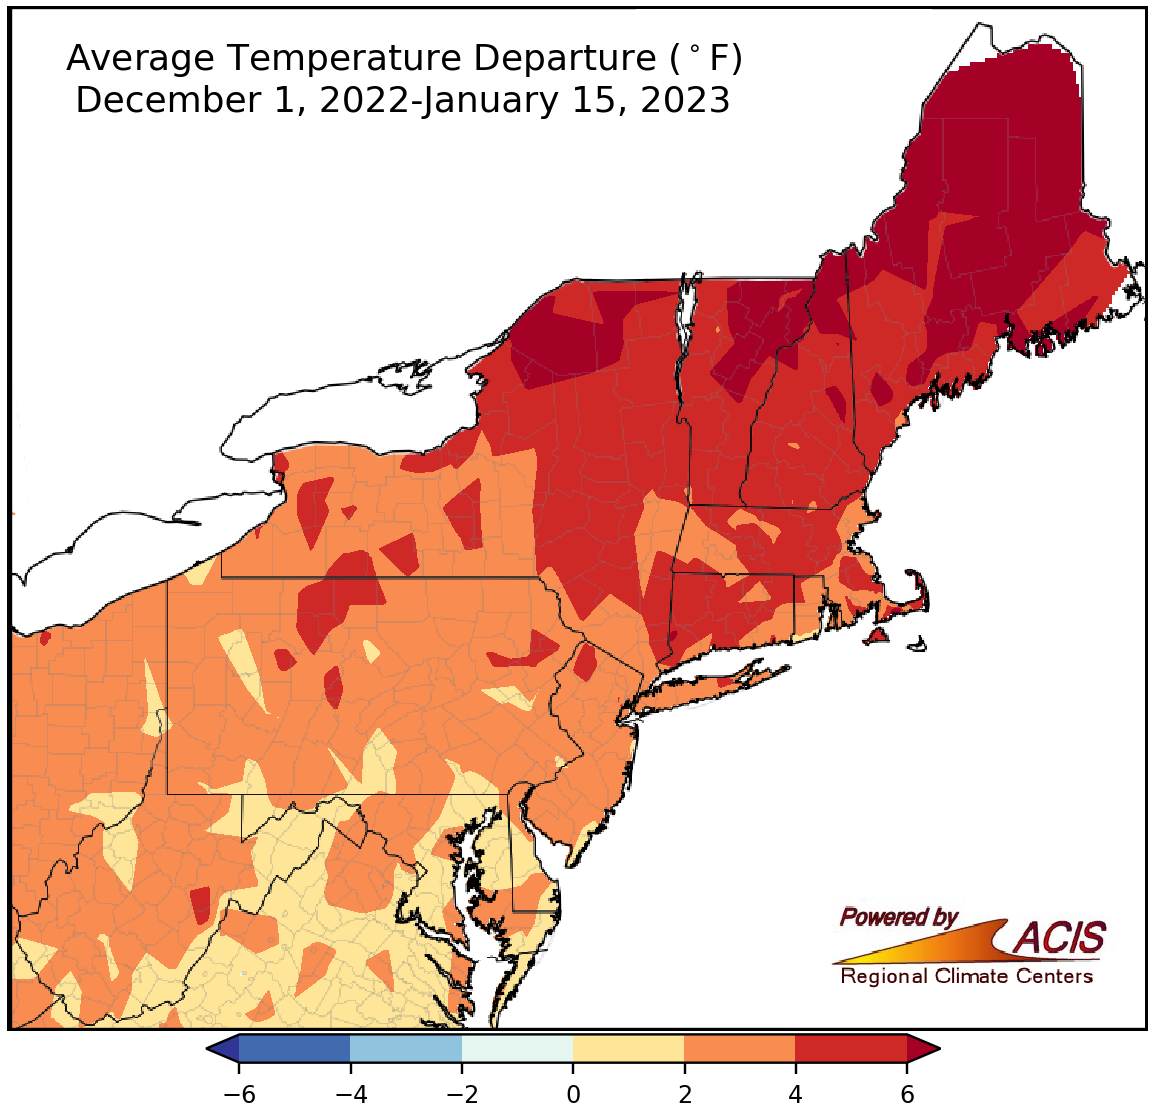
December 1-January 15 average temperatures ranged near normal to more than 6°F above normal.
The first half of winter was also warmer than normal for the entire Northeast, with average temperatures ranging from near normal in southern parts of the region to more than 6°F above normal in parts of northern New England and northern New York. December 1-January 15 average temperatures at the 35 major climate sites ranged from 1.5°F above normal in Erie, PA, to 6.8°F above normal in Caribou, ME, with 27 of the sites experiencing one of their 20 warmest first halves of winter on record.
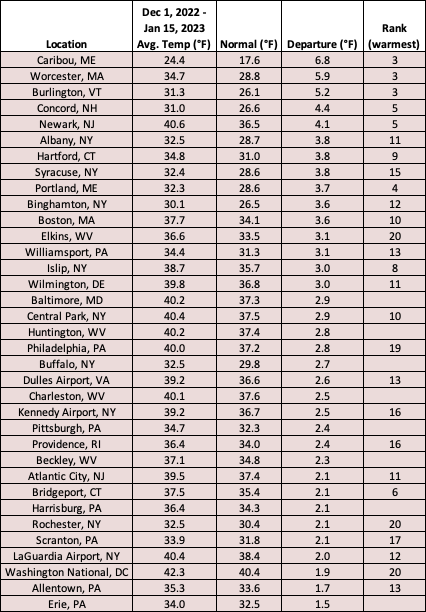
This December 1-January 15 period ranked among the 20 warmest on record at 27 major climate sites.
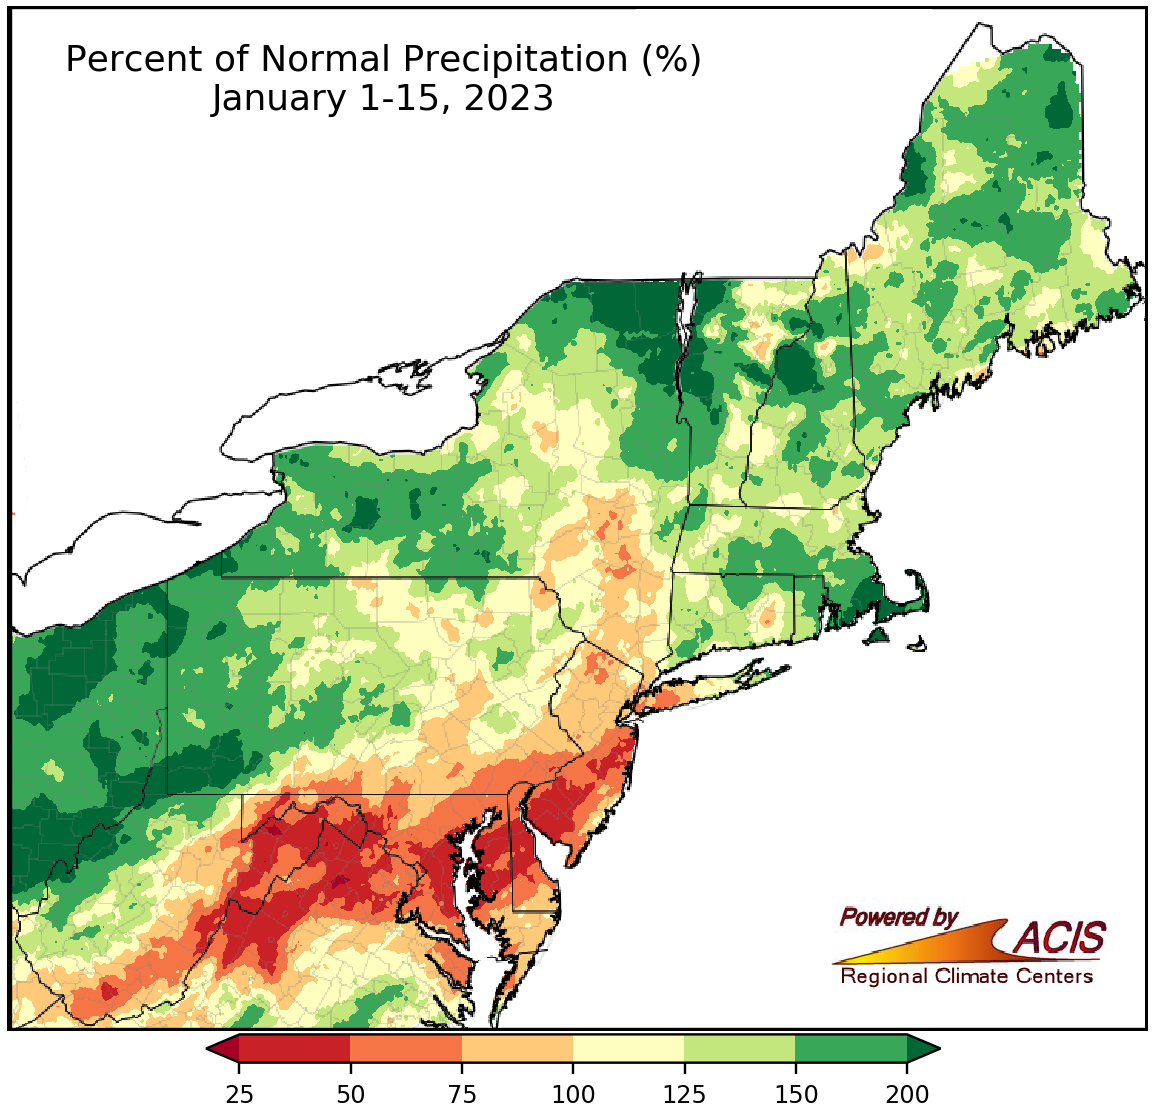
January 1-15 precipitation ranged from 25% of normal to more than 200% of normal.
Precipitation during the first half of January ranged from 25% of normal in areas such as eastern West Virginia, southern/eastern Maryland, central Delaware, and southern New Jersey to more than 200% of normal in areas such as northern West Virginia, western Pennsylvania, northern New York, and Cape Cod, MA. January 1-15 precipitation at the 35 major climate sites ranged from 23% of normal in Baltimore, MD, to 189% of normal in Caribou, ME. Sixteen major climate sites were drier than normal, with eight ranking this first half of January among their 20 driest. On the other hand, nineteen major climate sites were wetter than normal, with six ranking this first half of January among their 20 wettest.
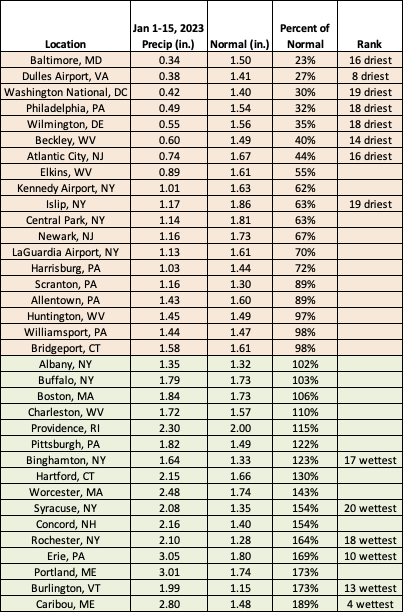
This January 1-15 period was among the 20 driest on record for eight major climate sites but among the 20 wettest for six major climate sites.
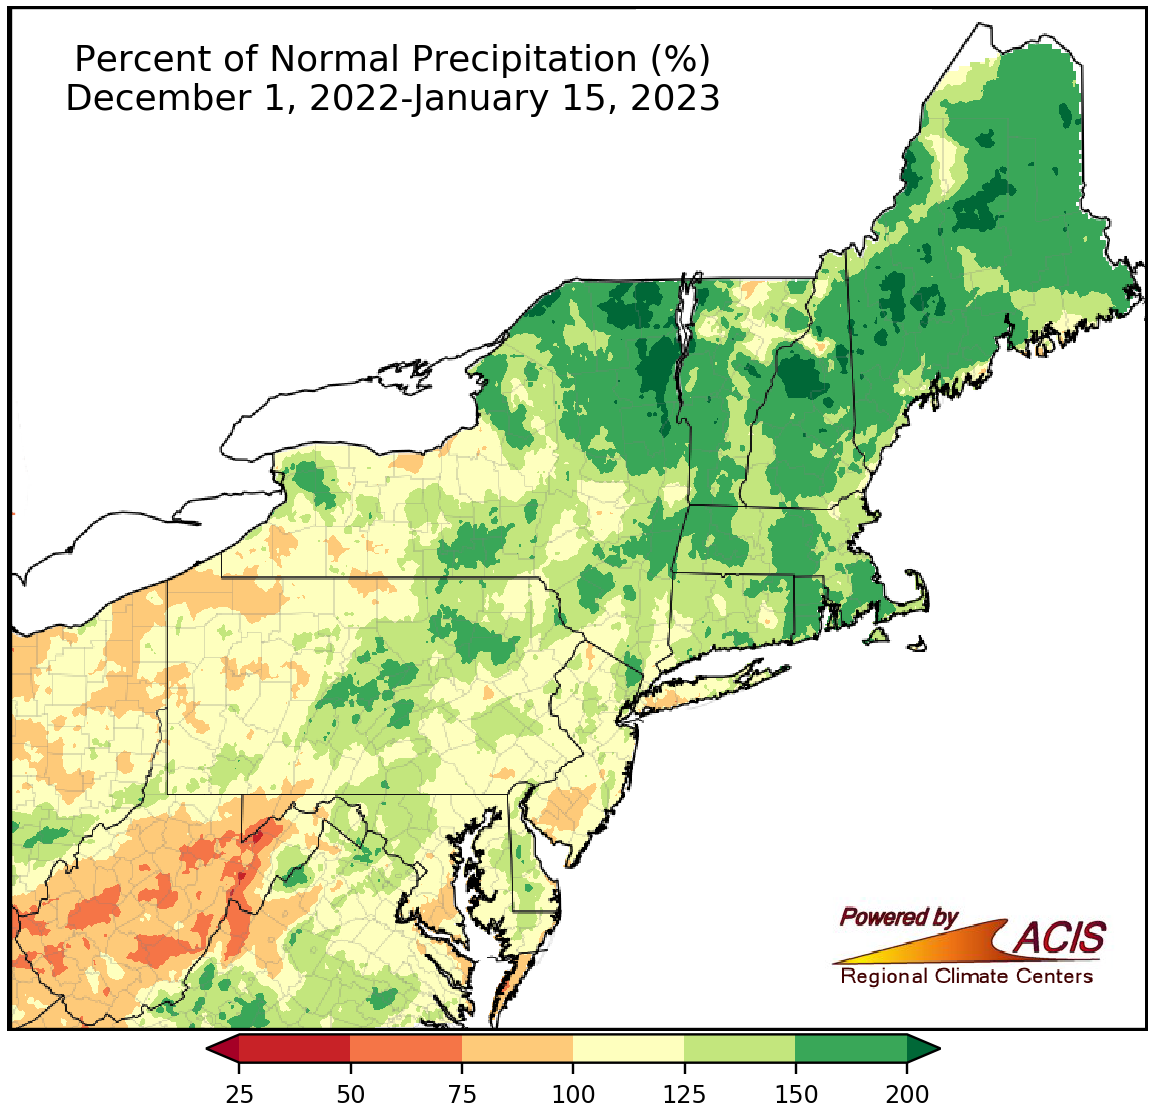
December 1-January 15 precipitation ranged from 50% of normal to more than 200% of normal.
Precipitation during the first half of winter ranged from 50% of normal in parts of West Virginia to more than 200% of normal in northern New York, central New Hampshire, and parts of Maine. December 1-January 15 precipitation at the 35 major climate sites ranged from 58% of normal in Charleston, WV, to 153%of normal in Buffalo, NY, with 21 major climate sites being wetter than normal. This first half of winter ranked among the 20 driest on record for two major climate sites but among the 20 wettest for seven major climate sites.
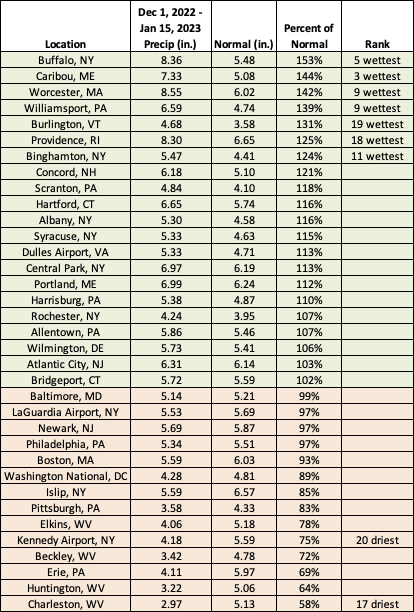
This first half of winter was among the 20 driest for two major climate sites but among the 20 wettest for seven major climate sites.
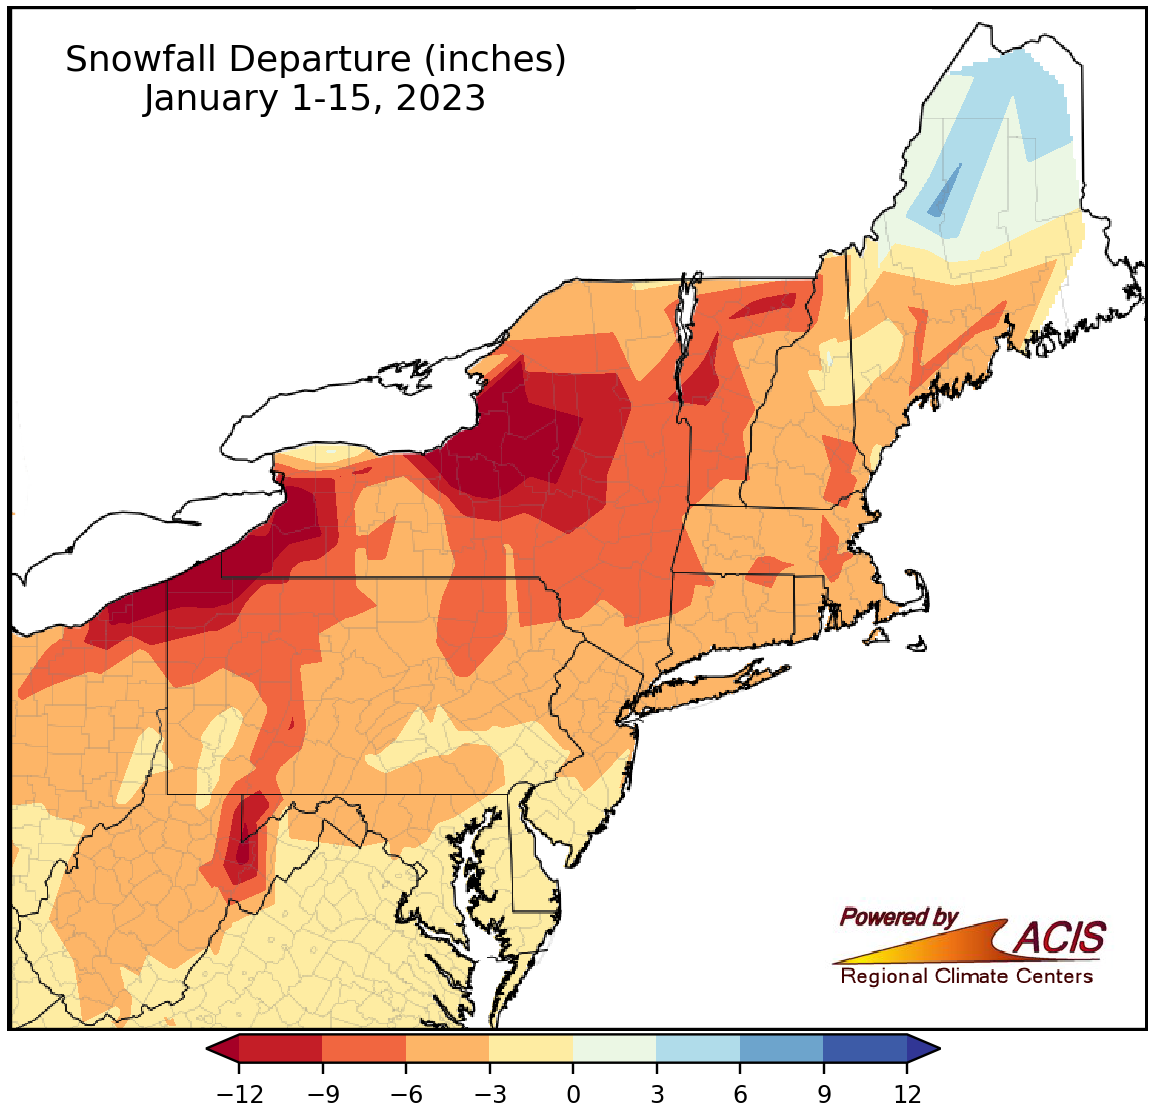
January 1-15 snowfall ranged from more than 12 inches below normal to near normal for most of the Northeast.
The first half of January featured below-normal snowfall for almost the entire Northeast. The greatest deficits of over 12 inches were in lake-effect areas near Lakes Ontario and Erie in New York and Pennsylvania. The main exception was northern Maine which had a snowfall surplus of up to 6 inches. At the 35 major climate sites, January 1-15 snowfall ranged from 16.0 inches below normal in Syracuse, NY, to 5.5 inches above normal in Caribou, ME, the lone snowier-than-normal site. This first half of January ranked among the 20 least snowy on record for eight major climate sites but as Caribou’s 19th snowiest. Several major climate sites including Central Park, NY; Baltimore, MD; and Philadelphia, PA, have yet to see their first measurable snowfall, making it one of their 10 latest first snowfalls on record.
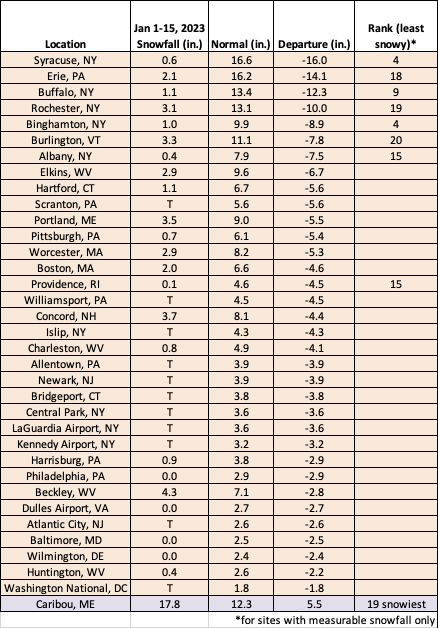
This January 1-15 period was among the 20 least snowy for eight major climate sites but was Caribou’s 19th snowiest.
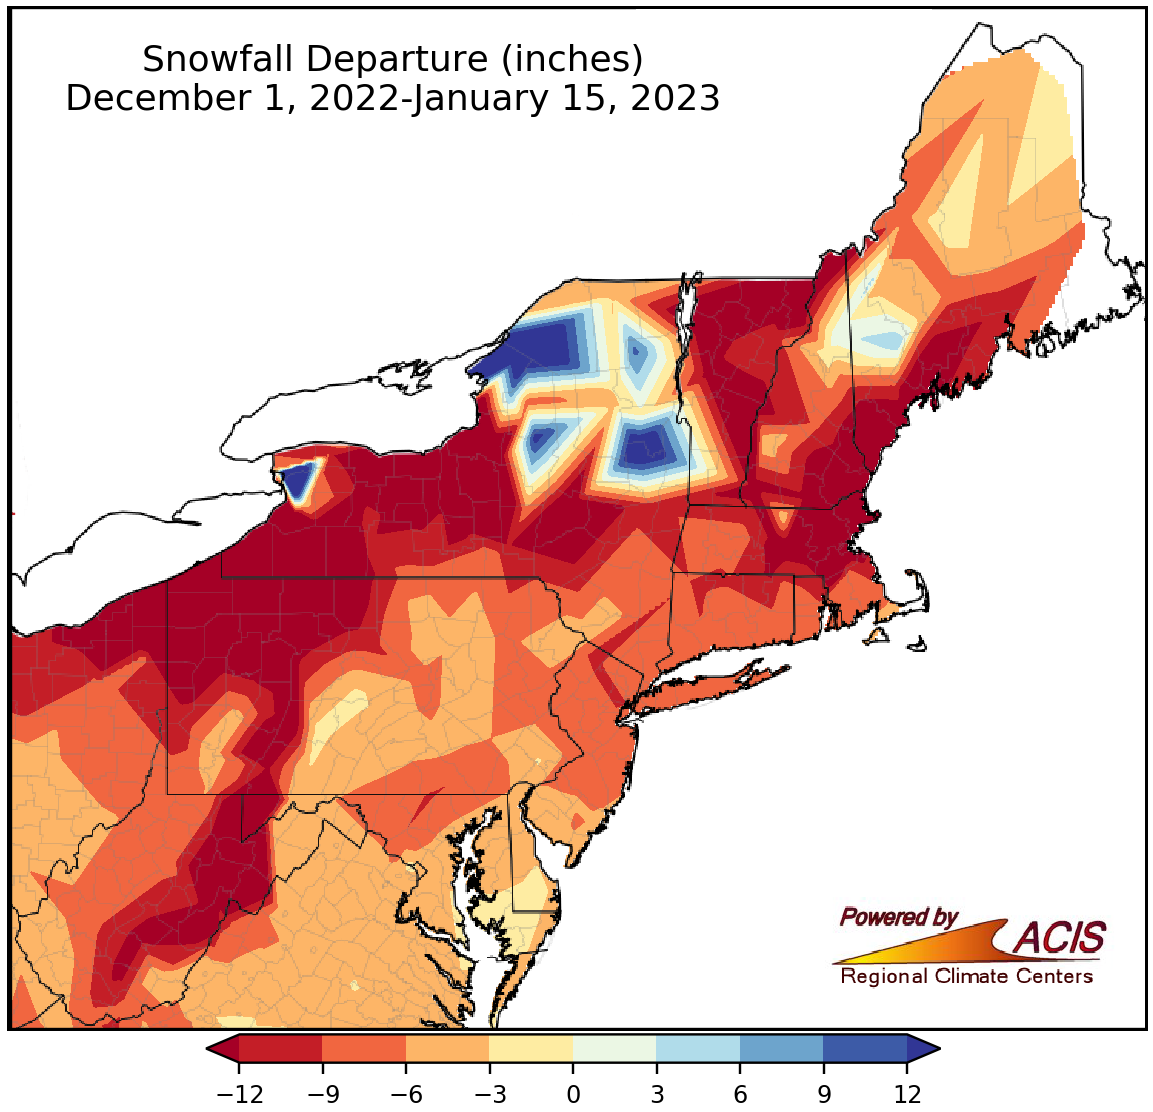
December 1-January 15 snowfall ranged from more than 12 inches below normal to more than 12 inches above normal.
A majority of the Northeast also saw below- or near-normal snowfall during the first half fo winter, with the largest deficits exceeding 12 inches in multiple parts of the region. However, localized parts of New York saw a surplus of over 12 inches due to a significant lake-effect event in late December. December 1-January 15 snowfall at the 35 major climate sites ranged from 33.9 inches below normal in Erie, PA, to 27.1 inches above normal in Buffalo, NY. Overall, 33 of the sites saw below-normal snowfall with the period ranking among the 20 least snowy on record for 17 sites. However, Buffalo experienced its eighth snowiest first half of winter.
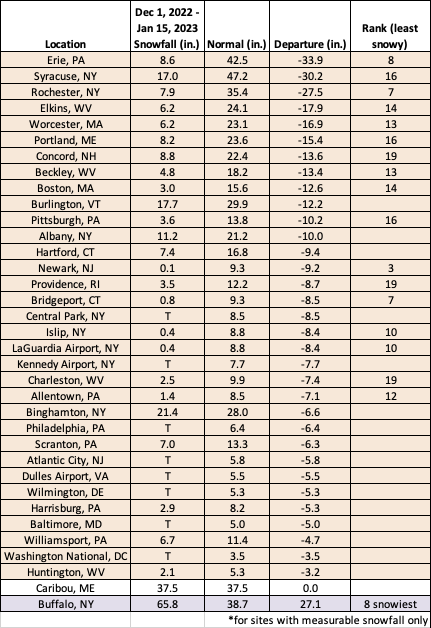
This first half of winter ranked among the 20 least snowy for 17 major climate sites but was Buffalo’s eighth snowiest.