An Atypical October
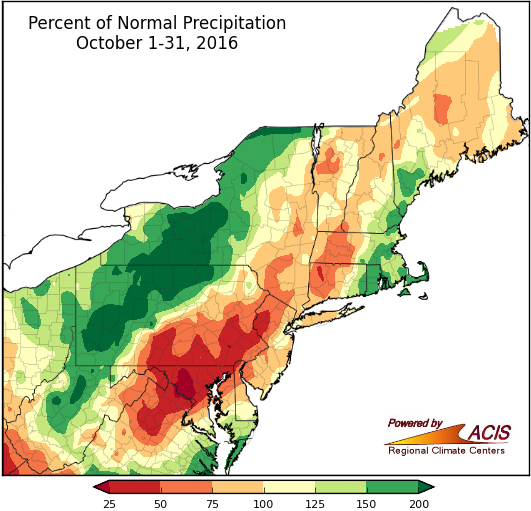
Precipitation ranged from less than 25% of normal to more than 200% of normal in October.
October precipitation was highly variable across the Northeast. Central Maryland was the driest area, seeing less than a quarter of its normal October precipitation, while portions of New York, Pennsylvania, and West Virginia were the wettest areas, receiving more than double their normal October precipitation. Twenty of the region’s 35 major climate sites were drier than normal, with six ranking this October among their top 20 driest. Conversely, ten of the fifteen wetter-than-normal sites ranked this October among their top 20 wettest.
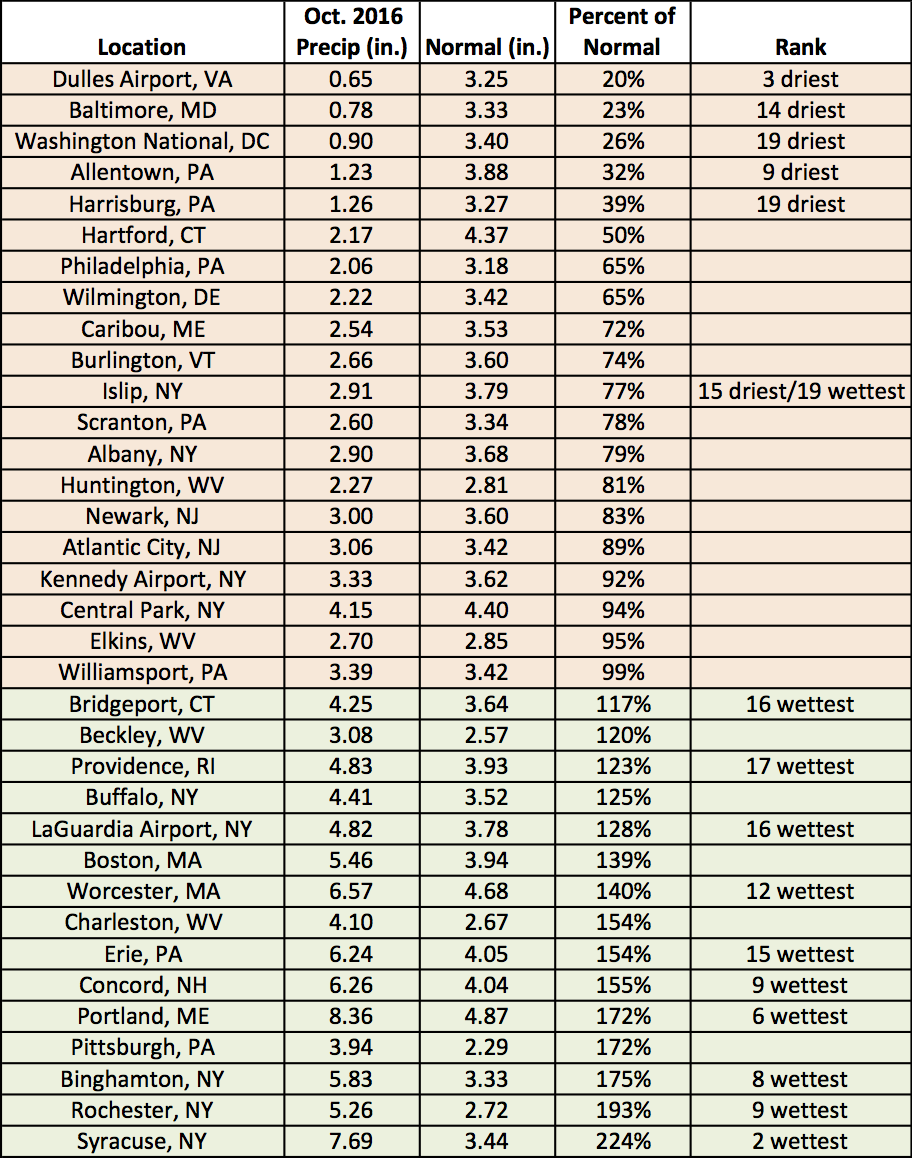
October precipitation at the major climate sites ranged from 20 percent of normal at Dulles Airport, VA to 224 percent of normal in Syracuse, NY.
Drought conditions generally improved or remained unchanged in areas that saw above-normal precipitation. For instance, extreme drought eased in central New York, but remained in Massachusetts and southeastern New Hampshire. However, conditions deteriorated in several areas that saw below-normal precipitation, such as northern New Jersey, the eastern half of New York, and portions of northern New England.
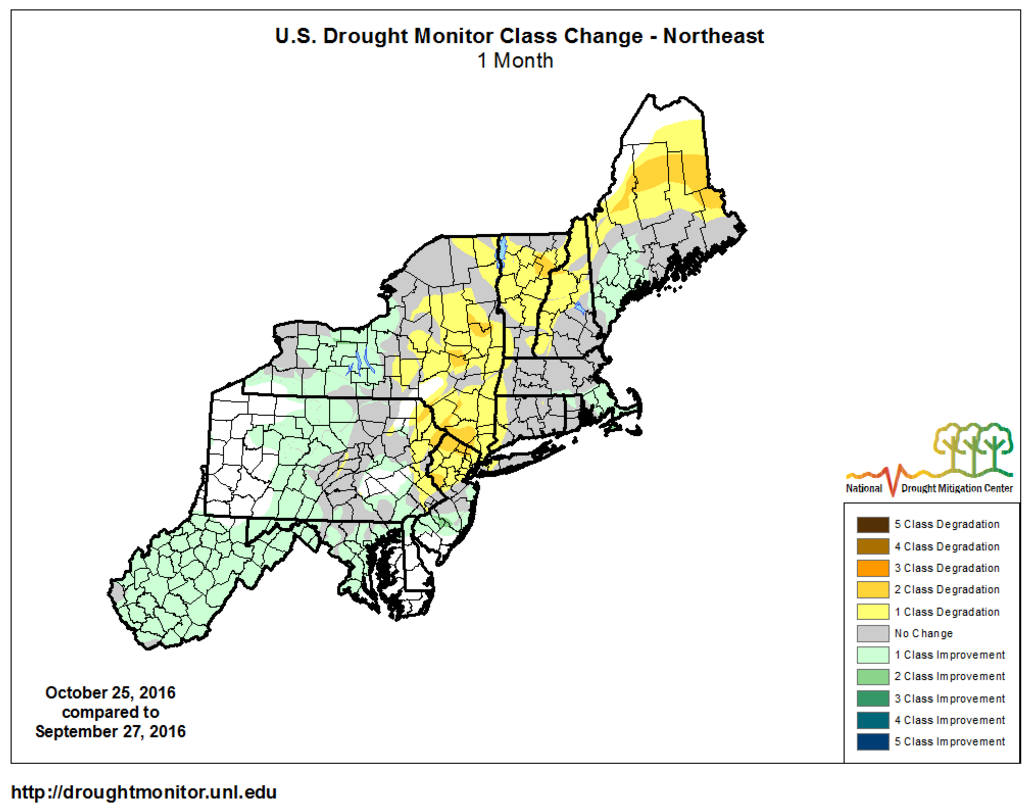
Drought conditions improved in areas shaded green, deteriorated in areas shaded yellow, and remained unchanged in areas shaded gray.
Parts of the Northeast also saw their first measurable and/or inch of snow of the season. Higher elevations of New York, Vermont, and New Hampshire reported one-day snow totals of up to 7 inches on October 23, while other parts of New York and western New England reported snow totals of up to 9 inches between October 27 and 28. The snow fell ahead of schedule for some sites. For example, Albany, NY’s average date for the first inch of snow is November 30 (based on 1981-2010). This year, the site picked up 1.7 inches on October 27, a full month ahead of schedule and tying (with 2011) as the second earliest first inch of snow behind October 4, 1987.
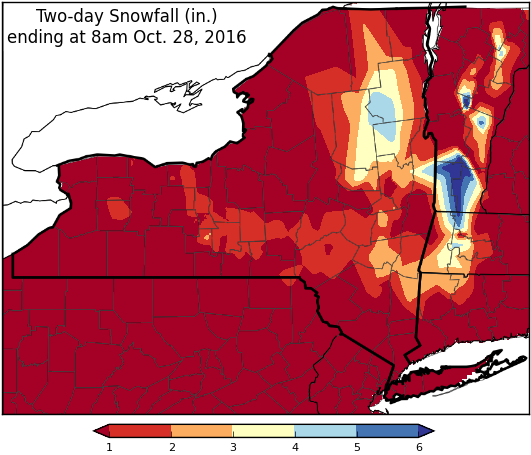
Several sites in New York and western New England saw their first inch of snow in late October, earlier than average.
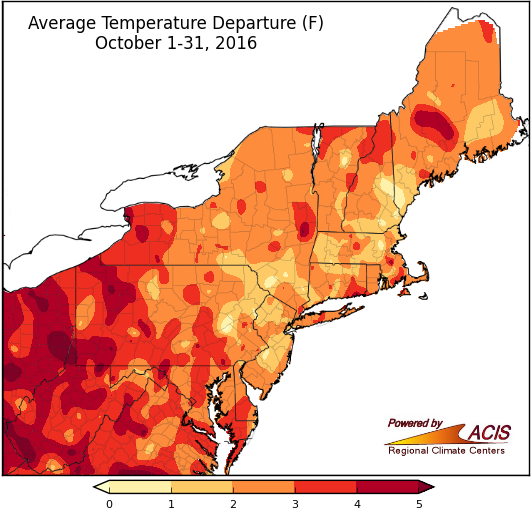
Average temperatures for October were above normal for most areas.
October was another warmer-than-normal month for the Northeast, with average temperatures ranging from 1°F to 5°F above normal for a majority of the region. The largest departures of more than 5°F above normal were in northern and southwestern West Virginia. All of the 35 major climate sites were warmer than normal, with sixteen ranking this October among their top 20 warmest.
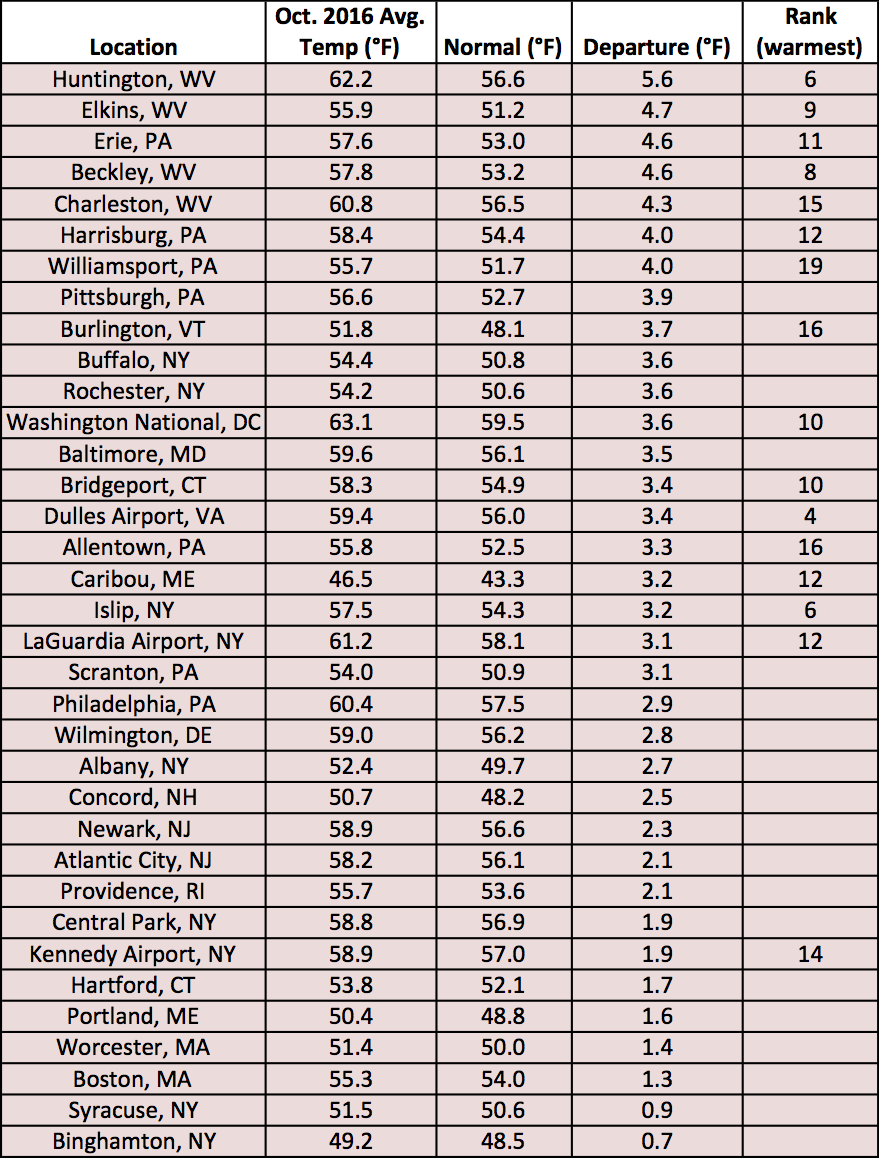
Average temperatures at the major climate sites ranged 0.7°F above normal in Binghamton, NY to 5.6°F in Huntington, WV.
The above-normal temperatures could linger through November. The Climate Prediction Center’s latest monthly outlook shows an increased chance of above-normal temperatures for November. The precipitation outlook calls for an increased chance of below-normal precipitation for southern portions of the region, with equal chances of below-, near-, or above-normal precipitation elsewhere.
Climate Prediction Center’s November temperature outlook.
Climate Prediction Center’s November precipitation outlook.