September Similarities in Mid-October
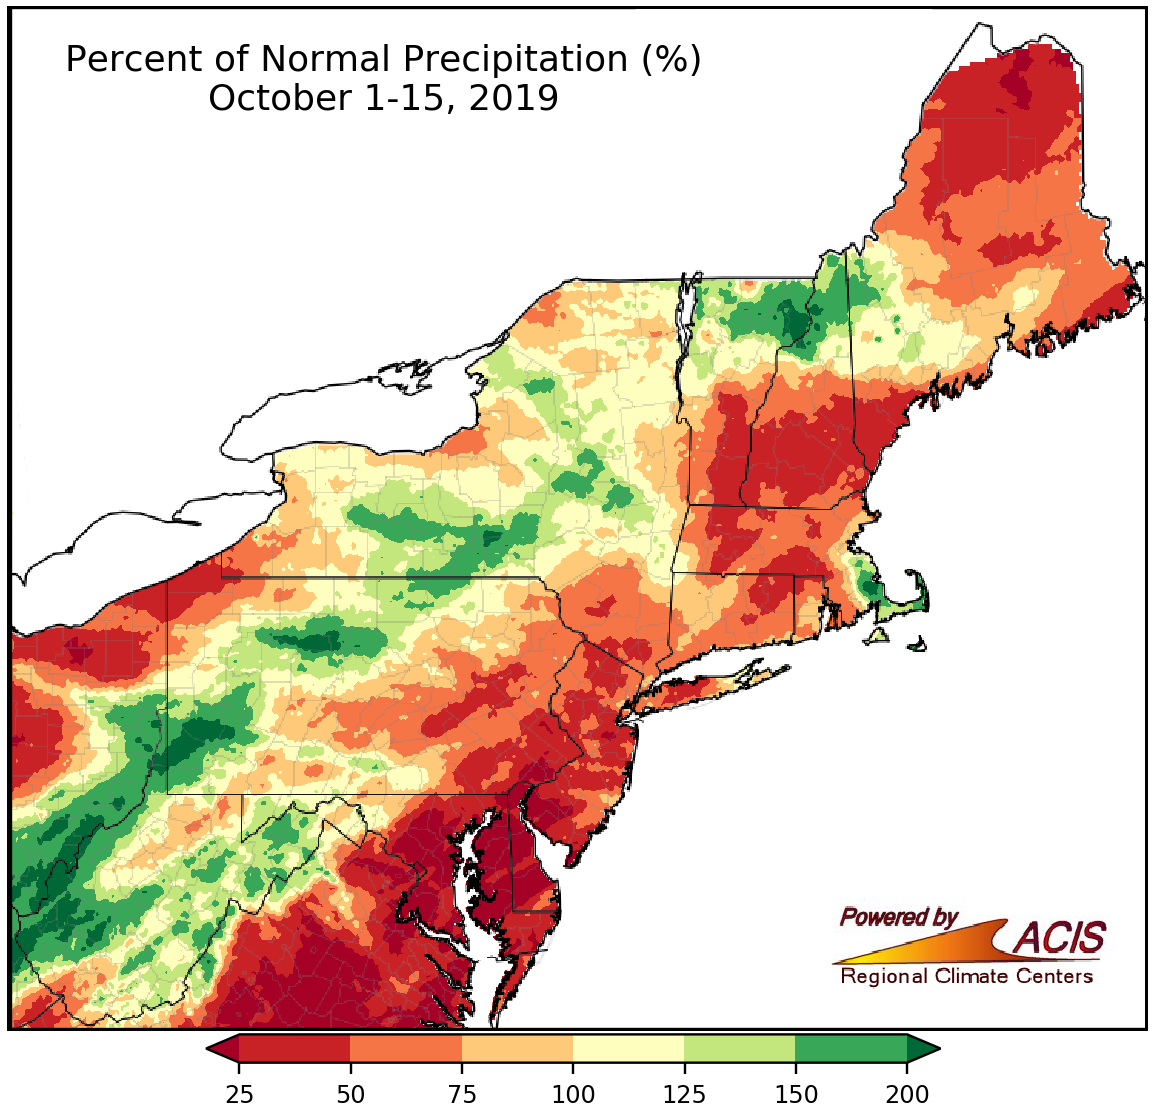
Precipitation during the first half of October ranged from less than 25% of normal to more than 200% of normal.
The first half of October was generally drier than normal for an area stretching from southern Maryland to northern Maine (except southeastern Massachusetts and western Maine), with the driest locations seeing less than 25% of normal precipitation. Twenty-seven of the region’s 35 major climate sites received below-normal precipitation from October 1-15, with five sites ranking the period among their 20 driest. For many areas, it was a continuation of exceptionally dry conditions experienced in September and contributed to the expansion of drought and abnormal dryness.
For an area stretching from western West Virginia to northern New Hampshire, the October 1-15 period was generally wetter than normal, with the wettest locations seeing over 200% of normal precipitation. Of the eight wetter-than-normal major climate sites, four ranked this October 1-15 period among their 20 wettest. The rain was much-needed in West Virginia where very little precipitation had fallen since late August, leading to drought. The precipitation finally brought an end to Huntington’s longest streak of days with less than or equal to 0.01 inches of precipitation at 38 days from August 28-October 5. October 7 was particularly wet, ranking among the seven wettest October days on record (since the 1890s) for Huntington and Charleston. The precipitation improved dryness in portions of that state, as well as in parts of New York and northern New England.
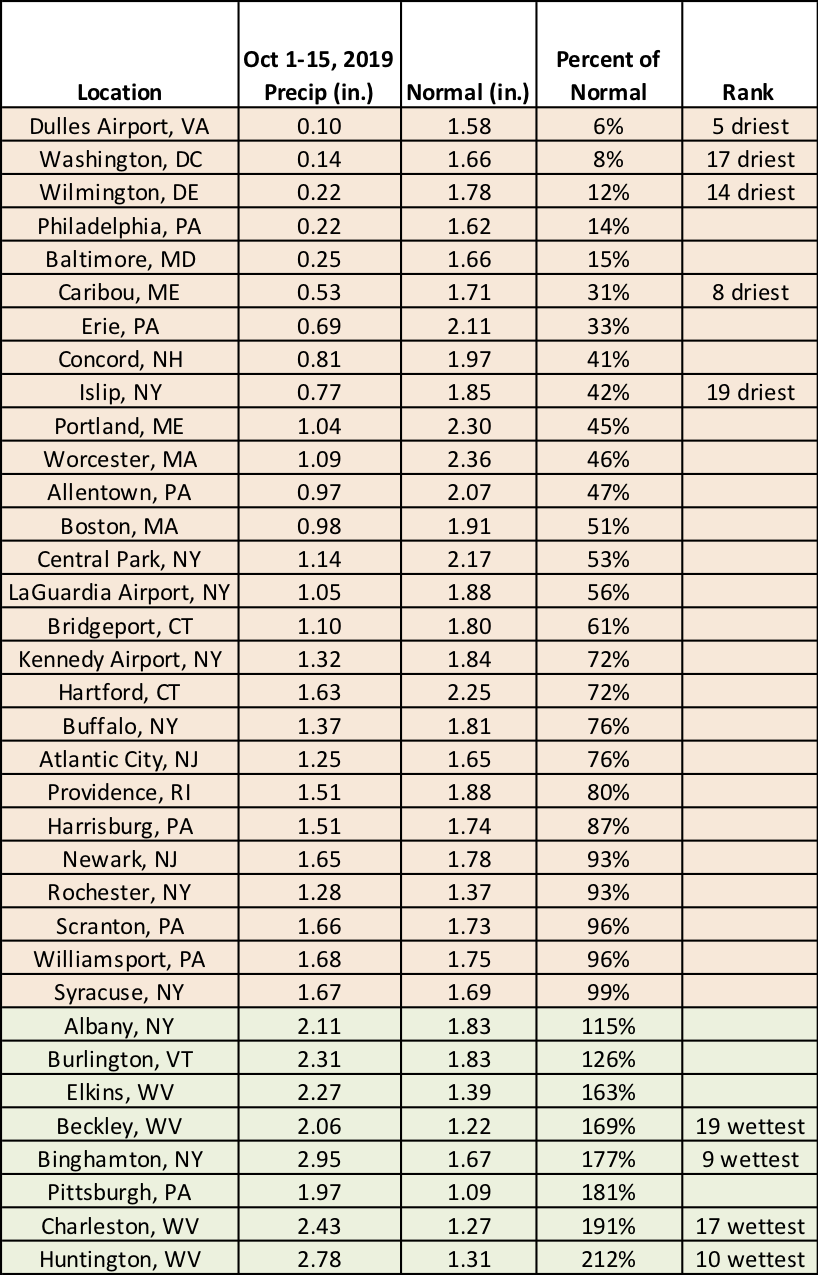
October 1-15 precipitation ranged from 6% of normal at Dulles Airport to 212% of normal in Huntington, WV.
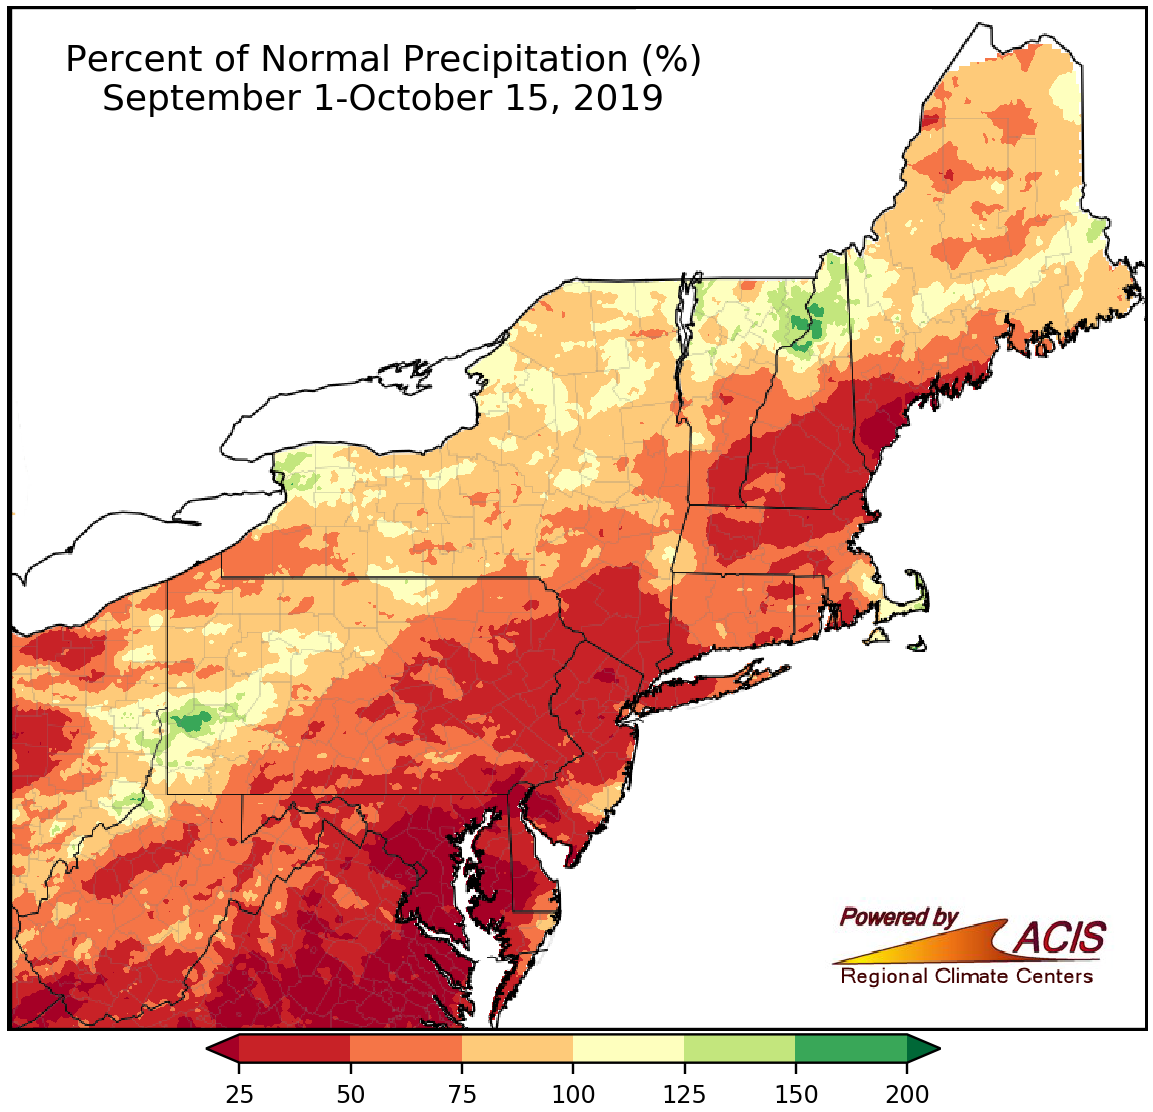
Fall-to-date precipitation was below normal for most of the Northeast.
The September 1-October 15 period was drier than normal for a majority of the Northeast, with the driest locations seeing less than 25% of normal precipitation. In fact, it was record dry for Dulles Airport, Wilmington, Islip, and LaGuardia Airport. Overall, 31 major climate sites had a drier-than-normal first half of fall, with 16 of those ranking it among their 20 driest. However, two of the four wetter-than-normal sites ranked the period among their 20 wettest.
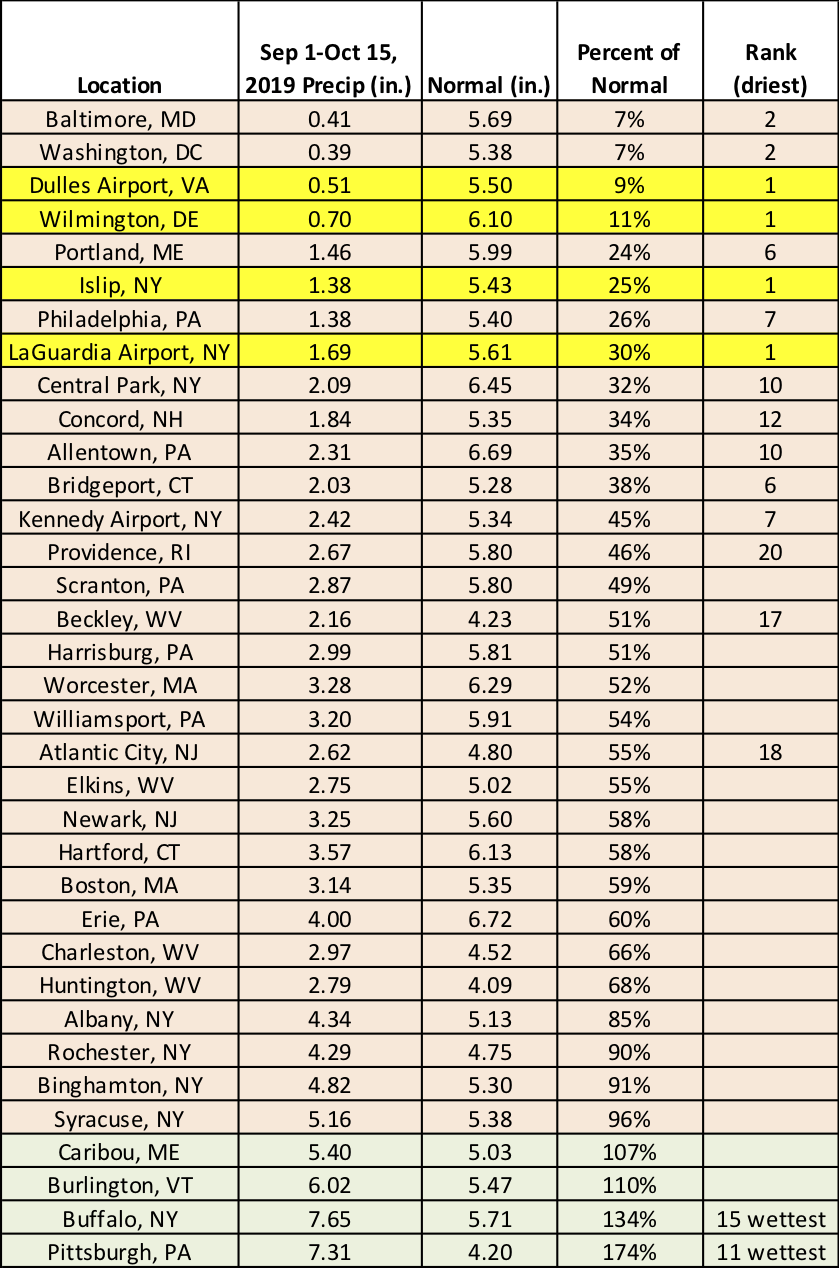
Four major climate sites had their driest first half of fall on record.
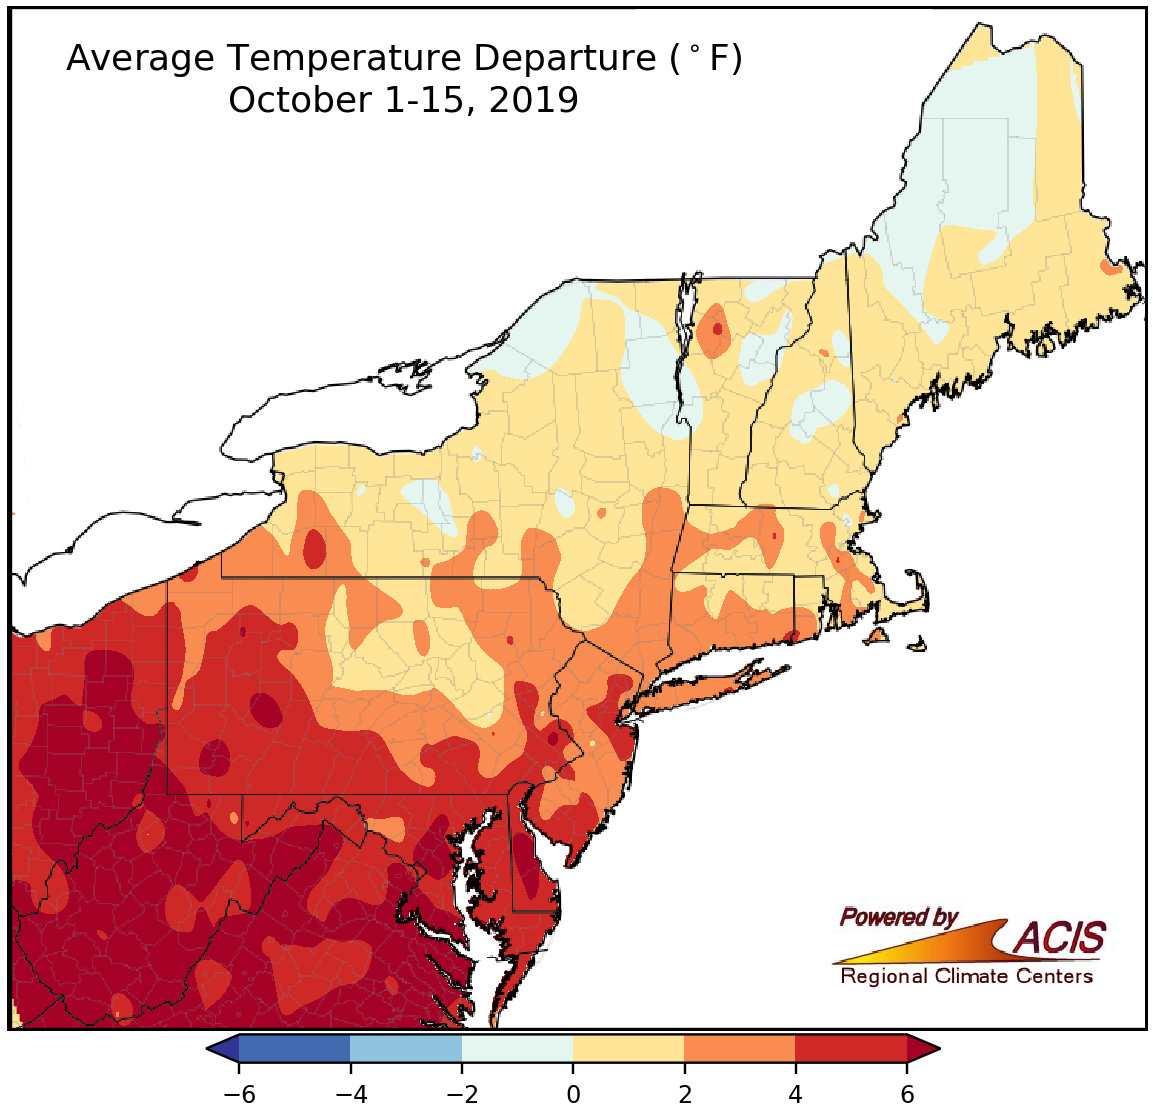
During the first two weeks of October, average temperatures ranged from 2°F below normal to more than 6°F above normal.
Unusually hot temperatures kicked off October and contributed to a warmer-than-normal first half of the month for much of the Northeast. Average temperatures in the warmest areas were more than 6°F above normal. All 35 major climate sites had a warmer-than-normal start to October, with 15 sites ranking this October 1-15 period among their 20 warmest on record.
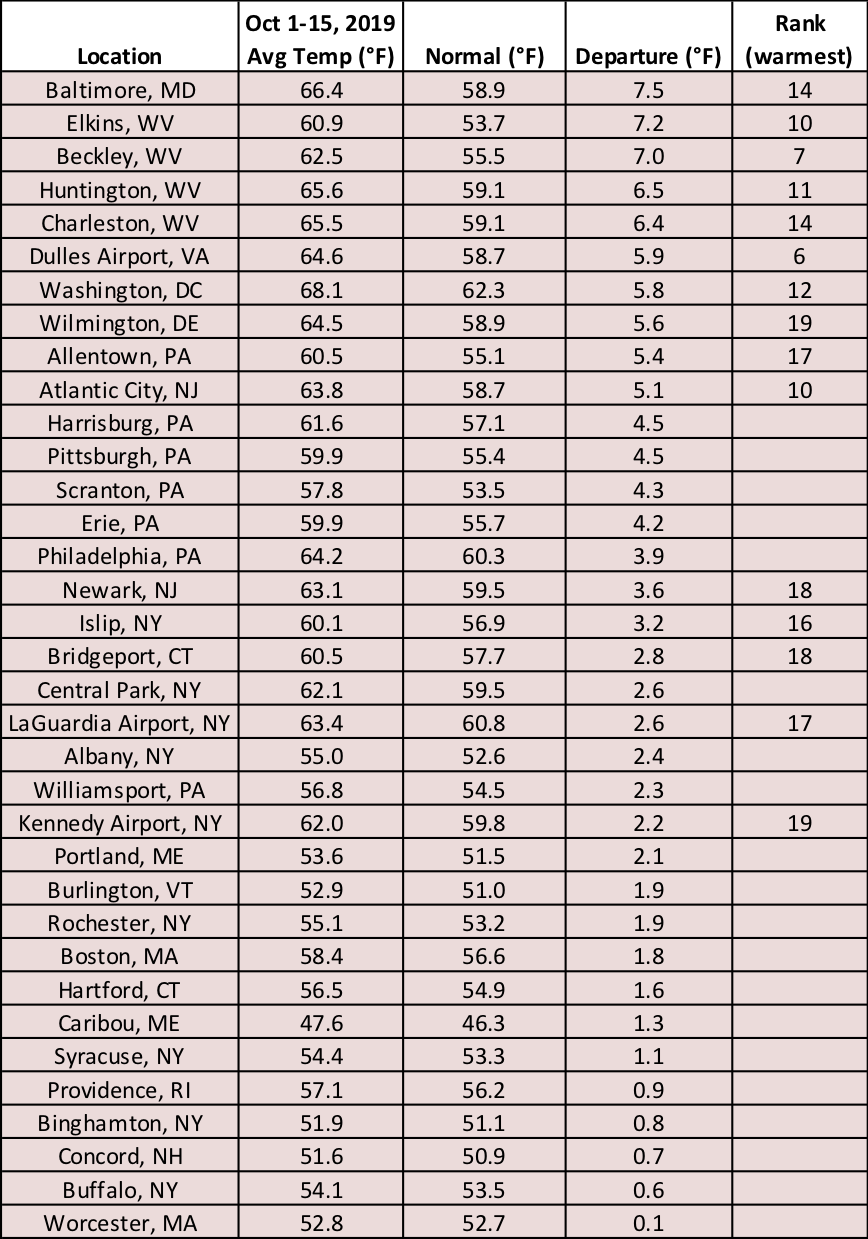
The October 1-15 period was as much as 7.5°F warmer than normal at the major climate sites.
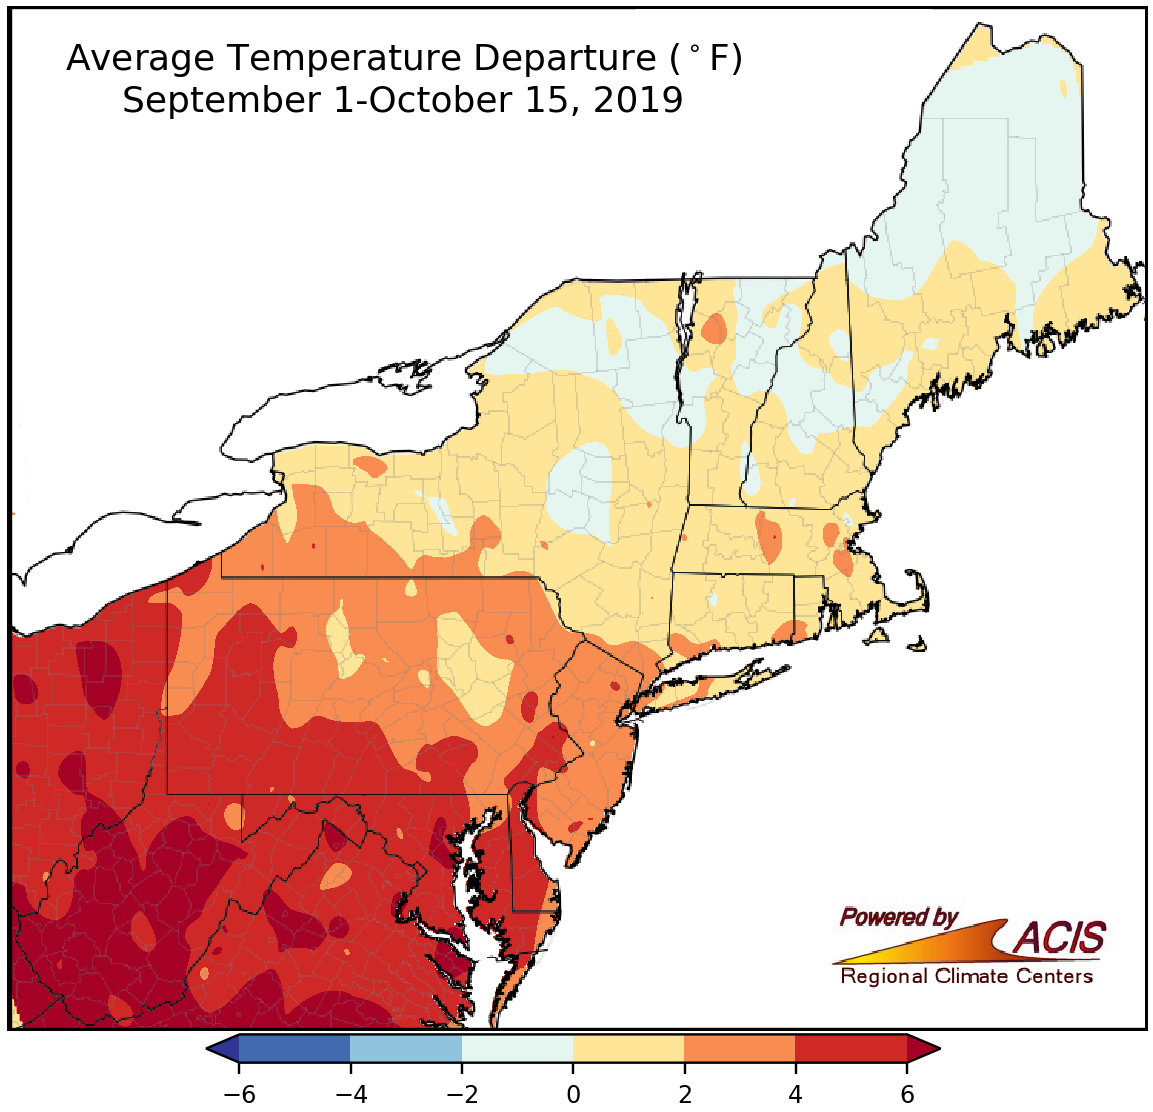
Average temperatures during the first half of fall ranged from 2°F below normal to more than 6°F above normal.
The temperature patterns during September and the first half of October were very similar, with a few locations in New York and northern New England being cooler than normal and the rest of the region, particularly southern areas, being warmer than normal. So for the September 1-October 15 period, average temperatures in the warmest areas were more than 6°F above normal and all major climate sites were warmer than normal. It was the hottest first half of fall on record for Beckley and another 20 sites ranked the period among their 20 warmest on record.
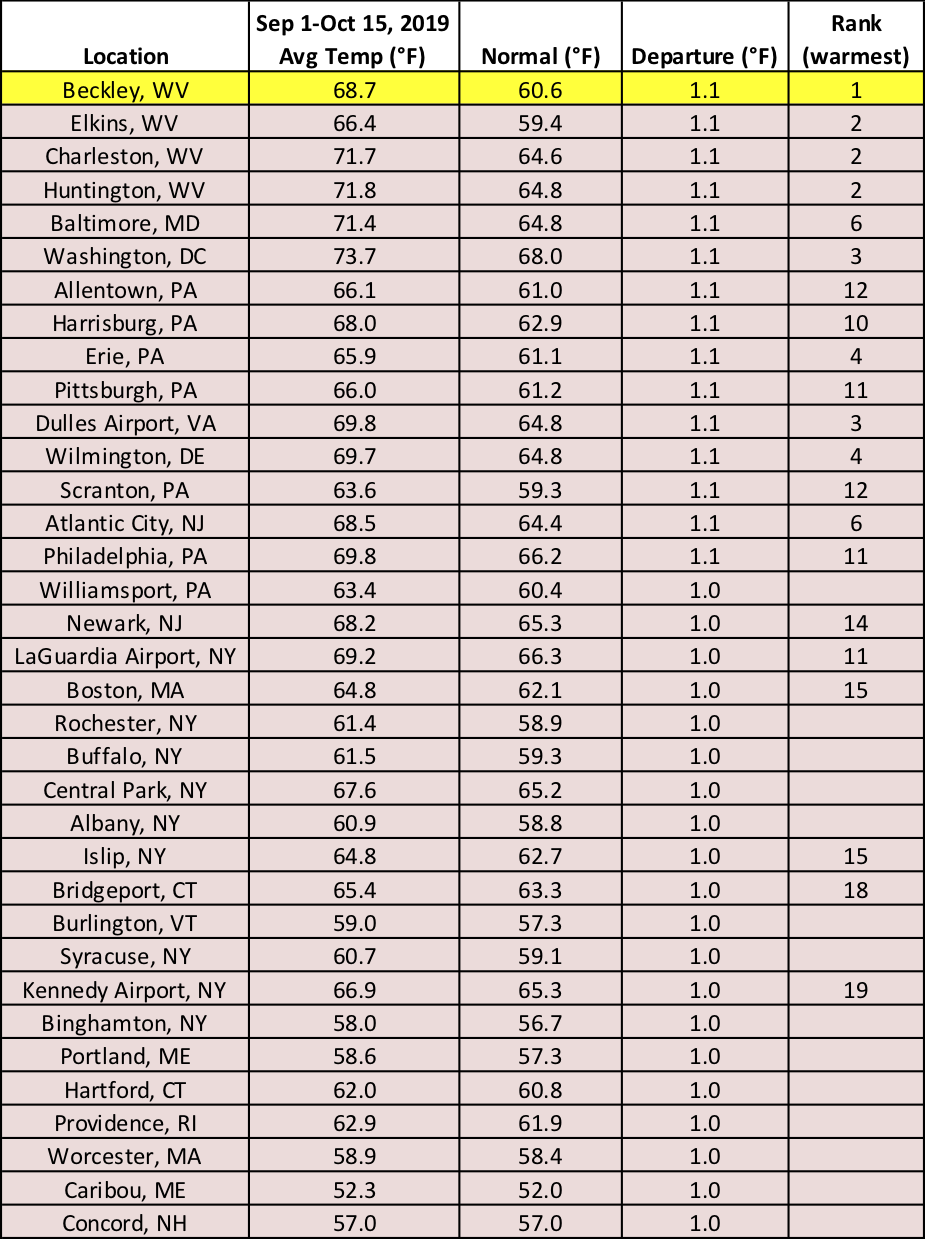
Beckley had its hottest September 1-October 15 period on record.