What Happens to Water Underground?
Many aspects of the water cycle are well known, but what happens to water once it moves underground? After a heavy rainstorm, many people are curious as to how the ground can soak up so much water without flooding a certain area. Water that doesn’t flow into lakes or rivers slowly seeps through the surface of the earth and will usually get absorbed by plants or will fall deeper beneath the planet’s surface until it can no longer go any further.
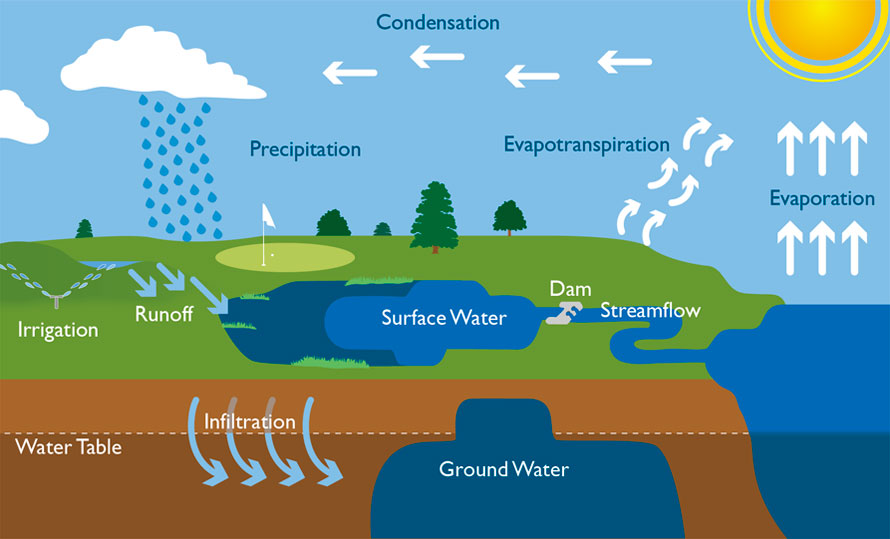
Rain, snowmelt, and excess water from irrigation are some ways that water can percolate below the surface of earth. Image courtesy of NOAA.
Underground, water doesn’t move much, but rather acts like a sponge, taking up spaces in between cracks in rocks and breaks in the soil. Water that moves into a natural storage area (called an aquifer) beneath the surface of the earth is referred to as groundwater. Unconfined aquifers are areas made up of soil or rocks that water can easily move through. Wells can be drilled to obtain the water, and is a relatively quick process for accessing usable water.
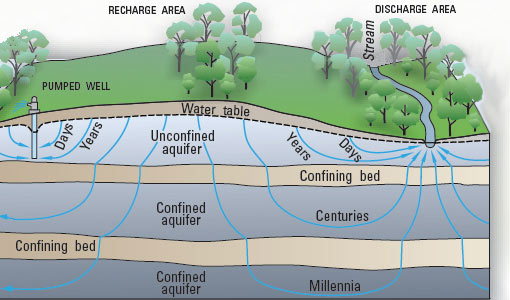
Water can take anywhere from days to millennia to resurface once it is below ground. Image from USGS.
Confined aquifers have rock layers above and below them, making it more challenging for water to flow through them. This process can take centuries for water to become usable again. More than half of the people in the U.S use groundwater for drinking and other household uses. Although groundwater only makes up about 1.7% of all of the water on earth, over 30% of freshwater on our planet occurs as groundwater.
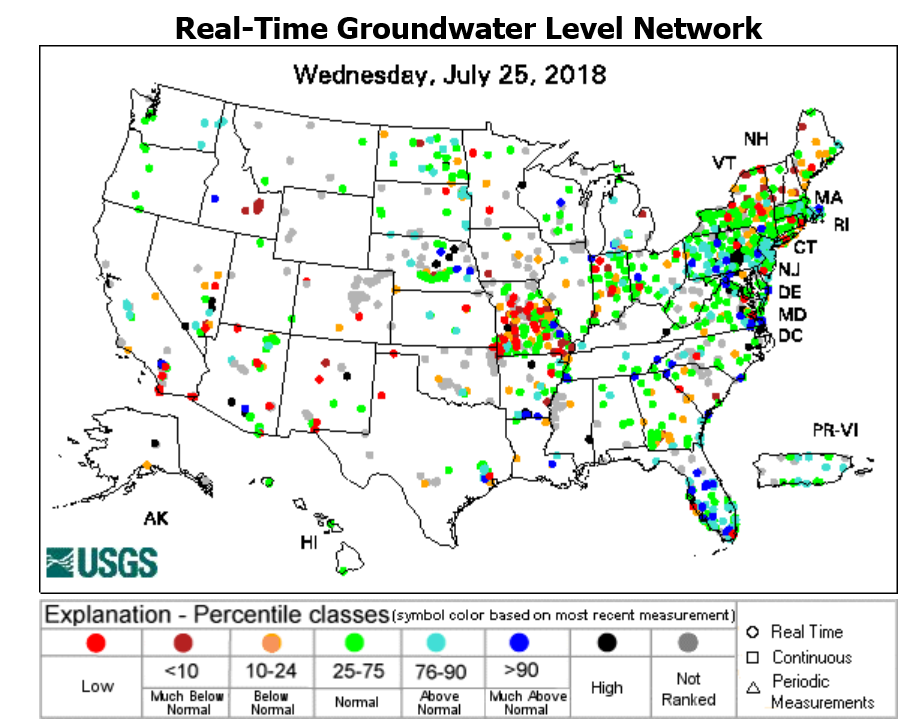
The U.S. Geological Survey monitors a network of about 200 wells to help document the effects of droughts and other climate variability on groundwater levels. Image from USGS.
During major rainfall events, such as the current flooding taking place in parts of Maryland and Pennsylvania, rivers will reach flood stages depicted on hydrographs, a type of chart depicted by NOAA. Hydrographs show the severity of flooding based on stream flow (typically measured in cubic feet per second) and the height of the water, whether it’s above or below normal levels for streams or rivers.
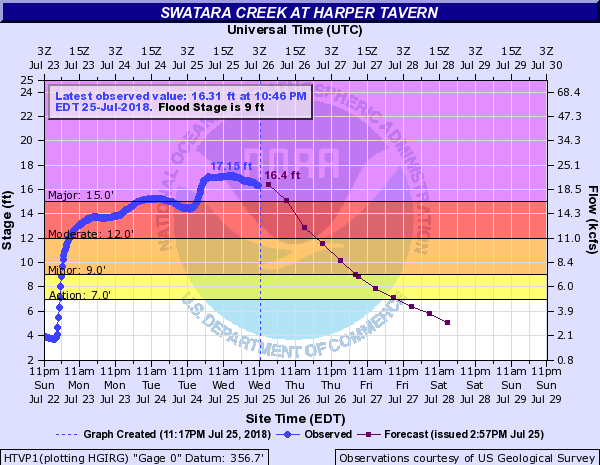
This hydrograph shows major flooding as water levels over eight feet above flood stage are impacting parts of Swatara Creek, PA as of July 25. Image from NOAA.